
OG
OG Fan Token
| تریدر | نوع سیگنال | حد سود/ضرر | زمان انتشار | مشاهده پیام |
|---|---|---|---|---|
No results found. | ||||
Price Chart of OG Fan Token
سود 3 Months :
سیگنالهای OG Fan Token
Filter
Sort messages by
Trader Type
Time Frame

CryptoAnalystSignal
تحلیل تکنیکال OG/USDT: فرصت خرید قوی در انتظار شکست کانال صعودی!
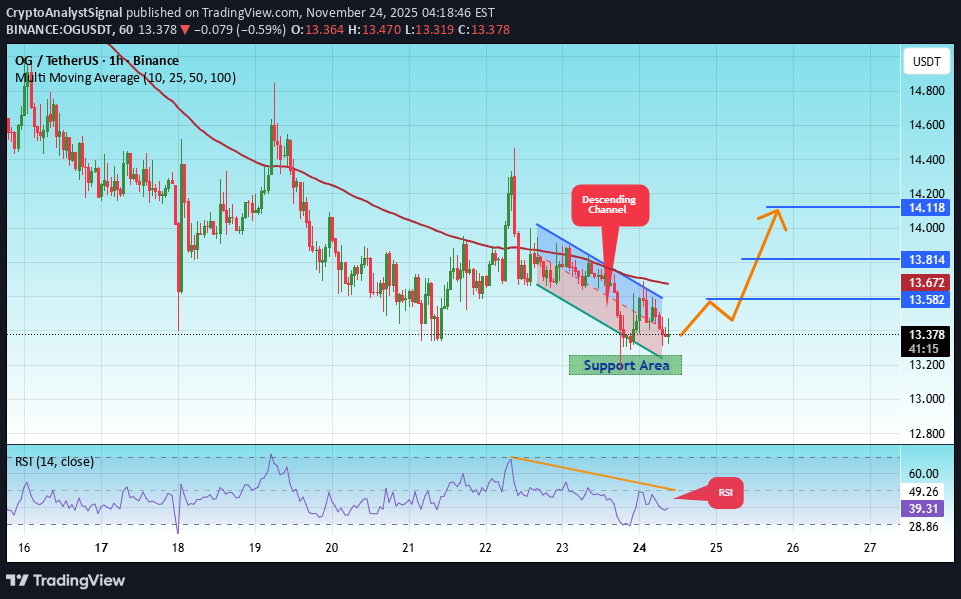
#OG The price is moving within an ascending channel on the 1-hour timeframe and is adhering to it well. It is poised to break out strongly and retest the channel. We have a downtrend line on the RSI indicator that is about to break and retest, which supports the upward move. There is a key support zone in green at 13.20, representing a strong support point. We have a trend of consolidation above the 100-period moving average. Entry price: 13.38 First target: 13.58 Second target: 13.80 Third target: 14.10 Don't forget a simple money management rule: Place your stop-loss order below the support zone in green. Once the first target is reached, save some money and then change your stop-loss order to an entry order. For any questions, please leave a comment. Thank you.

CryptoWithJames
تحلیل تکنیکال OG: شکستن گُوِه نزولی و هدف جدید قیمت در ۱۶ دلار!
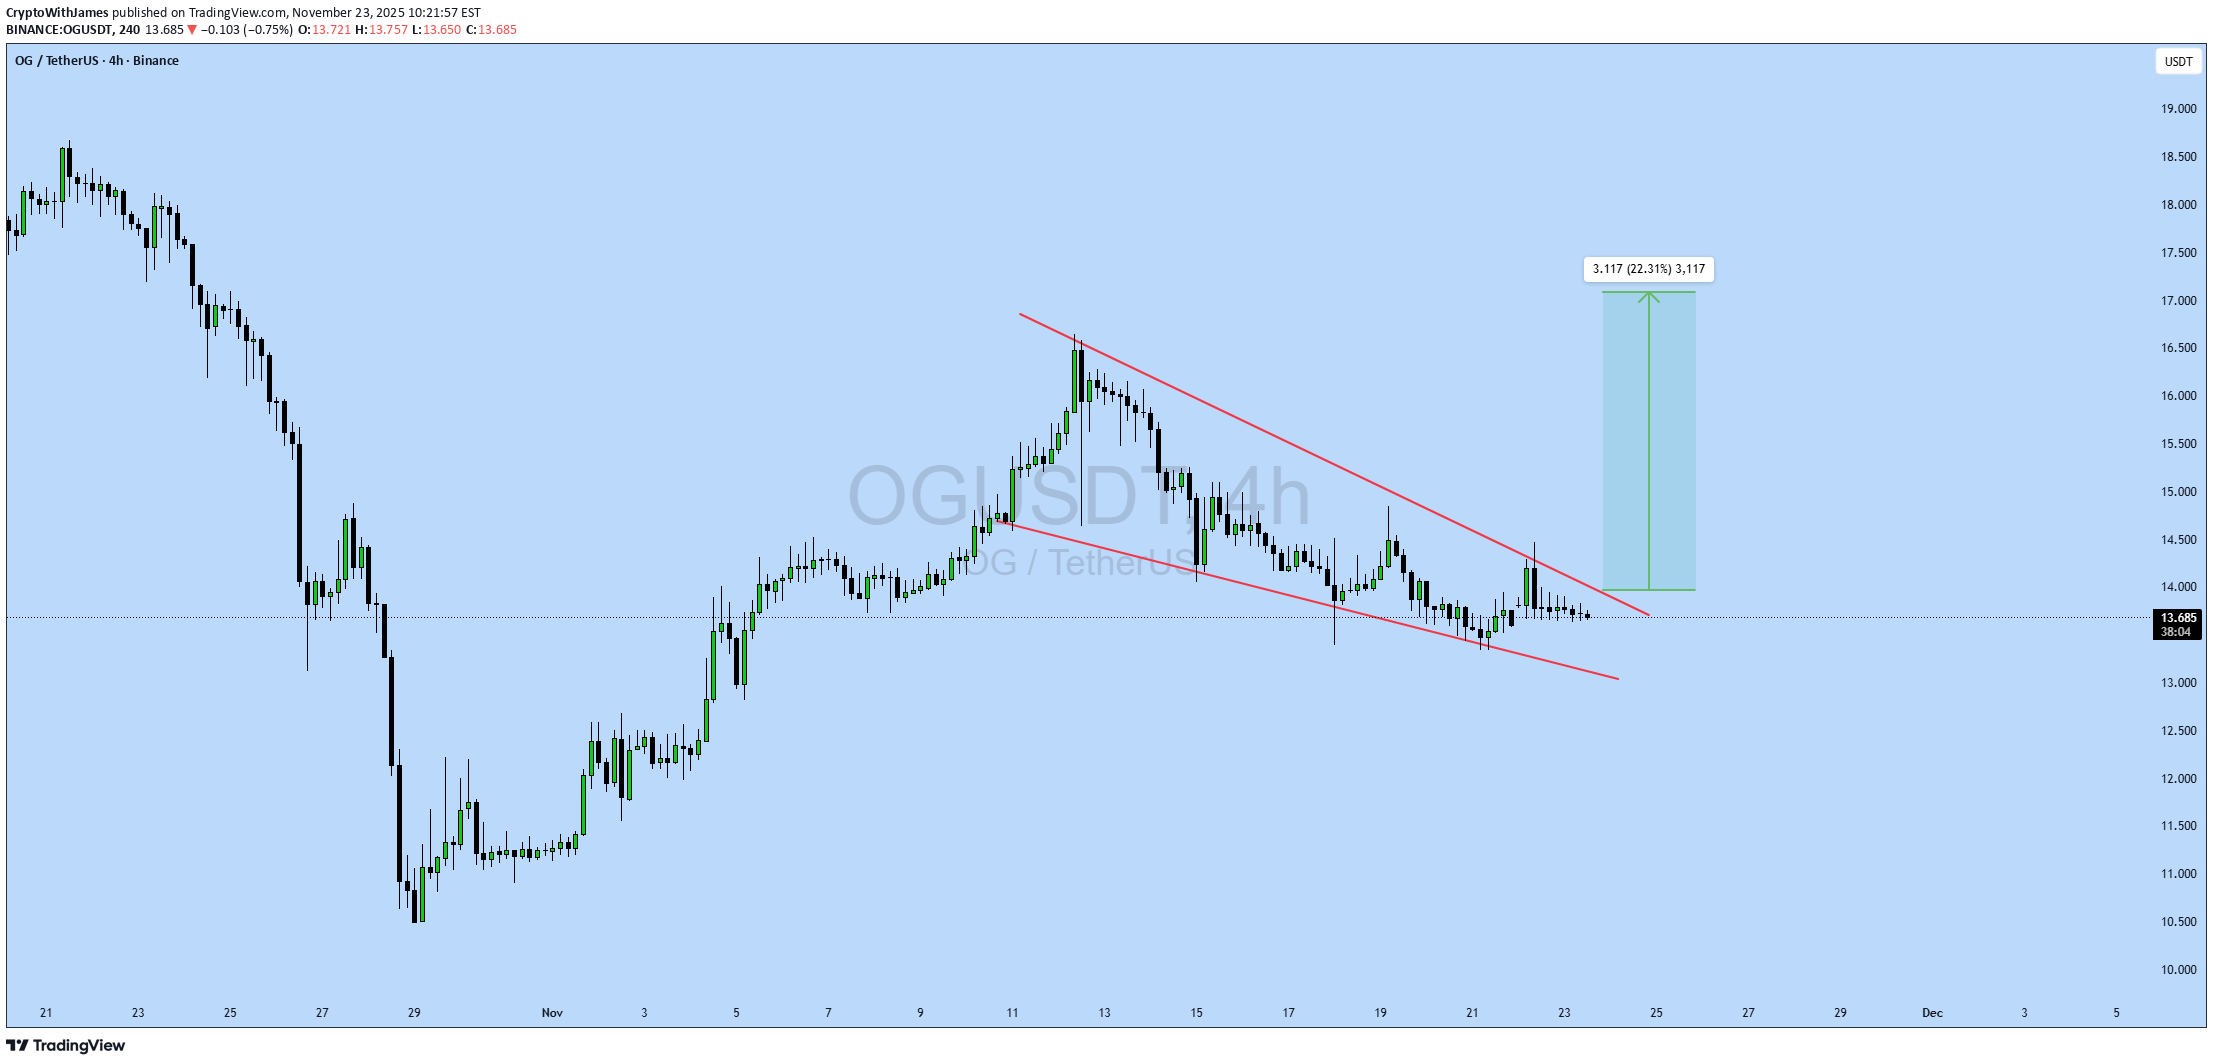
#OG UPDATE OG Technical Setup Pattern: Falling Wedge Pattern Current Price: $13.67 Target Price: $16.78 Target % Gain: 22.31% Technical Analysis: OG is breaking out of a falling wedge pattern on the 4H chart, showing early bullish momentum. The price has moved above the resistance trendline with steady candles forming near the breakout zone. The structure suggests a continuation toward the measured move target as long as the breakout holds and buyers maintain control. Time Frame: 4H Risk Management Tip: Always use proper risk management.

Bithereum_io
خرید OGUSDT: نقطه ورود طلایی و اهداف صعودی بزرگ (تحلیل 12 ساعته)
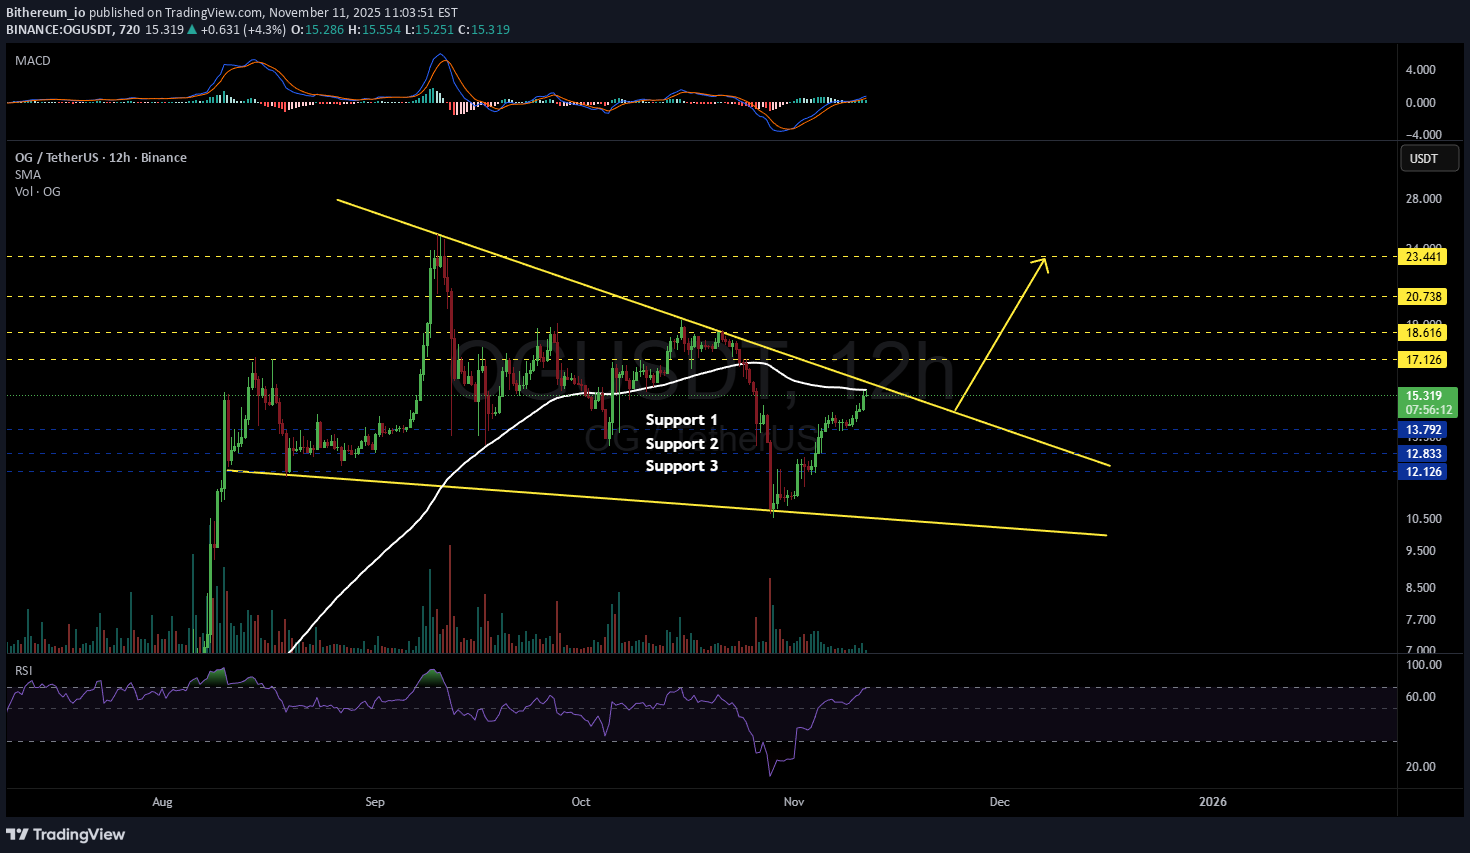
#OG is facing the descending resistance and the 12H SMA100. Consider buying here and near the support levels at: $13.792 $12.833 $12.126 In case of a breakout above both resistances, the potential targets are: 🎯 $17.126 🎯 $18.616 🎯 $20.738 🎯 $23.441 ⚠️ Always use a tight stop-loss and apply proper risk management.

Crypto_robotics
تحلیل OG/USDT: سیگنال خرید قوی با احتمال رشد تا ۱۲.۷ دلار!
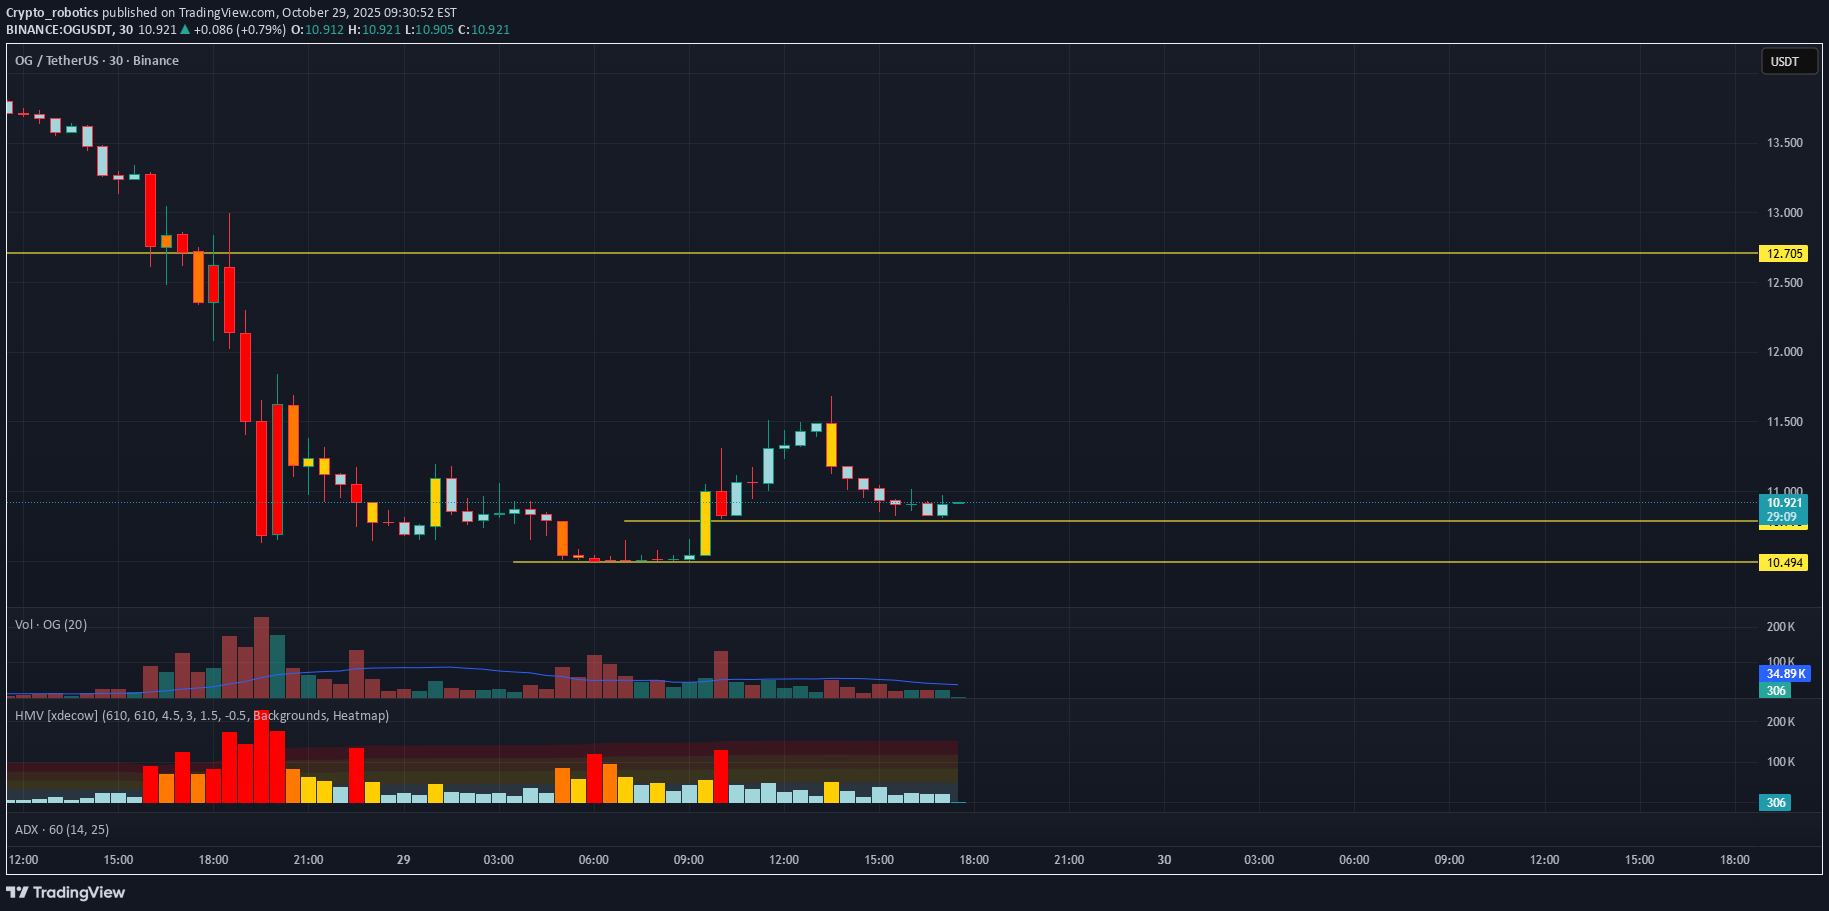
On this asset, we’ve detected a large number of volume anomalies, which suggests strong accumulation by a major player. Additionally, there’s a structural breakout on the chart, and above the current price, we can see a volume gap, creating potential for upward movement. In the order book, below $10.8, there are limit buy orders totaling around $1.7 million, which is a significant volume for this coin. We’re considering a long position from current levels or after a false breakout of $10.5, where the first signs of abnormal activity appeared. Growth target: $12.7. This publication is not financial advice.

DragonCaoB
سیگنال خرید طلا (Scalp Long - OG): کفسازی دوتایی و پتانسیل انفجاری تا کجا؟
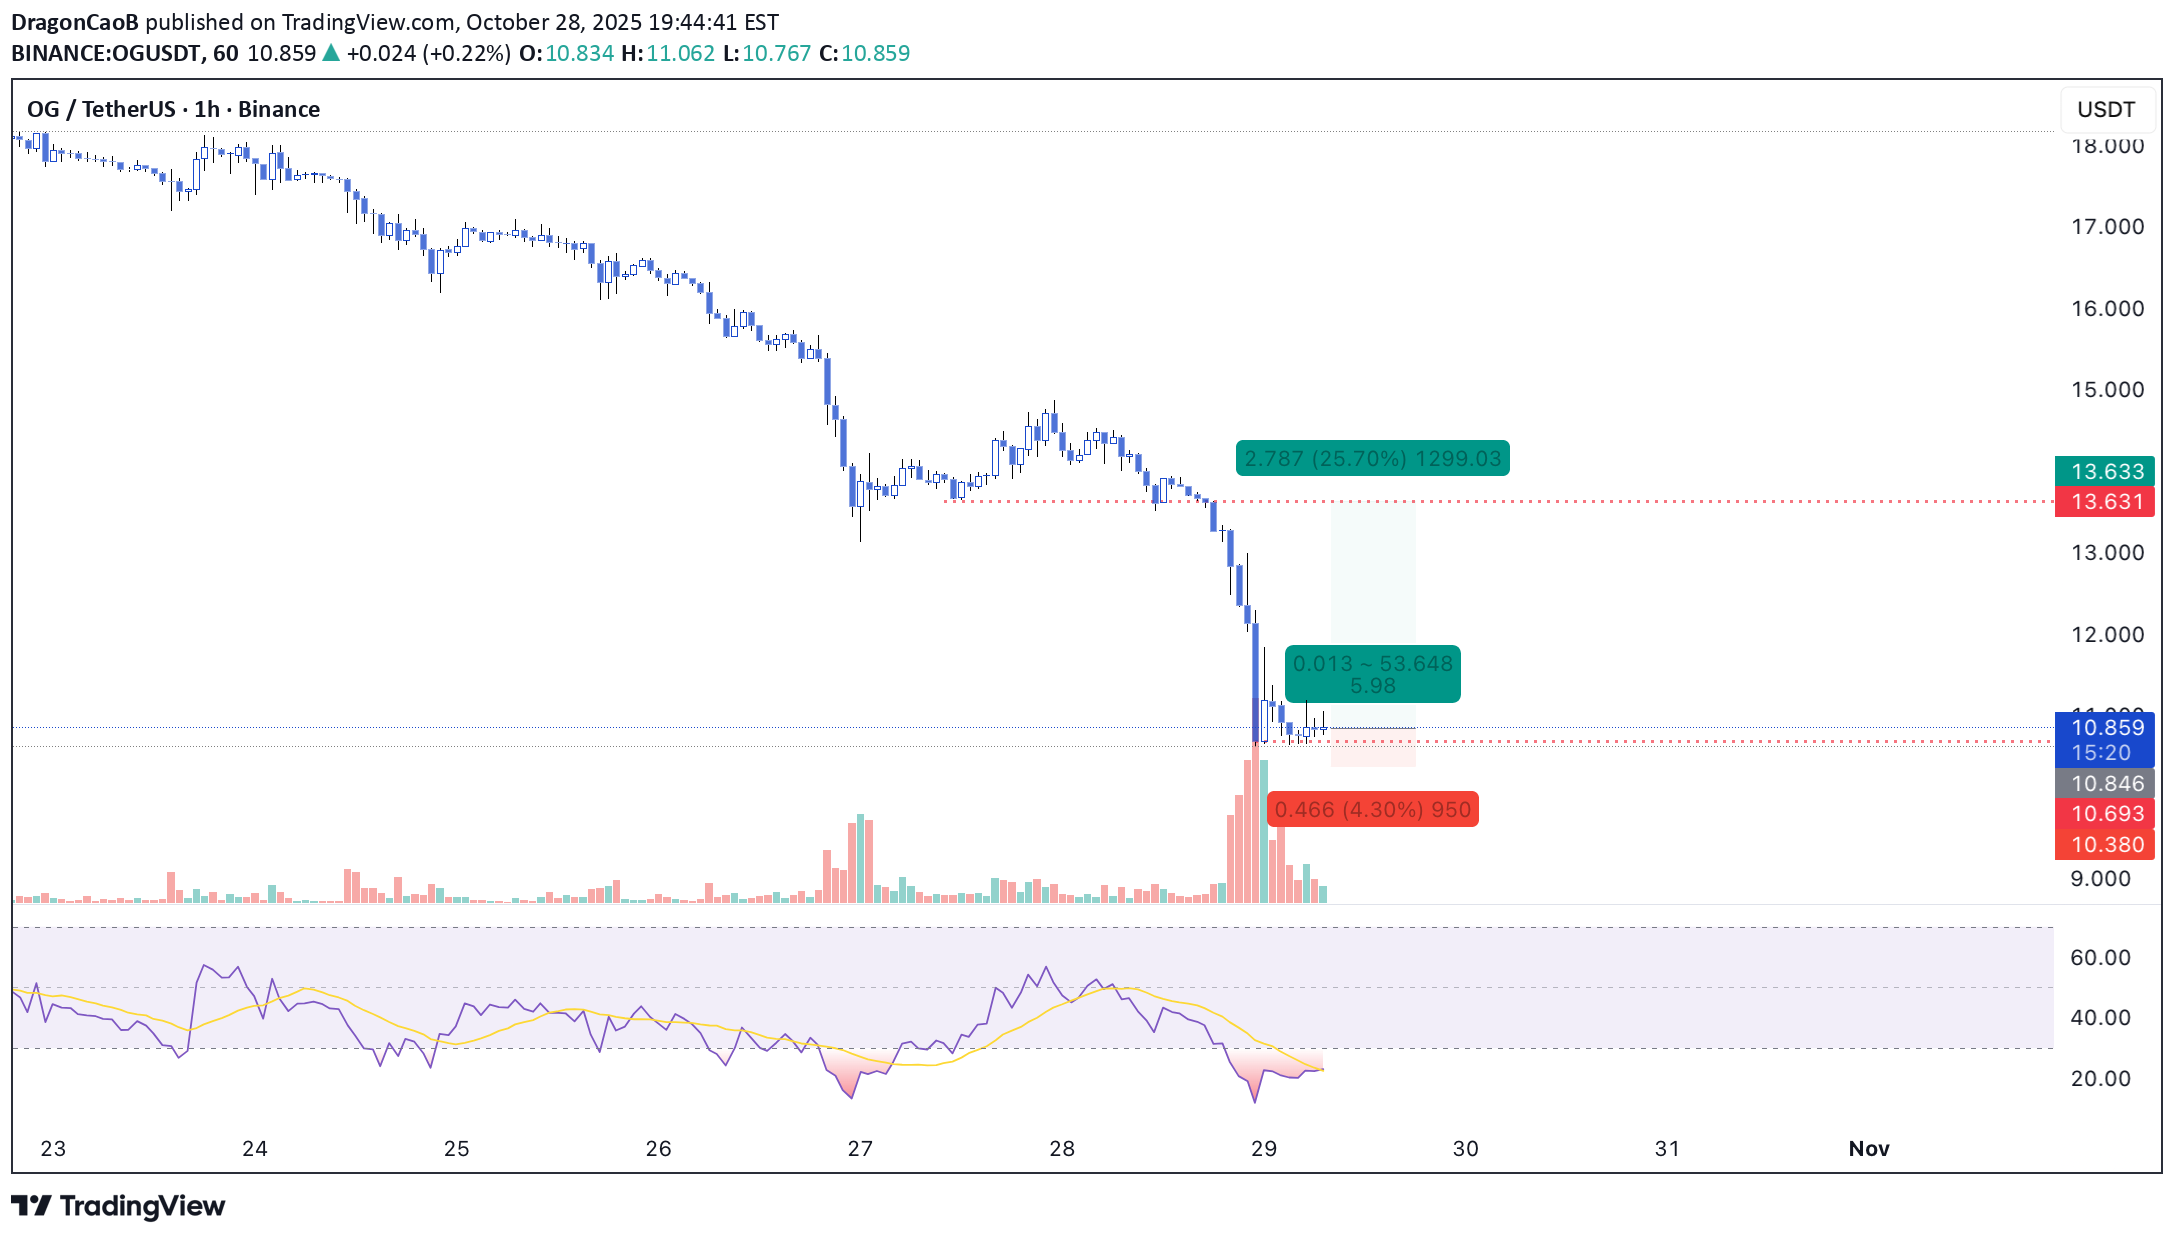
💎 Scalp Long – OG RSI indicates strong oversold conditions, forming a double-bottom pattern that suggests a potential reversal. Price is consolidating, while buying volume is gradually increasing, showing signs of a recovery setup. 🎯 Plan: → Enter after confirmation of bullish breakout from the accumulation zone. → TP: 13.63 | SL: 10.38 | RR: 1 : 5.98 Market structure favors a rebound. Keep positions lean, trail SL as price gains momentum. Stay patient — only enter once the setup confirms clearly.

CobraVanguard
نقشه راه صعودی OG: آیا قیمت به ۷۰ دلار میرسد؟

OG is trading near the upper boundary of the parallel channel formation on the weekly timeframe.The price action indicates potential for an upward breakout as momentum builds If the resistance level breaks, we could witness a strong surge toward $70

sladkamala123
رشد آینده کسبوکار شما: ترندهای مهمی که باید بدانید!

It"s interesting for future growth. The trend is clear. We"ll see where it goes.

rainbow_sniper
OGUSDT – W Pattern Add-on Signal
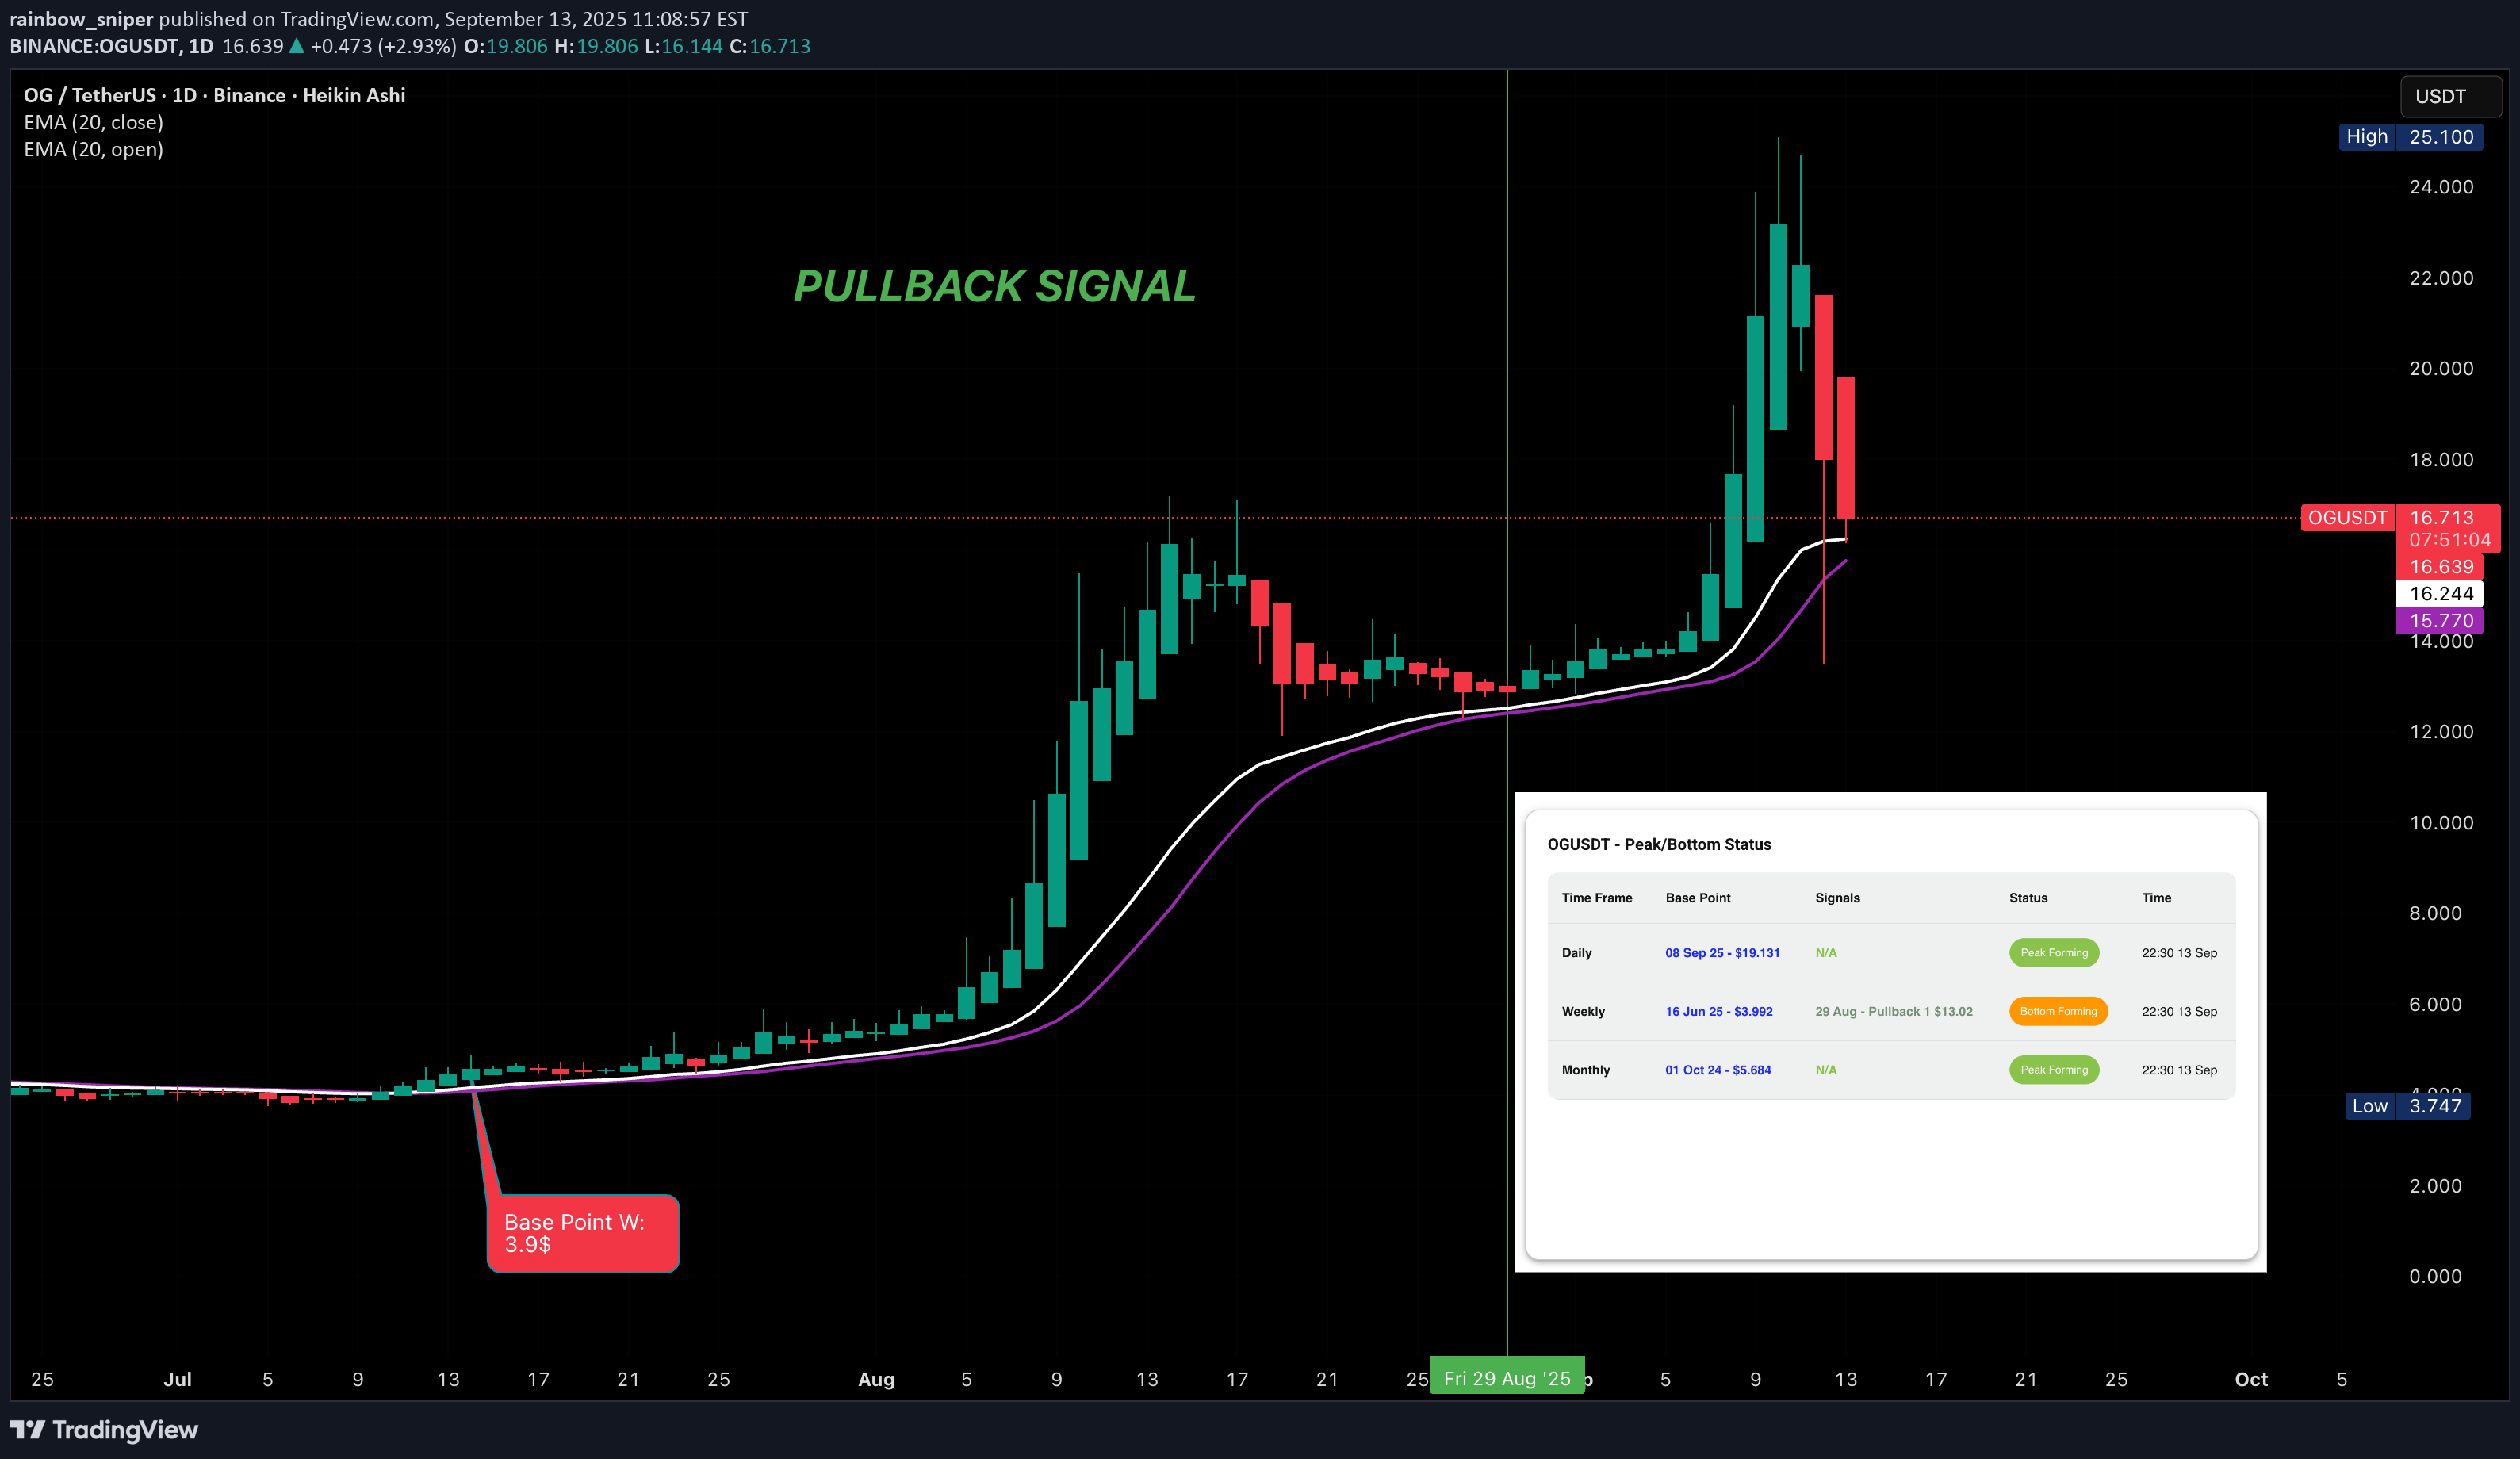
OGUSDT – W Pattern Add-on Signal In early September, I shared with my group that OGUSDT was one of the must-watch plays for this cycle. Alongside OG, we were also tracking HIFI, YGG, LINK, SOL, ETH, and others. With an automated data analysis system, signals like these can be detected and alerted in a clear and structured way. OG formed a W-pattern base at the $3 level on June 16, 2025. A pullback signal then appeared on August 28, 2025, with an entry around $13. After a short rally, on September 8, 2025, the daily timeframe confirmed a new upward leg, entering a bullish cycle toward the $24+ zone. This entire process was captured automatically, operating 24/7.

Alpha-GoldFX
OGUSDT Forming Bullish Continuation
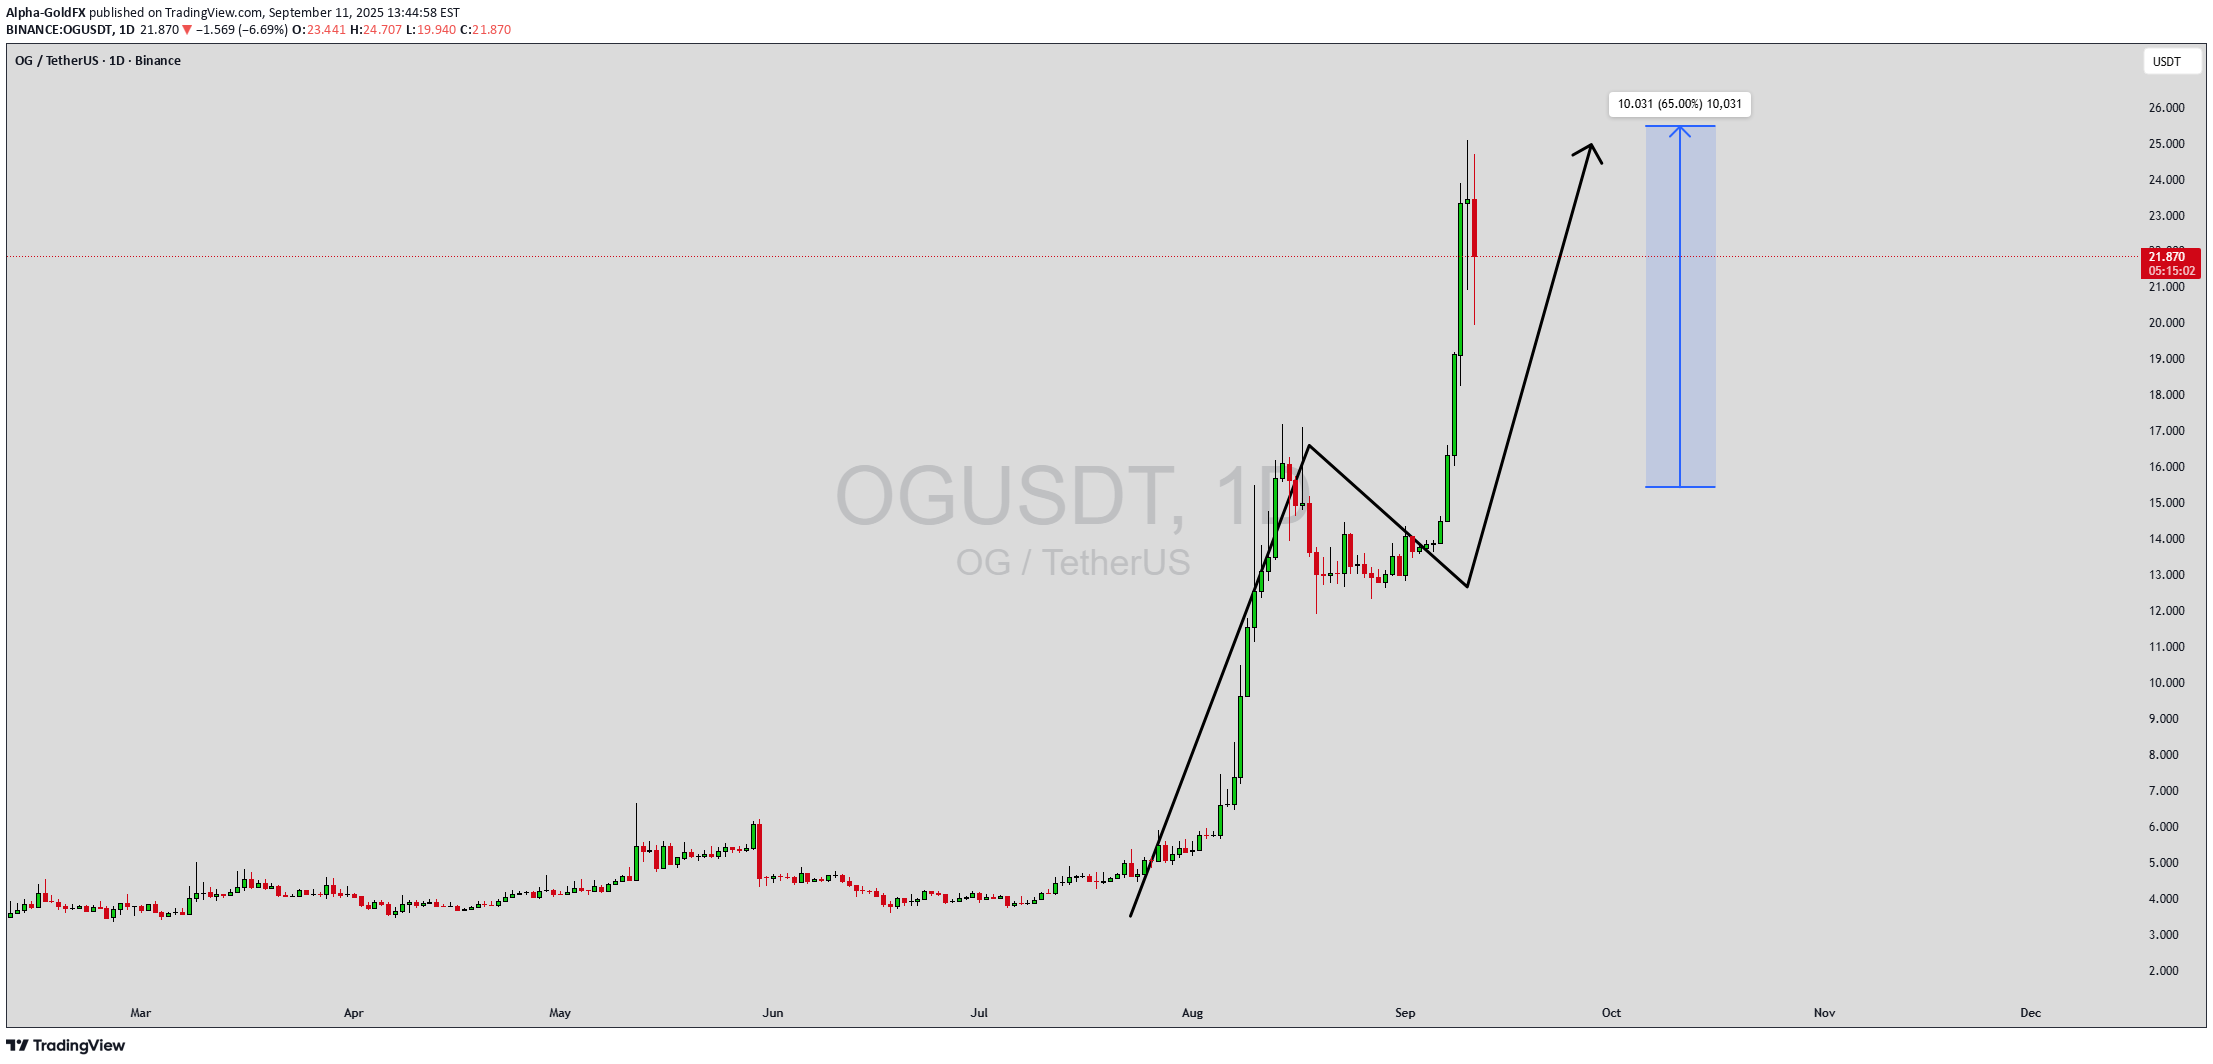
OGUSDT is currently displaying a strong bullish continuation setup, as seen in the recent price breakout and consolidation phase. After a massive rally, the pair entered a brief period of correction, which acted as a healthy retest before momentum returned to the upside. With strong buyer interest and a clear uptrend, the structure is pointing toward further gains, aligning with the 40% to 50%+ profit expectation. Volume analysis supports this move, as trading activity has remained consistently strong throughout the rally. Sustained volume during bullish retracements is often a sign of smart accumulation, indicating that investors are positioning themselves for the next leg higher. The momentum breakout has confirmed renewed strength, signaling that OGUSDT is ready to push toward new resistance levels. Investor confidence in OGUSDT continues to grow as the project gains attention in the market. The current setup provides traders with a favorable risk-to-reward ratio, especially given the clear breakout structure and potential upside targets. If momentum continues, we may see OGUSDT extend its bullish trend in the coming sessions. ✅ Show your support by hitting the like button and ✅ Leaving a comment below! (What is You opinion about this Coin) Your feedback and engagement keep me inspired to share more insightful market analysis with you!
Alpha-GoldFX
OGUSDT Forming Bullish Continuation
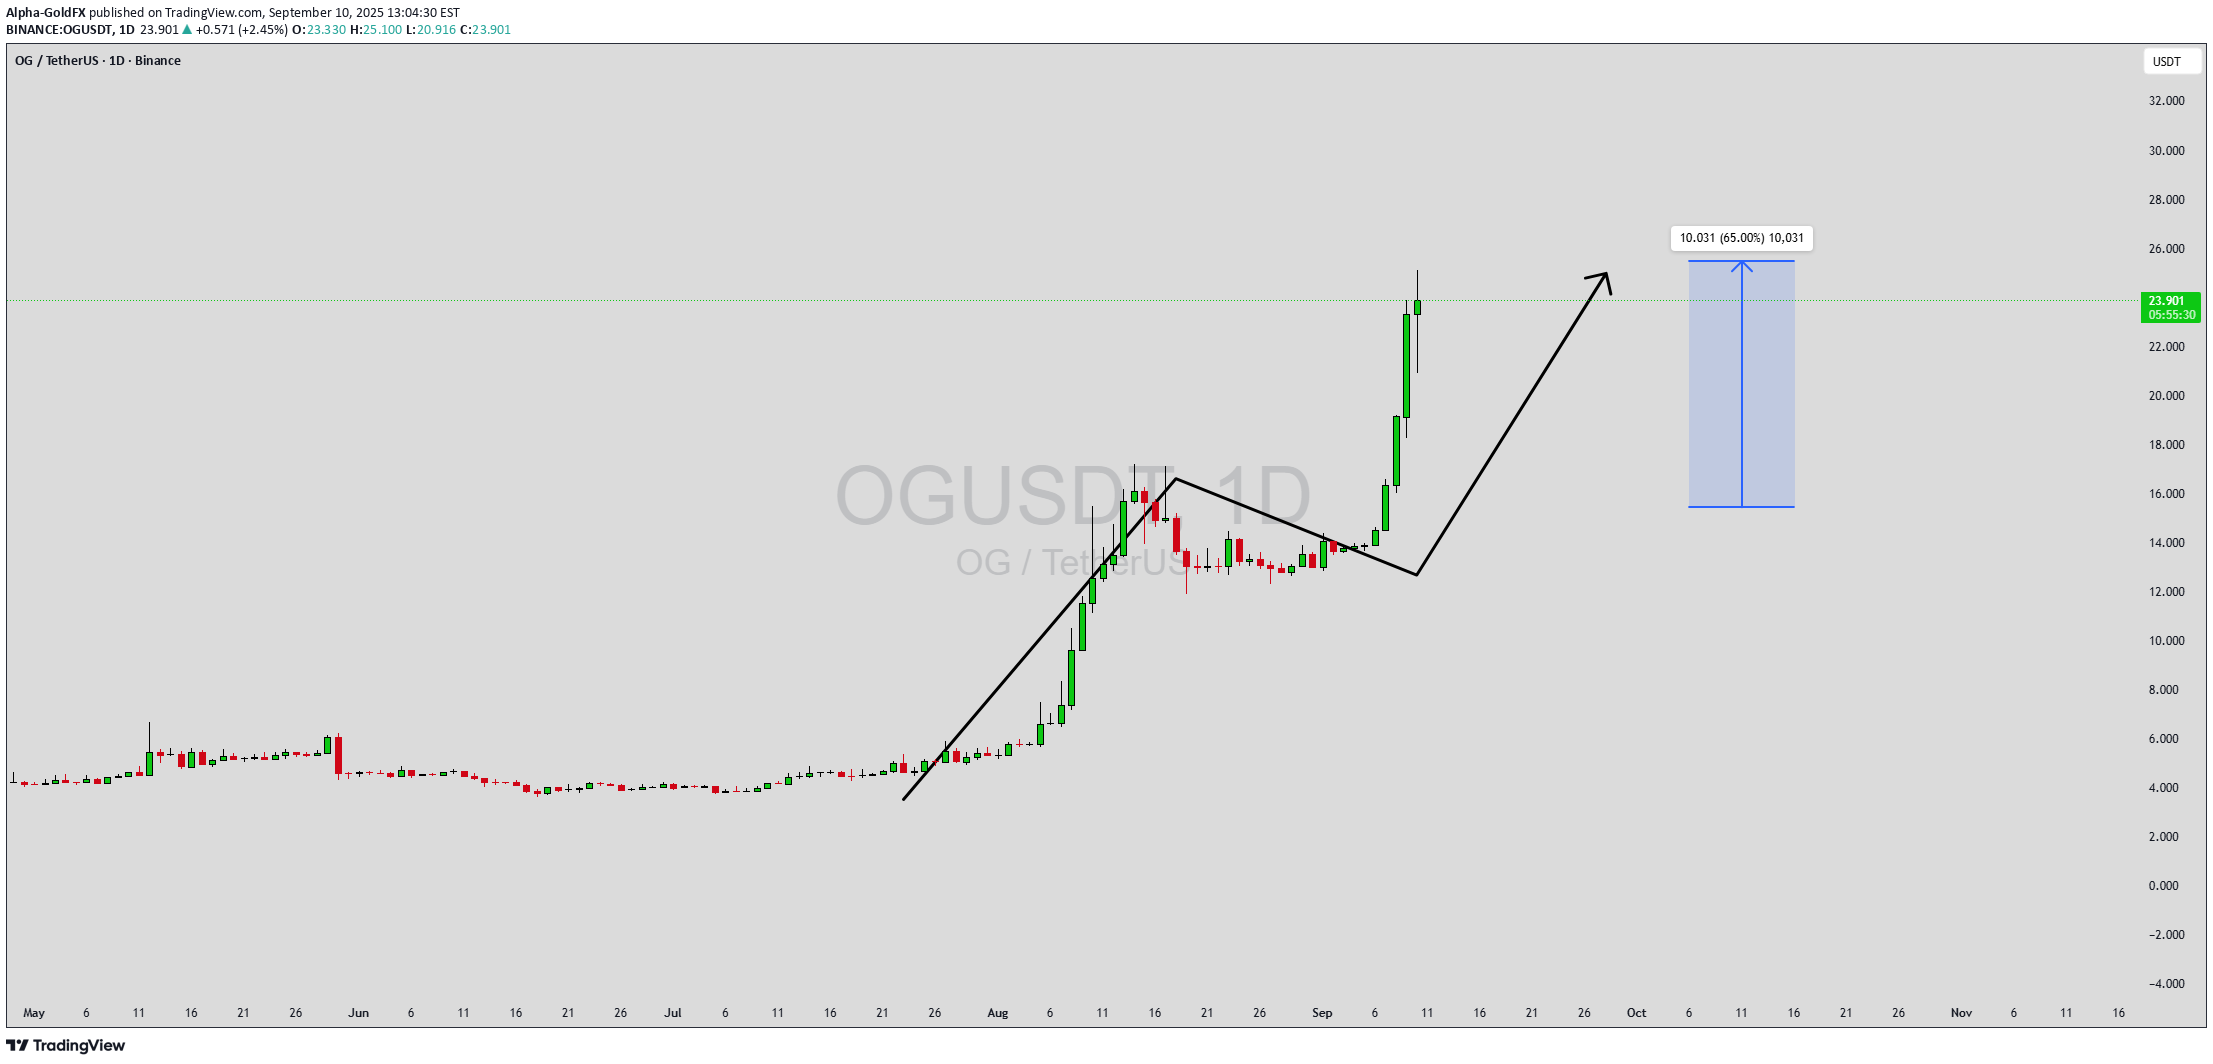
OGUSDT is currently displaying a strong bullish continuation setup, as seen in the recent price breakout and consolidation phase. After a massive rally, the pair entered a brief period of correction, which acted as a healthy retest before momentum returned to the upside. With strong buyer interest and a clear uptrend, the structure is pointing toward further gains, aligning with the 40% to 50%+ profit expectation. Volume analysis supports this move, as trading activity has remained consistently strong throughout the rally. Sustained volume during bullish retracements is often a sign of smart accumulation, indicating that investors are positioning themselves for the next leg higher. The momentum breakout has confirmed renewed strength, signaling that OGUSDT is ready to push toward new resistance levels. Investor confidence in OGUSDT continues to grow as the project gains attention in the market. The current setup provides traders with a favorable risk-to-reward ratio, especially given the clear breakout structure and potential upside targets. If momentum continues, we may see OGUSDT extend its bullish trend in the coming sessions. ✅ Show your support by hitting the like button and ✅ Leaving a comment below! (What is You opinion about this Coin) Your feedback and engagement keep me inspired to share more insightful market analysis with you!
Disclaimer
Any content and materials included in Sahmeto's website and official communication channels are a compilation of personal opinions and analyses and are not binding. They do not constitute any recommendation for buying, selling, entering or exiting the stock market and cryptocurrency market. Also, all news and analyses included in the website and channels are merely republished information from official and unofficial domestic and foreign sources, and it is obvious that users of the said content are responsible for following up and ensuring the authenticity and accuracy of the materials. Therefore, while disclaiming responsibility, it is declared that the responsibility for any decision-making, action, and potential profit and loss in the capital market and cryptocurrency market lies with the trader.