
NOT
Notcoin
| تریدر | نوع سیگنال | حد سود/ضرر | زمان انتشار | مشاهده پیام |
|---|---|---|---|---|
No results found. | ||||
معرفی پروژه نات کوین
Price Chart of Notcoin
سود 3 Months :
خلاصه سیگنالهای Notcoin
سیگنالهای Notcoin
Filter
Sort messages by
Trader Type
Time Frame

سقوط ۶۴٪ ناتکوین: آیا وقت تسلیم است یا فرصت بازگشت بزرگ؟
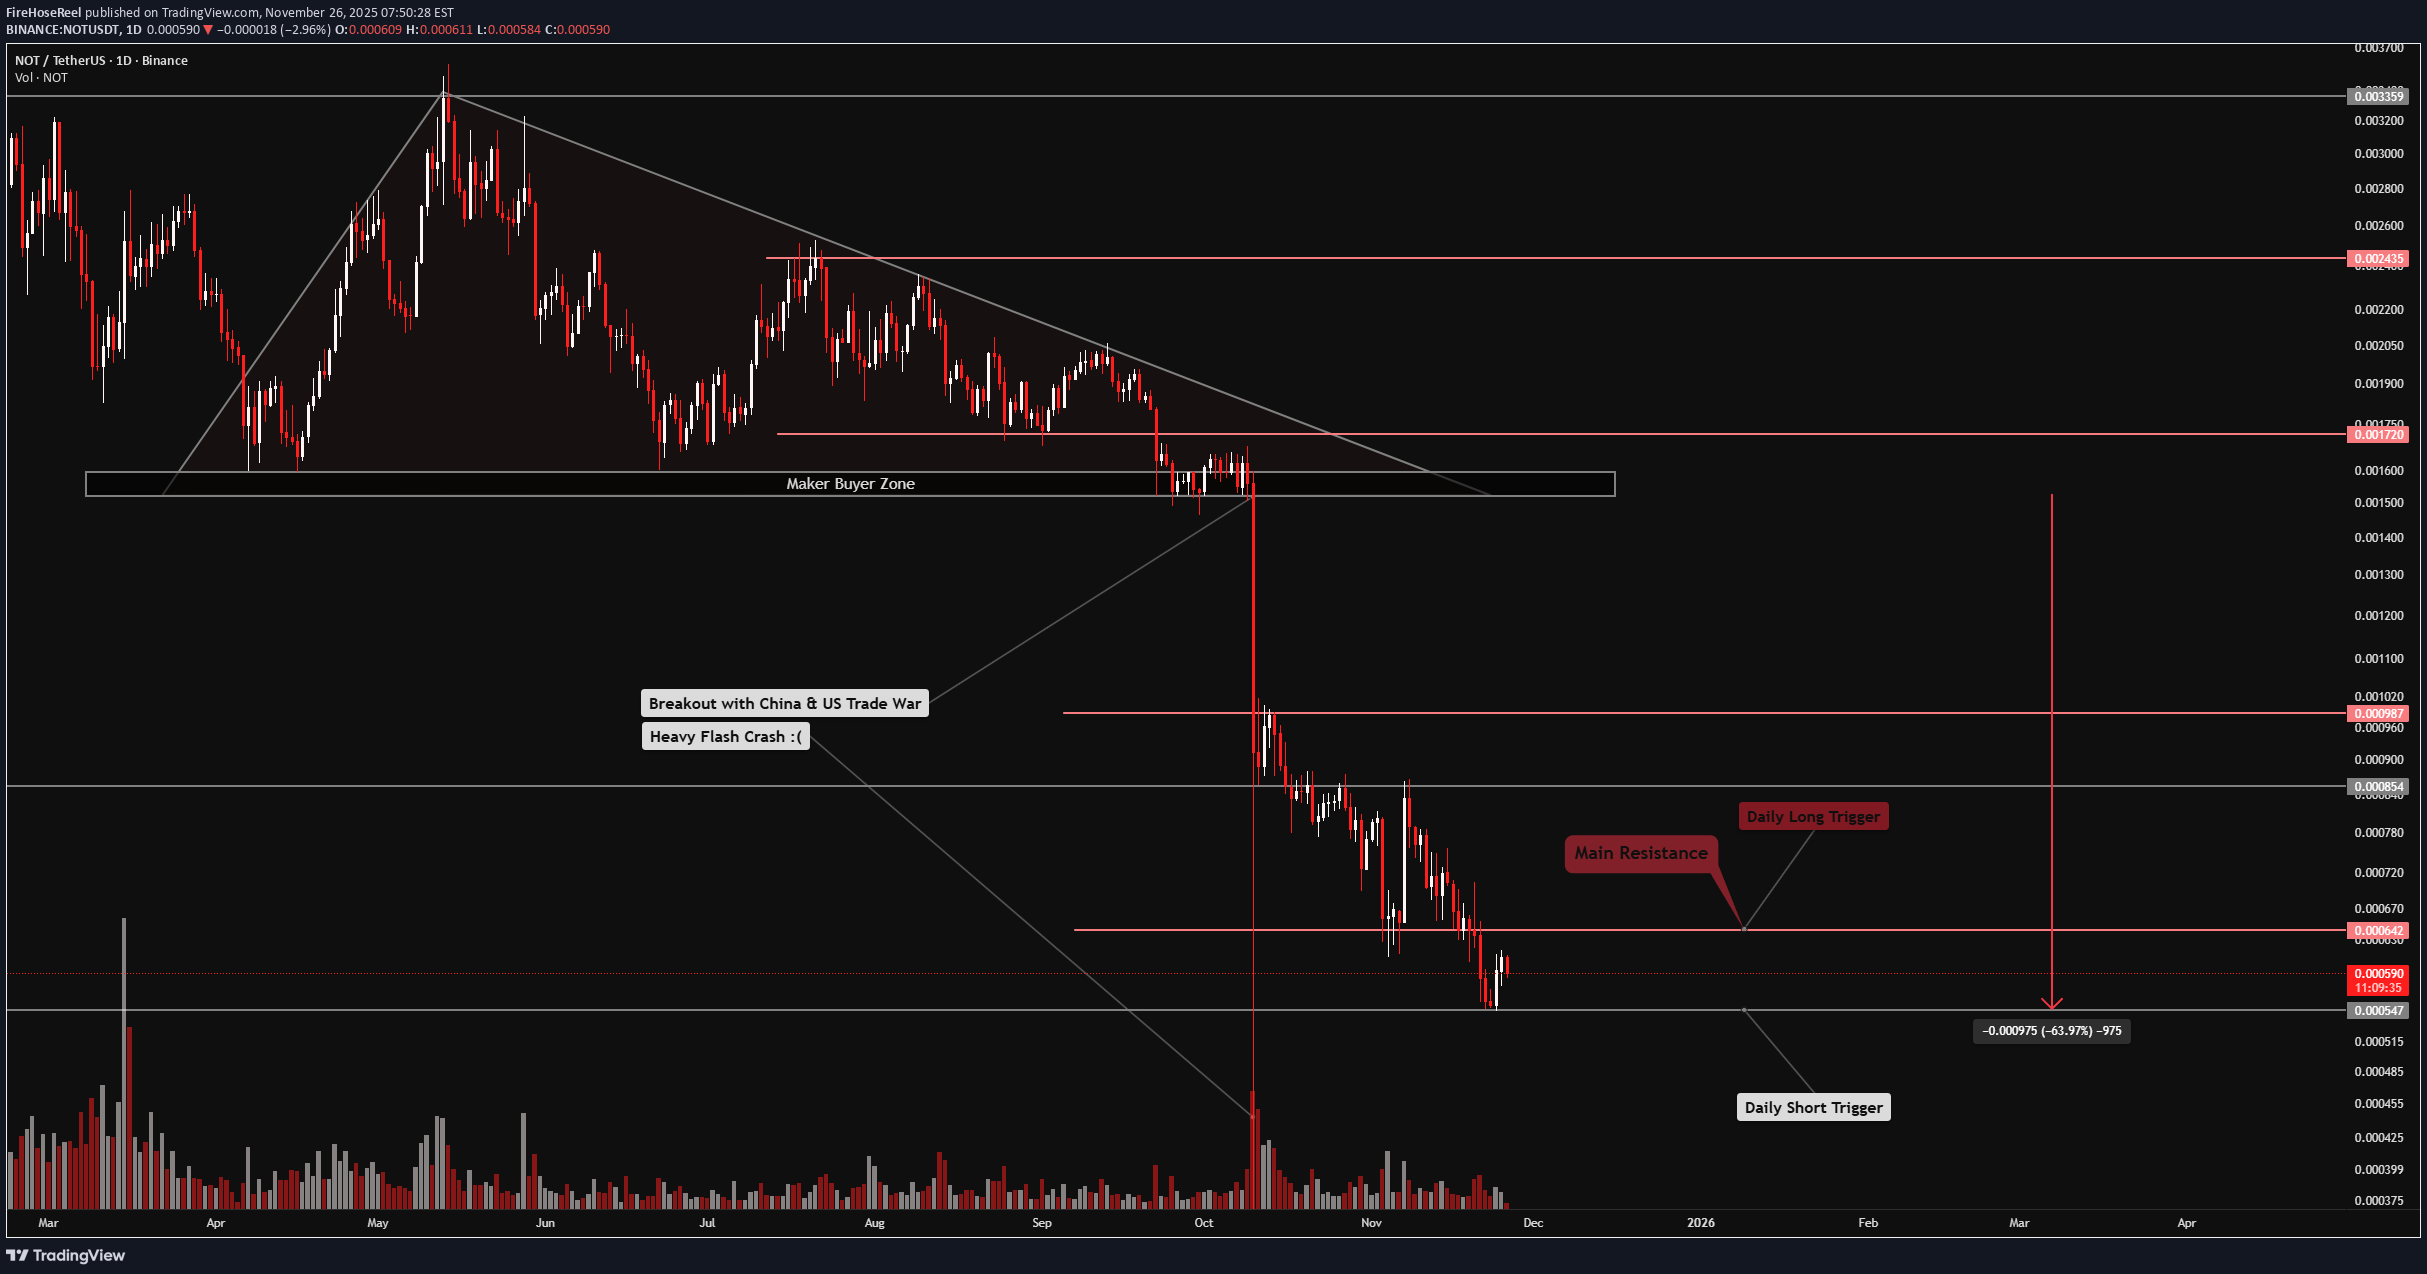
🔥 Welcome to FireHoseReel ! Let’s explore the latest Notcoin price structure. 🪐 NOTCOIN – Market Structure & Key Levels Update Notcoin has suffered a 64% crash following the flash crash triggered by the US–China trade war, marking one of the most severe declines in its history. Since its launch via a Telegram airdrop, Notcoin has consistently shown fragile price behavior, with repeated sharp corrections. Persistent selling pressure has made each pullback deeper, and the recent price action has even added an extra zero — clearly reflecting the gravity of this drawdown. ✨ Market Structure & Liquidity Outlook At this stage, Notcoin’s structure has become extremely sensitive. Any additional downside could easily trigger a new corrective wave. On the bullish side, if capital rotation returns to the TON ecosystem, Notcoin may experience a liquidity-driven upside squeeze. However, this scenario is heavily dependent on TON network performance and Telegram execution. • Key Price Levels • Daily resistance: 642 • Major support: 547 A daily close above 642 could activate a high-risk long trigger, best approached through futures trading for better flexibility. On the other hand, a break below 547 may unleash aggressive selling pressure across Notcoin. 📊 Volume Analysis – The Decisive Factor Volume remains the most critical metric at this stage. After the flash crash, overall volume declined, but during multi-timeframe corrections, selling pressure clearly resurfaced, as confirmed by recent volume candles. So far, strong buy-side volume has been rare, while sell pressure has stayed persistent and dominant. ✅ Trading Scenarios : 🔼 Long Scenario • Confirmed break above 642 • Accompanied by a strong surge in volume • This could trigger an upside expansion and support holding airdropped NOT or opening futures long positions. 🔽 Short Scenario • Breakdown below 547 • Followed by a clear increase in sell pressure • This would signal distribution risk, possibly forcing whale exits. Losing this support could justify reducing exposure and re-entering at lower levels to control risk. 🛞 Risk Management & Disclaimer Please remember to always use proper risk management and position sizing. Nothing in this analysis is financial advice. The market can change quickly, so always trade based on your own strategy, research, and risk tolerance. You are fully responsible for your own trades.

Bithereum_io
رمز ارز NOT: آیا زمان انفجار قیمت فرارسیده است؟ (تحلیل 3 روزه و اهداف بزرگ)

Has the time finally come for #NOT to move? 👀 #NOT is trading inside a descending channel on the 3-day timeframe chart. The RSI is in the oversold zone, suggesting it may be ready for an upward move. Mid-term targets: 🎯 $0.001291 🎯 $0.001608 🎯 $0.001865 Long-term targets (after a breakout above the channel resistance): 🎯 $0.002140 🎯 $0.002478 🎯 $0.002983 🎯 $0.003665 🎯 $0.004346 🎯 $0.005316 🎯 $0.006551 ⚠️ Always remember to use a tight stop-loss and maintain proper risk management.

Forex_aa
پامپ بزرگ NOT/USDT در راه است: بهترین زمان خرید ناتکوین چه موقع است؟

NOT/USDT PUMP IN COMING! Buy The dip NOTCOIN Notcoin is now good for long-term investment with the goal specified in the image, be careful not to miss it.

Cryptojobs
بیتکوین (NOT) با جهش ۱۰٪، تارگت ۴ را زد! استراتژی اسکالپ پرقدرت من 🏆


ssmog369
هشدار صعودی NOT/USDT: انحراف مثبت در RSI و MACD، منتظر جهش بزرگ!


CryptoNuclear
NOT/USDT: مثلث نزولی در آستانه انفجار؟ مسیر صعودی یا سقوط نهایی!

The 2D chart of NOT/USDT reveals a descending triangle formation — a classic compression pattern signaling that the market is reaching a major decision point. For months, price action has been trapped under a falling trendline (yellow), forming a series of lower highs, while buyers continue to defend the 0.0013–0.0010 support zone with persistence. This setup now represents a make-or-break moment: Will NOT finally break out of its long-term downtrend, or will it face one last capitulation before finding a true bottom? --- 🔹 Pattern Structure Pattern: Descending Triangle — a compression setup often seen near the end of a prolonged downtrend. Interpretation: Still technically bearish, but every failed breakdown strengthens the potential for a bullish reversal. Volume: Gradually declining — showing quiet accumulation and energy buildup before a potential expansion. --- 🔹 Key Technical Levels Support Zone: 0.0013 – 0.0010 (major buyer defense) Current Price: ≈ 0.001558 Resistance Targets: R1 → 0.002356 (initial breakout target) R2 → 0.003118 (trend flip zone) R3 → 0.005822 (momentum expansion) R4 → 0.009334 – 0.016344 (mid-term resistance cluster) --- 🟢 Bullish Scenario A confirmed 2D candle close above the yellow trendline with strong volume could trigger a reversal breakout, signaling the end of the prolonged compression phase. In that case, the next impulsive targets lie near 0.002356 and 0.003118. Typically, a clean breakout is followed by a retest — the best opportunity for confirmation-based entries. 📈 “Breakout + Retest = Momentum Reversal.” --- 🔴 Bearish Scenario If the 0.0013–0.0010 support breaks down with expanding sell volume, the descending triangle confirms its bearish continuation role. This could lead to a quick retest of the 0.0010 zone, potentially marking a final capitulation phase before long-term accumulation begins. 📉 “Losing the floor means retesting history.” --- ⚙️ Overall Perspective The market is entering the final stage of compression — volatility and volume are tightening, signaling that a major directional move is approaching. Whether up or down, this next move could define NOT/USDT’s mid-term trend into Q4 2025. > “The longer the silence, the bigger the explosion that follows.” --- #NOTUSDT #Notcoin #CryptoAnalysis #DescendingTriangle #BreakoutSetup #PriceCompression #TrendReversal #AltcoinAnalysis #CryptoTrading #TechnicalAnalysis #SupportResistance #MarketStructure
Bithereum_io
تحلیل تکنیکال NOT/USDT: آیا شکستن گوه نزولی قیمت نات را به اوج جدید میرساند؟

#NOT is trading within a falling wedge pattern on the daily chart. In case of a breakout above the wedge resistance and the daily SMA50, the potential targets are: 🎯 $0.001908 🎯 $0.002183 🎯 $0.002406 🎯 $0.002628 🎯 $0.002944 🎯 $0.003347 ⚠️ Always remember to use a tight stop-loss and maintain proper risk management.

ahmadarz
تحلیل NOT/USDT: منتظر شکست خط روند برای خرید؛ سطح کلیدی ۰.۰۰۱۶۵۰ دلار!

I waiting for breakout of trendline for buy. So is 0.001650 key-levels and 0.001800$ next level for breakout and buy. Please control risk management because NOTUSDT IN is meme_coin in crypto.

TheHunters_Company
سیگنال خرید ناتکوین (Notcoin): زمان ورود به بازار و اهداف پیشرو!

Hello friends Given that the price has reached the specified support and the price is supported by buyers and the specified resistance has been broken, we can buy in steps with risk and capital management and move to the specified targets. *Trade safely with us*full target

mehrdadap
NOT USDT

After a long downtrend, we see weakness in the downtrend. Looking at the patterns made by the trend, we can conclude that the Wyckoff pattern is being executed
Notcoin چیست؟
معرفی پروژه نات کوین
نات کوین در صرافیهای معتبر
قیمت نات کوین
آیا نات کوین برای سرمایهگذاری مناسب است؟
آیا استخراج نات کوین Notcoin ادامه خواهد یافت؟
Disclaimer
Any content and materials included in Sahmeto's website and official communication channels are a compilation of personal opinions and analyses and are not binding. They do not constitute any recommendation for buying, selling, entering or exiting the stock market and cryptocurrency market. Also, all news and analyses included in the website and channels are merely republished information from official and unofficial domestic and foreign sources, and it is obvious that users of the said content are responsible for following up and ensuring the authenticity and accuracy of the materials. Therefore, while disclaiming responsibility, it is declared that the responsibility for any decision-making, action, and potential profit and loss in the capital market and cryptocurrency market lies with the trader.