
ahmadarz
@t_ahmadarz

What symbols does the trader recommend buying?
Purchase History
پیام های تریدر
Filter
ahmadarz
FILUSDT
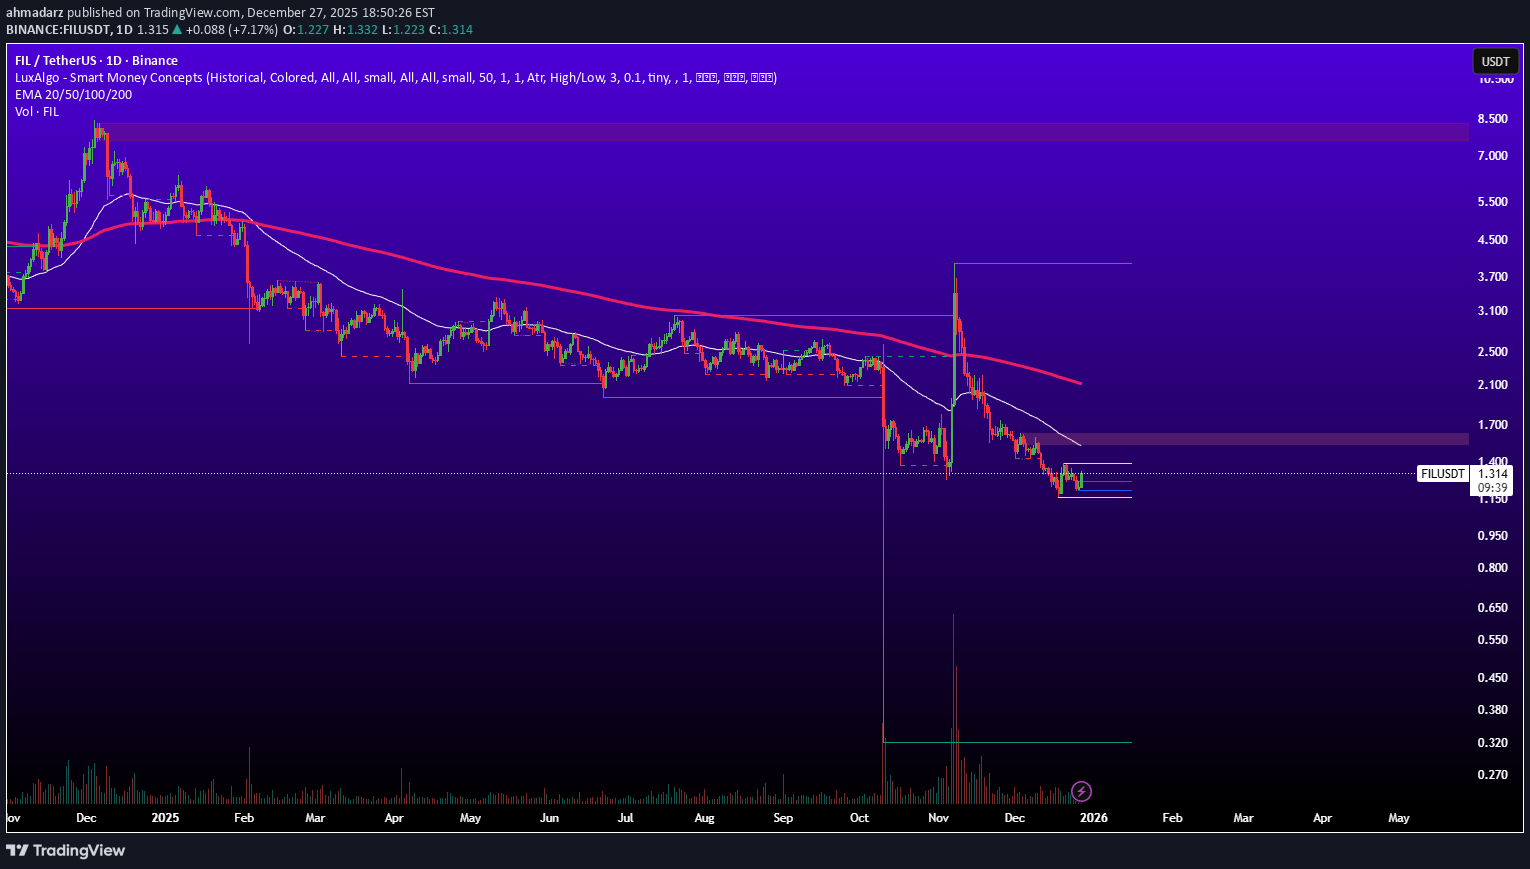
The daily chart of FILUSDT shows an overall bearish structure, but weakening selling pressure and price consolidation suggest that downside momentum is fading at current levels. Price is moving inside a lower-range trading zone, and a breakout above the range high could be the first sign of a bearish trend correction. Supports: 1.150 Resistances: 1.311 1.600 to 1.700 2.100 2.500
ahmadarz
GALAUSDT

The overall structure remains bearish as the price continues to form lower highs and lower lows below the descending trendline. However, compression near the 0.00670 dollar support suggests selling momentum is weakening and a short-term corrective bounce is possible if this level holds. GALAUSDT
ahmadarz
آینده FETUSDT در هالهای از ابهام: آیا حمایت ۰.۲۱۰۰ نجاتبخش خواهد بود؟
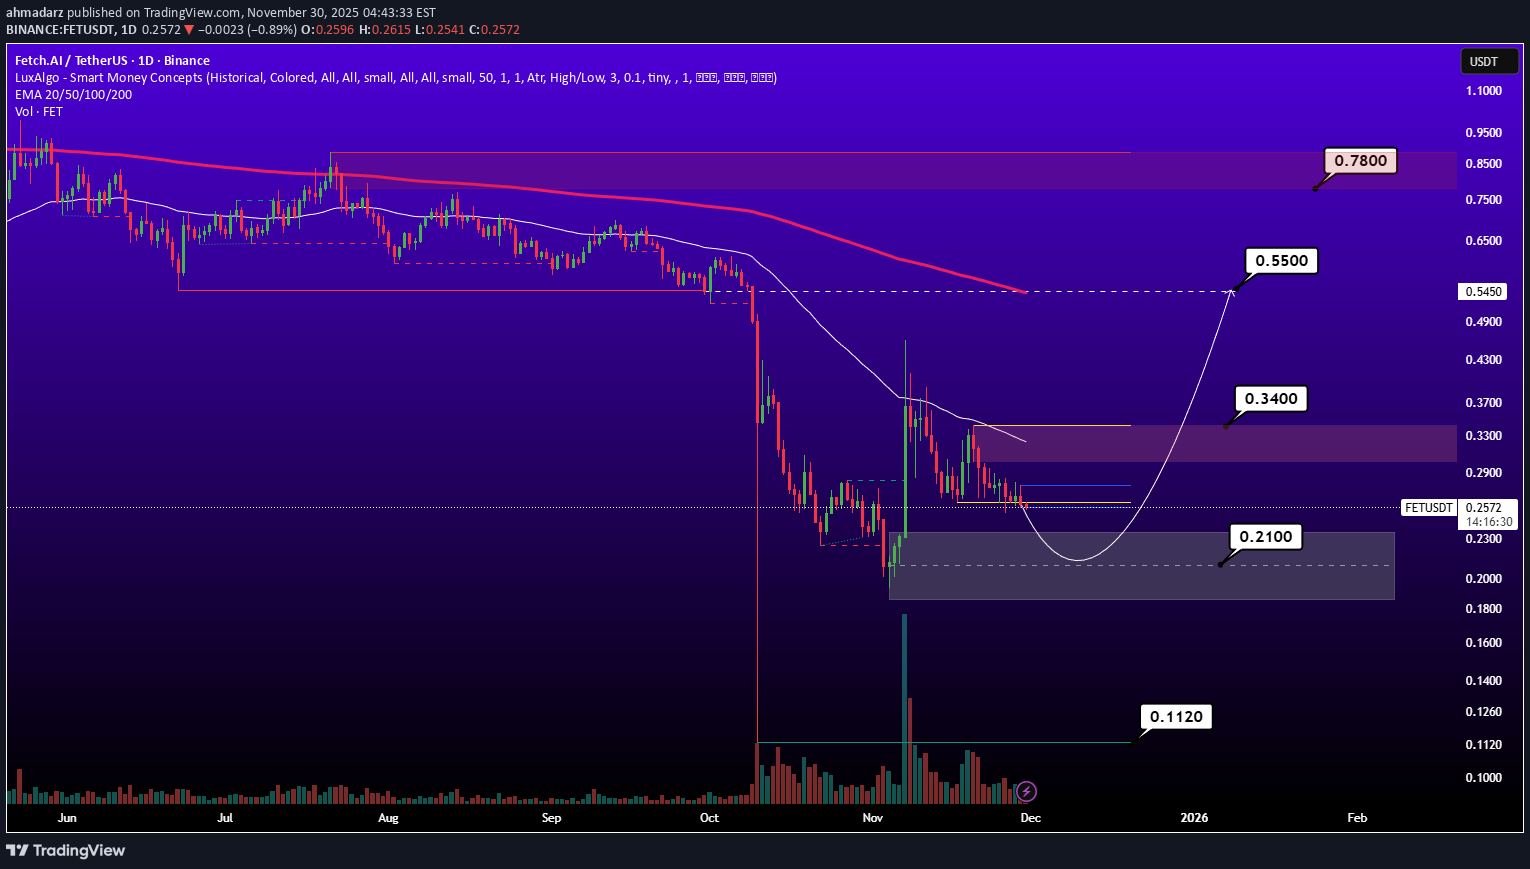
The overall trend of FETUSDT remains bearish as long as the price stays below the major moving averages. However, a potential bullish correction could start if buyers defend the key demand zone around $0.2100. A break above $0.3400 would strengthen bullish momentum and shift focus toward higher resistance targets. * Supports * $0.2100 * $0.1120 * * Resistances * $0.3400 * $0.5500 * $0.7800
ahmadarz
تحلیل LINK: آیا حمایت 14 دلاری شکسته میشود؟ پیشبینی حرکت بعدی قیمت
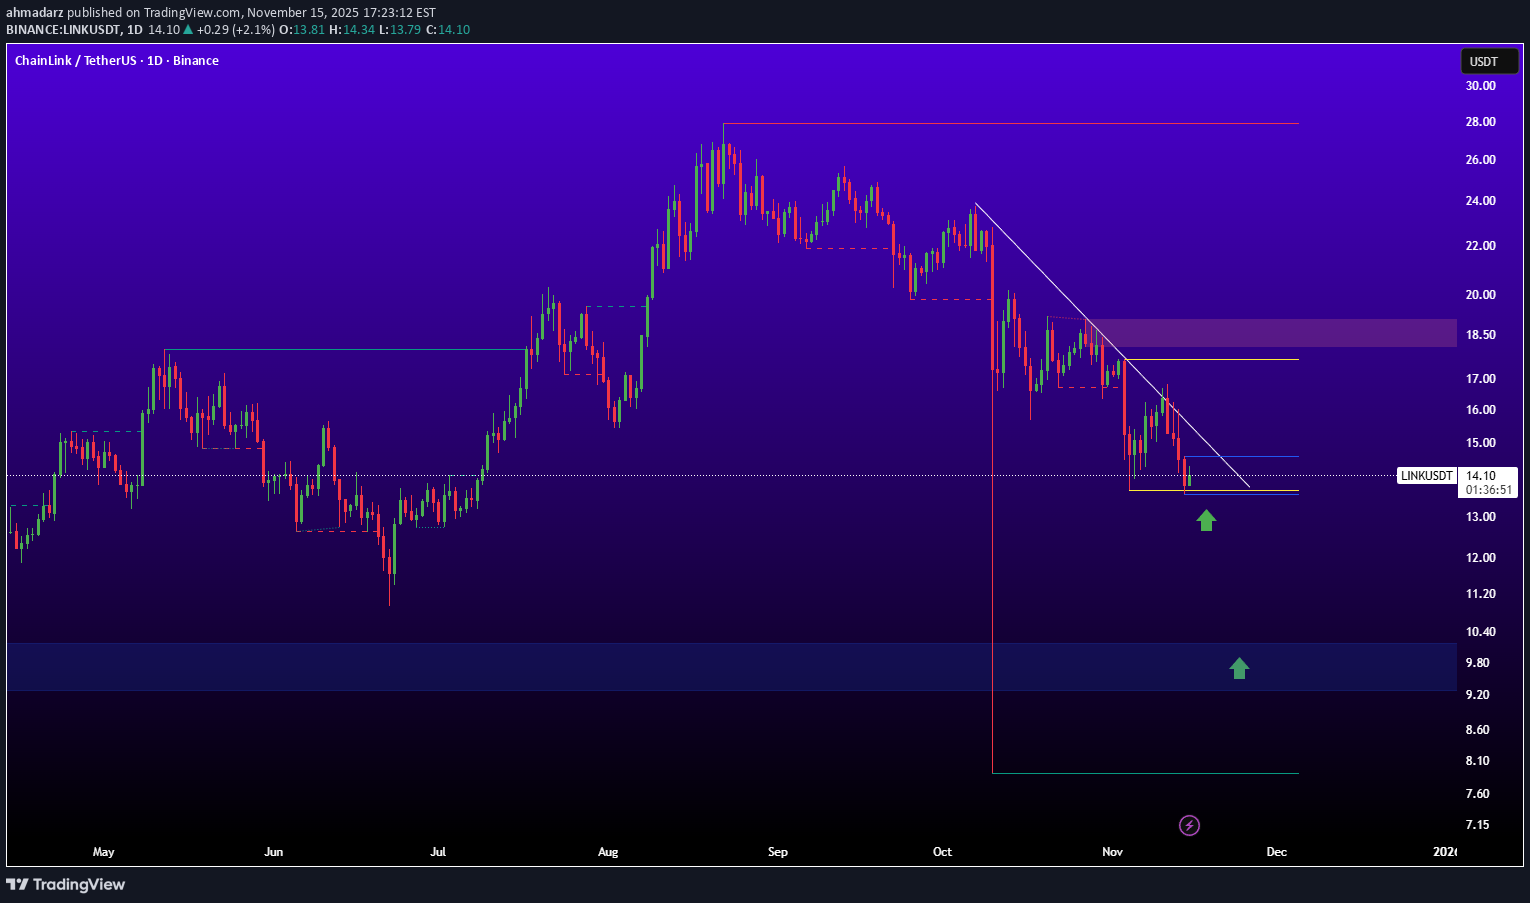
Price is still trading below the descending trendline, and the lower highs and lower lows structure suggests bearish momentum remains dominant. If the 14 دلار support breaks, the move toward 12.50 دلار becomes likely, while a breakout above the trendline may open the path to 15.30 دلار.
ahmadarz
تحلیل فوری آواکس (AVAX/USDT): ریزش کوتاهمدت یا انفجار بزرگ پس از شکست خط روند؟
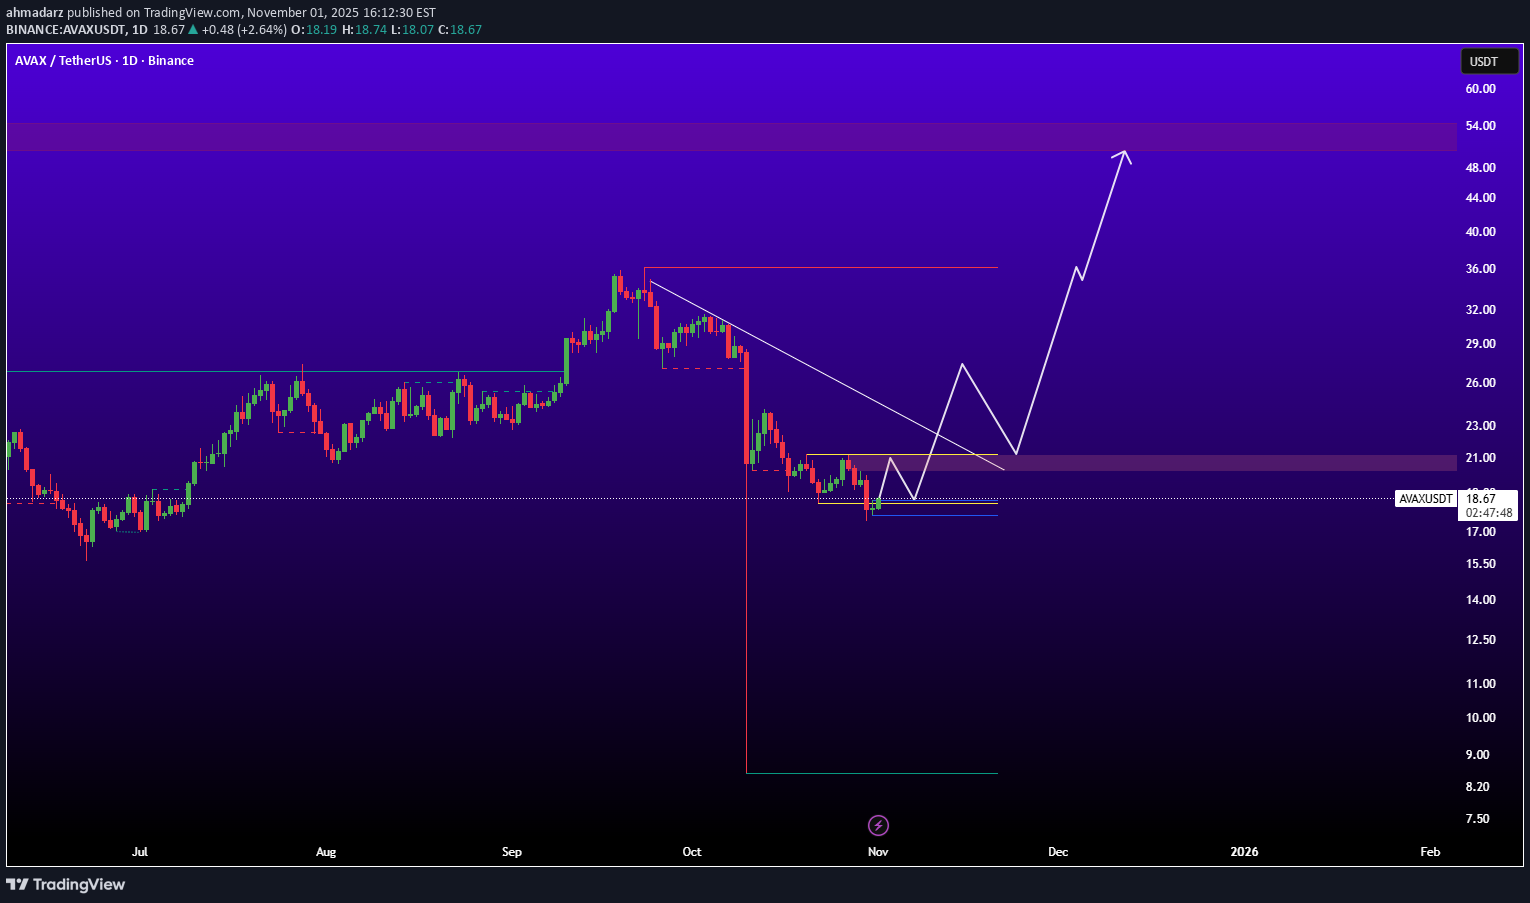
This chart is short-term bear trend or wait braakout trendline and pump $avax.
ahmadarz
تحلیل تکنیکال کاردانو (ADA): آیا ریزش به زیر ۰.۵۹ دلار قطعی است؟
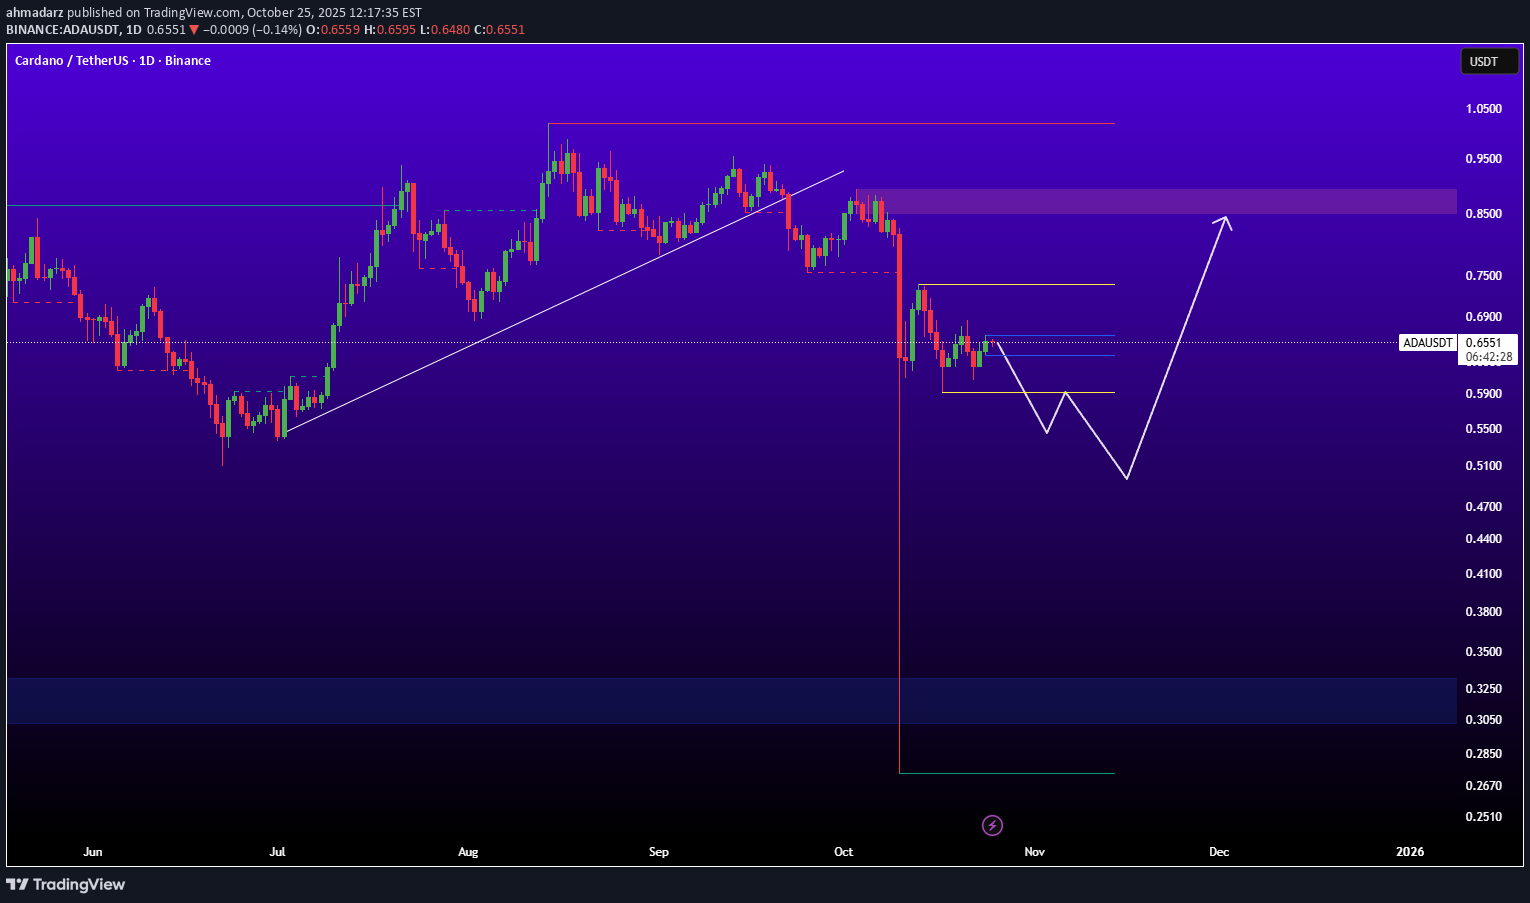
In this week’s ADAUSDT analysis, after a bearish reaction from the 0.85 USD zone, the price remains consolidating below previous highs, showing weakness in bullish momentum on the daily timeframe. If the current support fails, a move toward lower zones is likely before a potential bullish correction begins from support levels. Supports: * 0.59 USD * 0.51 USD Resistances: * 0.69 USD * 0.85 USD
ahmadarz
روند صعودی انفجاری BNB متوقف شد: نقطه ورود مجدد کجاست؟
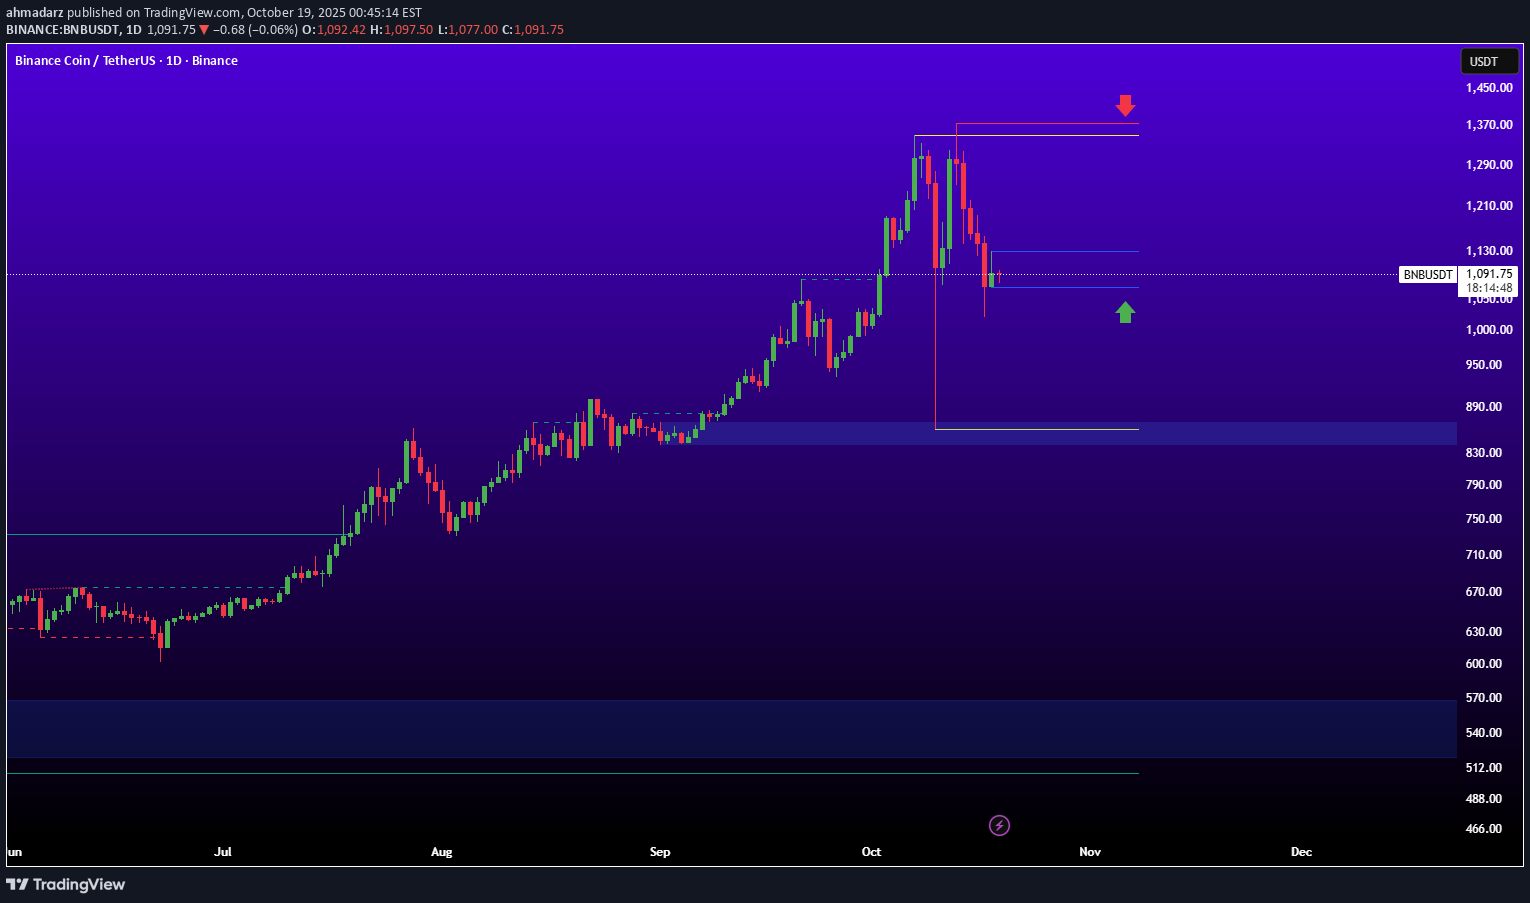
BNB has big long momentum. but stoped this level between 1000$ to 1500$. We can buy again if breakout 1100$ and should kept trend above this level.
ahmadarz
بیت کوین در آستانه سقوط آزاد؟ سناریوی ترسناک کاهش قیمت BTC به ۸۰,۰۰۰ دلار!

ahmadarz
تحلیل NOT/USDT: منتظر شکست خط روند برای خرید؛ سطح کلیدی ۰.۰۰۱۶۵۰ دلار!

I waiting for breakout of trendline for buy. So is 0.001650 key-levels and 0.001800$ next level for breakout and buy. Please control risk management because NOTUSDT IN is meme_coin in crypto.
ahmadarz
SUIUSDT

The overall trend is bearish SUIUSDT , but the 2.90 USD area seems to be a crucial level for a potential trend reversal, with a possibility of price bouncing back. The price is currently near the initial support at 2.92 USD, and it is likely to move upwards in reaction to this level. A buy signal is triggered at 2.9264 USD with a stop loss at 2.77 USD. The next price targets are 3.250 USD, 3.600 USD, 3.800 USD, and 4.28 USD. 📈 Buy Signal: Entry at 2.9264 USD 🚫 Stop Loss: 2.77 USD 🎯 Targets: 3.250 USD | 3.600 USD | 3.800 USD | 4.28 USD
Disclaimer
Any content and materials included in Sahmeto's website and official communication channels are a compilation of personal opinions and analyses and are not binding. They do not constitute any recommendation for buying, selling, entering or exiting the stock market and cryptocurrency market. Also, all news and analyses included in the website and channels are merely republished information from official and unofficial domestic and foreign sources, and it is obvious that users of the said content are responsible for following up and ensuring the authenticity and accuracy of the materials. Therefore, while disclaiming responsibility, it is declared that the responsibility for any decision-making, action, and potential profit and loss in the capital market and cryptocurrency market lies with the trader.