
MYX
MYX Finance
| تریدر | نوع سیگنال | حد سود/ضرر | زمان انتشار | مشاهده پیام |
|---|---|---|---|---|
 Sa7enRank: 28670 | فروش | حد سود: تعیین نشده حد ضرر: تعیین نشده | 12/1/2025 | |
 technicalChile37651Rank: 34849 | خرید | حد سود: تعیین نشده حد ضرر: تعیین نشده | 12 hour ago |
Price Chart of MYX Finance
سود 3 Months :
سیگنالهای MYX Finance
Filter
Sort messages by
Trader Type
Time Frame
technicalChile37651
Sa7en
سقوط آزاد MYX در راه است؟ ریزش ۶۹ درصدی محتمل پس از رد شدن از مقاومت!
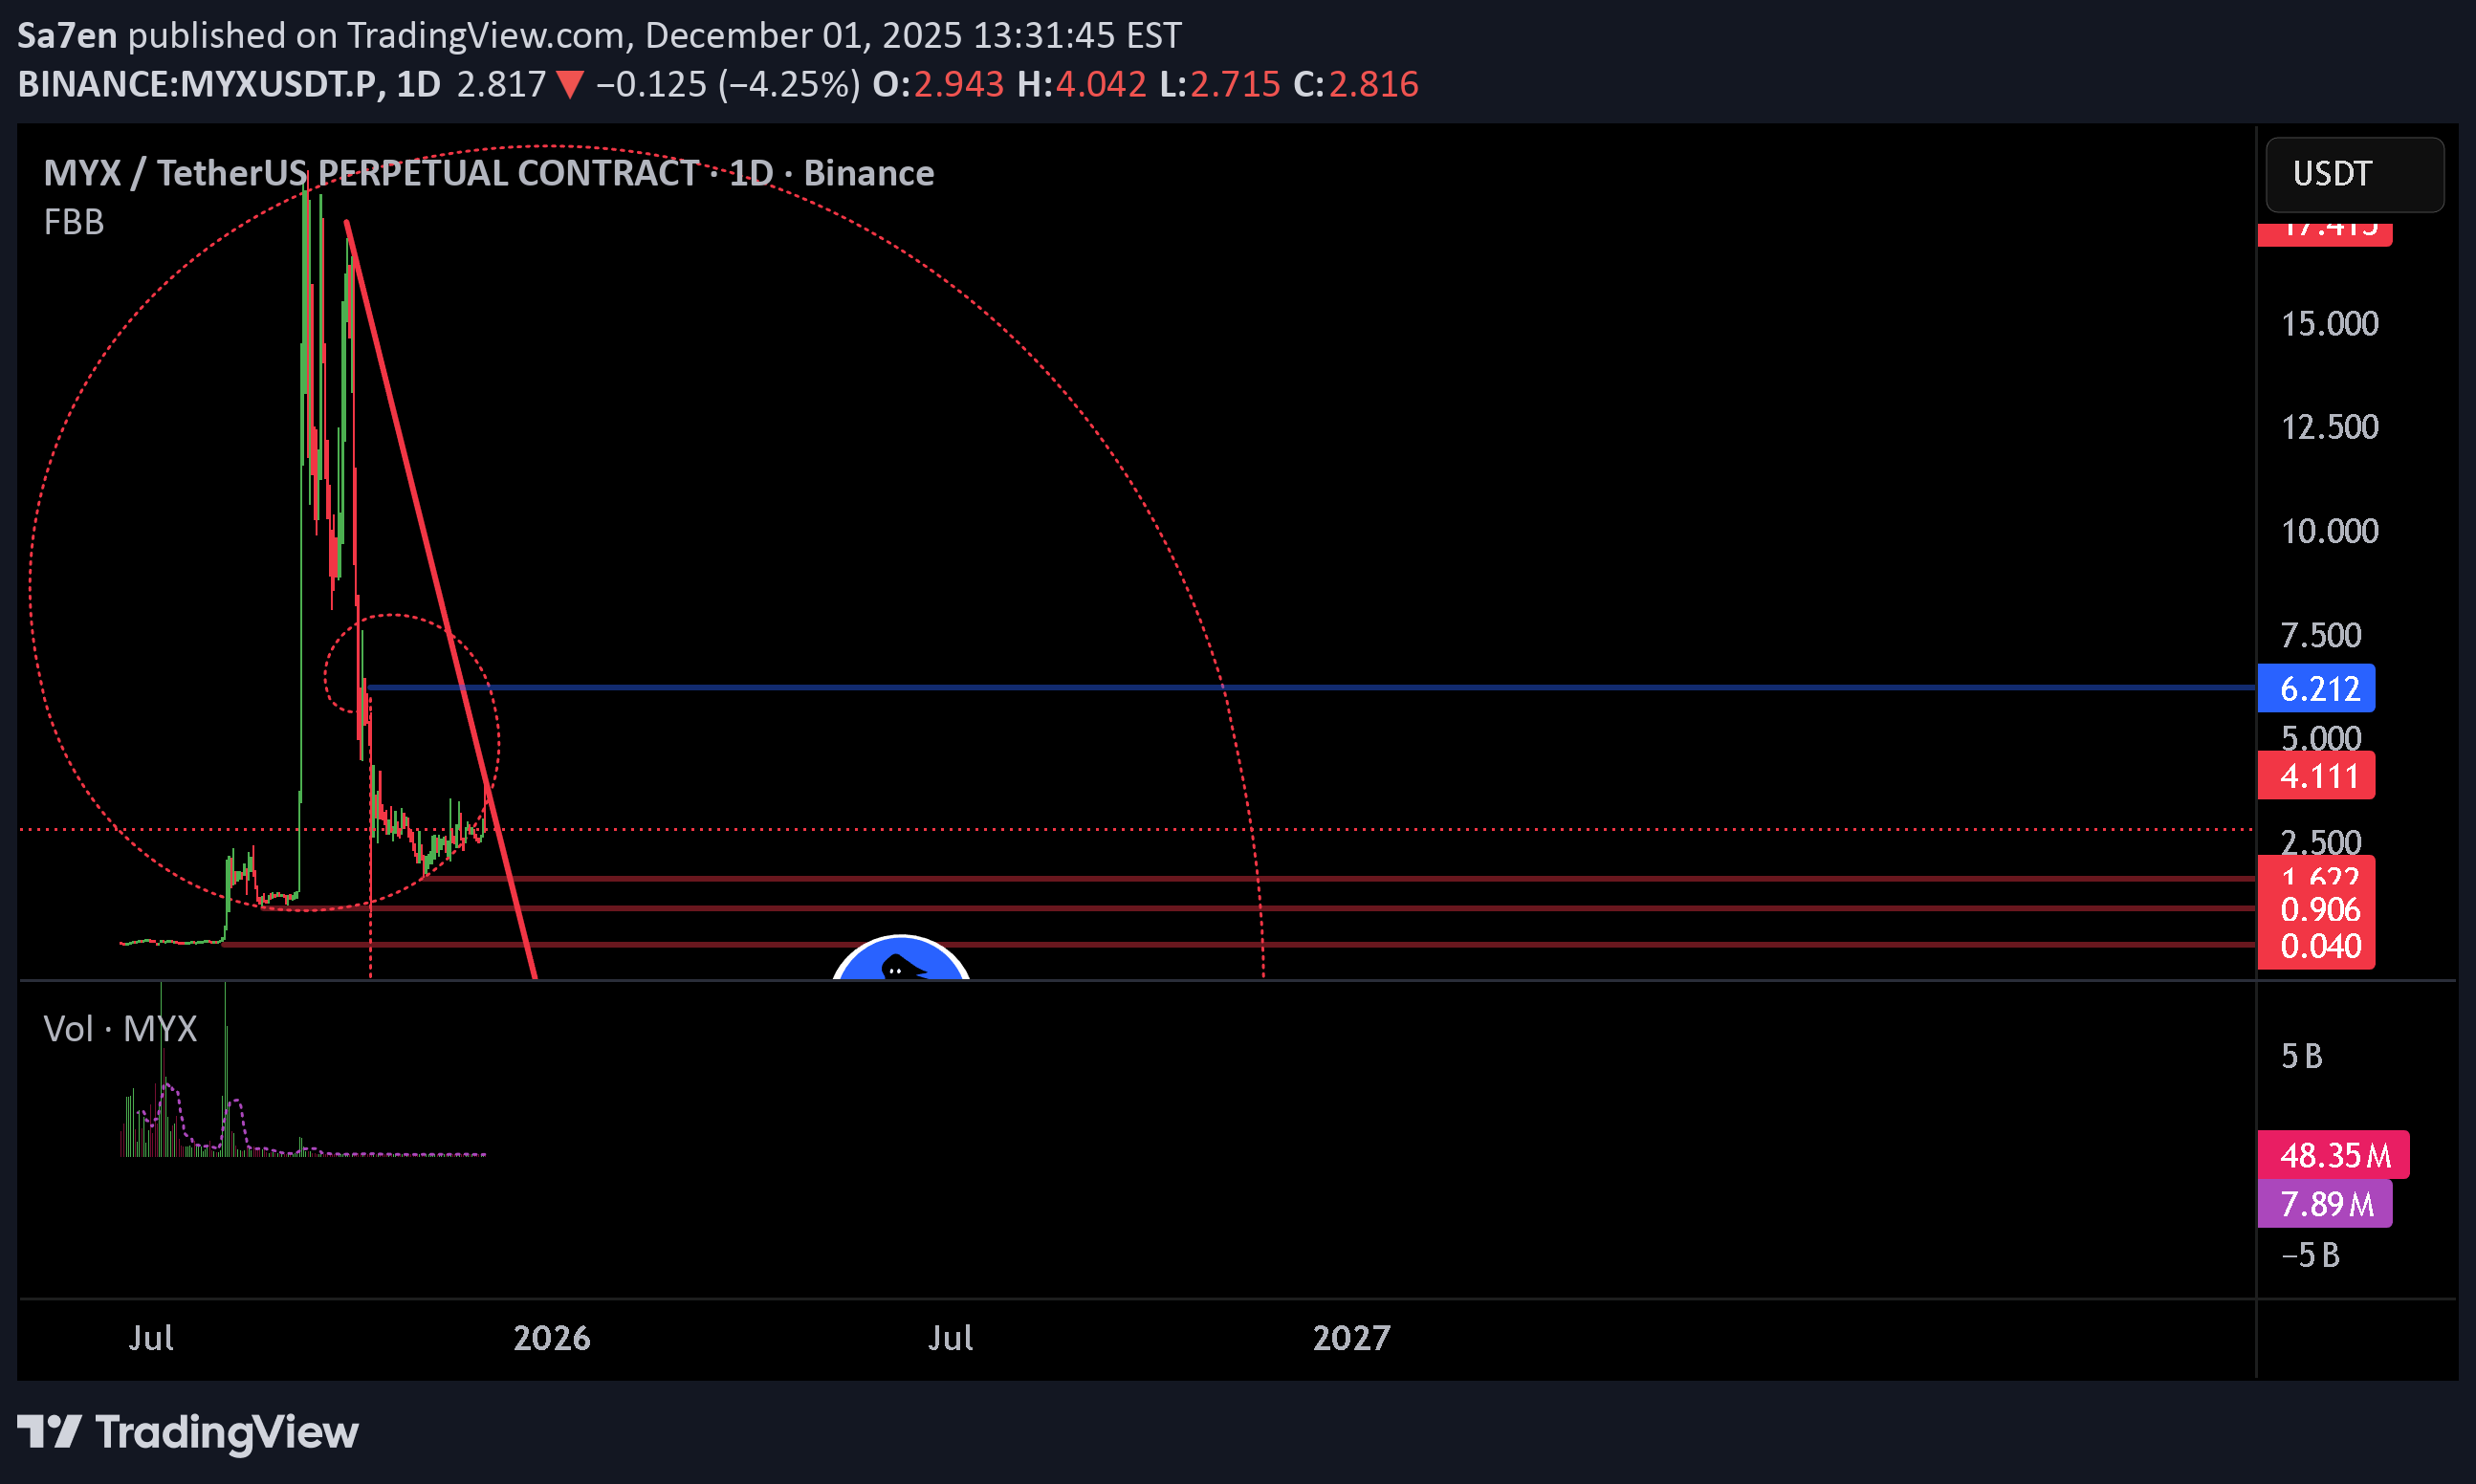
Technicals first: MYX walked up to that giant spiral on the chart, knocked politely… and immediately got rejected. Zero breakout energy. That’s usually the market’s way of saying “nice pump, now get back down there.” With momentum dead, a slide to the $0.90 support looks likely — that’s about a 67% haircut from current levels. Fundamentals? Oh boy. FDV sitting at ~$2.79B while the protocol’s TVL chills around $30M. That’s a ~90× MC/TVL ratio, which in crypto is basically a neon sign flashing: “Speculation Only Zone.” Usage isn’t growing anywhere near fast enough to justify the sticker price; it’s all vibes and no volume. Bottom line: The chart rejected, the fundamentals don’t back the hype, and if gravity kicks in, MYX returning to ~$0.90 isn’t just possible — it’s the sober scenario after the party.

behdark
تحلیل MYX: فرصت فروش در موج B اصلاحی (با هدف مشخص)
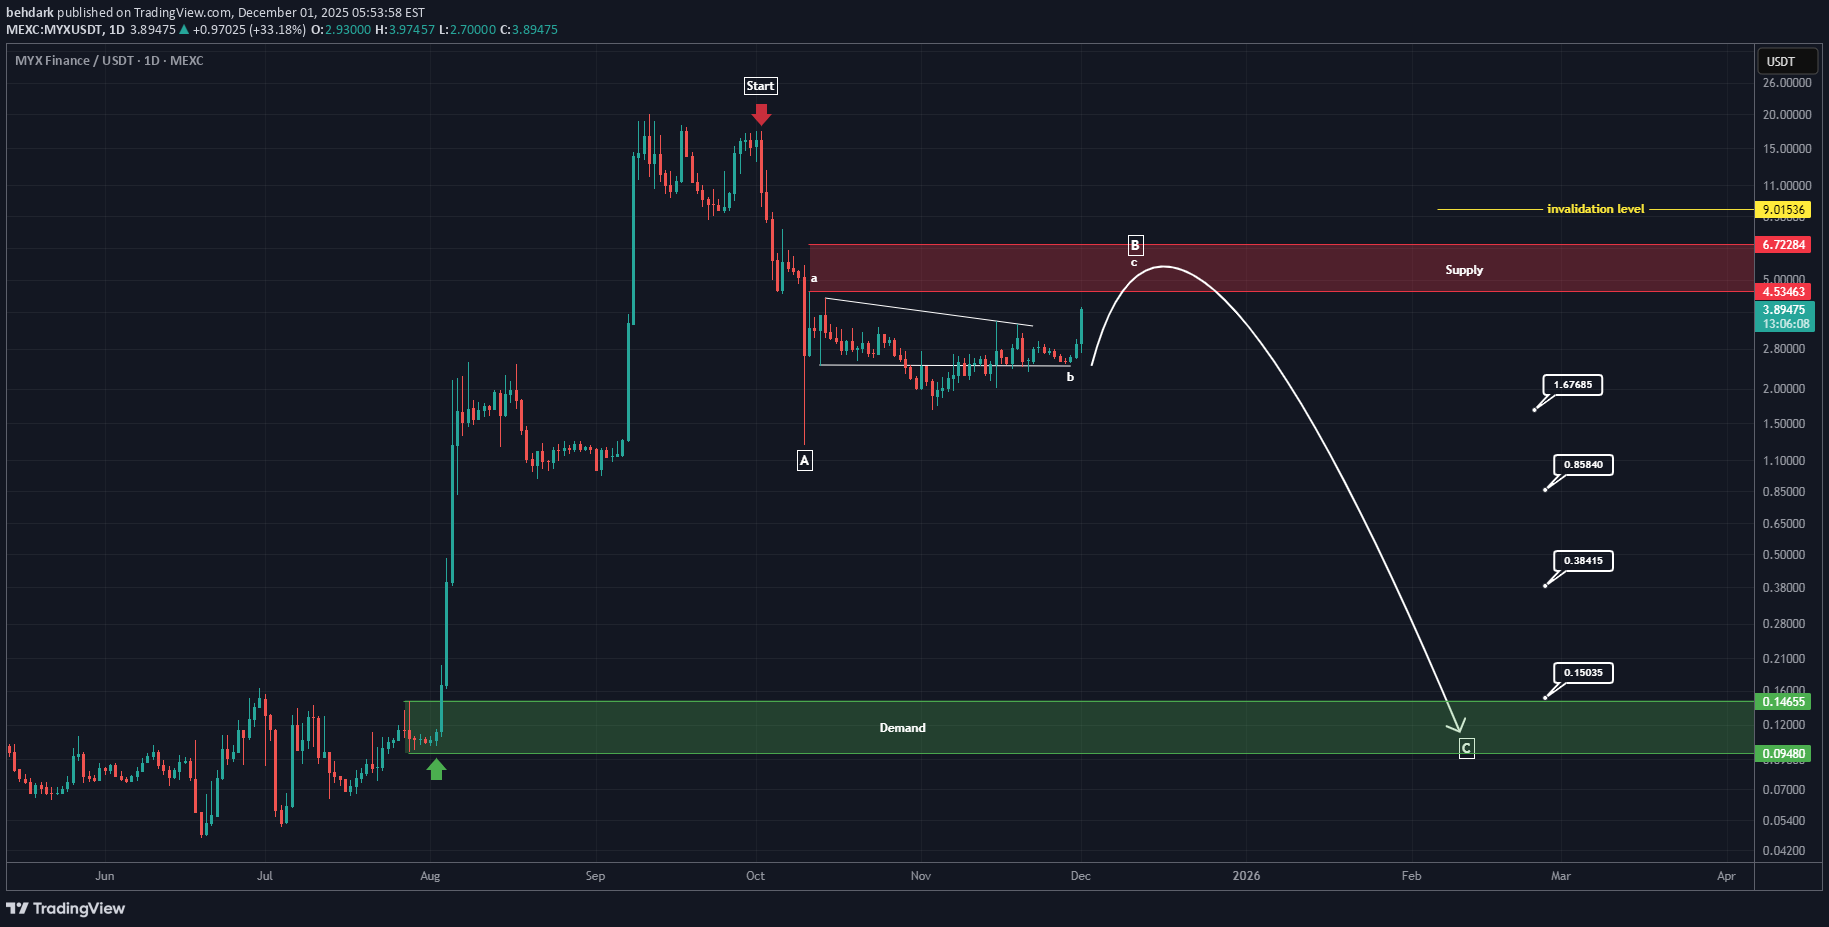
From the point where we placed the red arrow on the chart, the MYX correction has begun. The corrective phase is either an ABC pattern or a more complex structure. We are currently in Wave B of this phase. Wave B itself is an ABC, where Wave B of B formed a triangle that has now completed, and the price is currently in Wave C of B. If the price reaches the red zone, we will look for sell/short positions. The targets are marked on the chart. A daily candle closing above the invalidation level will invalidate this analysis. For risk management, please don't forget stop loss and capital management When we reach the first target, save some profit and then change the stop to entry Comment if you have any questions Thank You

WaveRiders2

chart1stry
سرمایهگذاری انفجاری MYX: پتانسیل صعود تا کجا؟ (تحلیل و سناریوها)
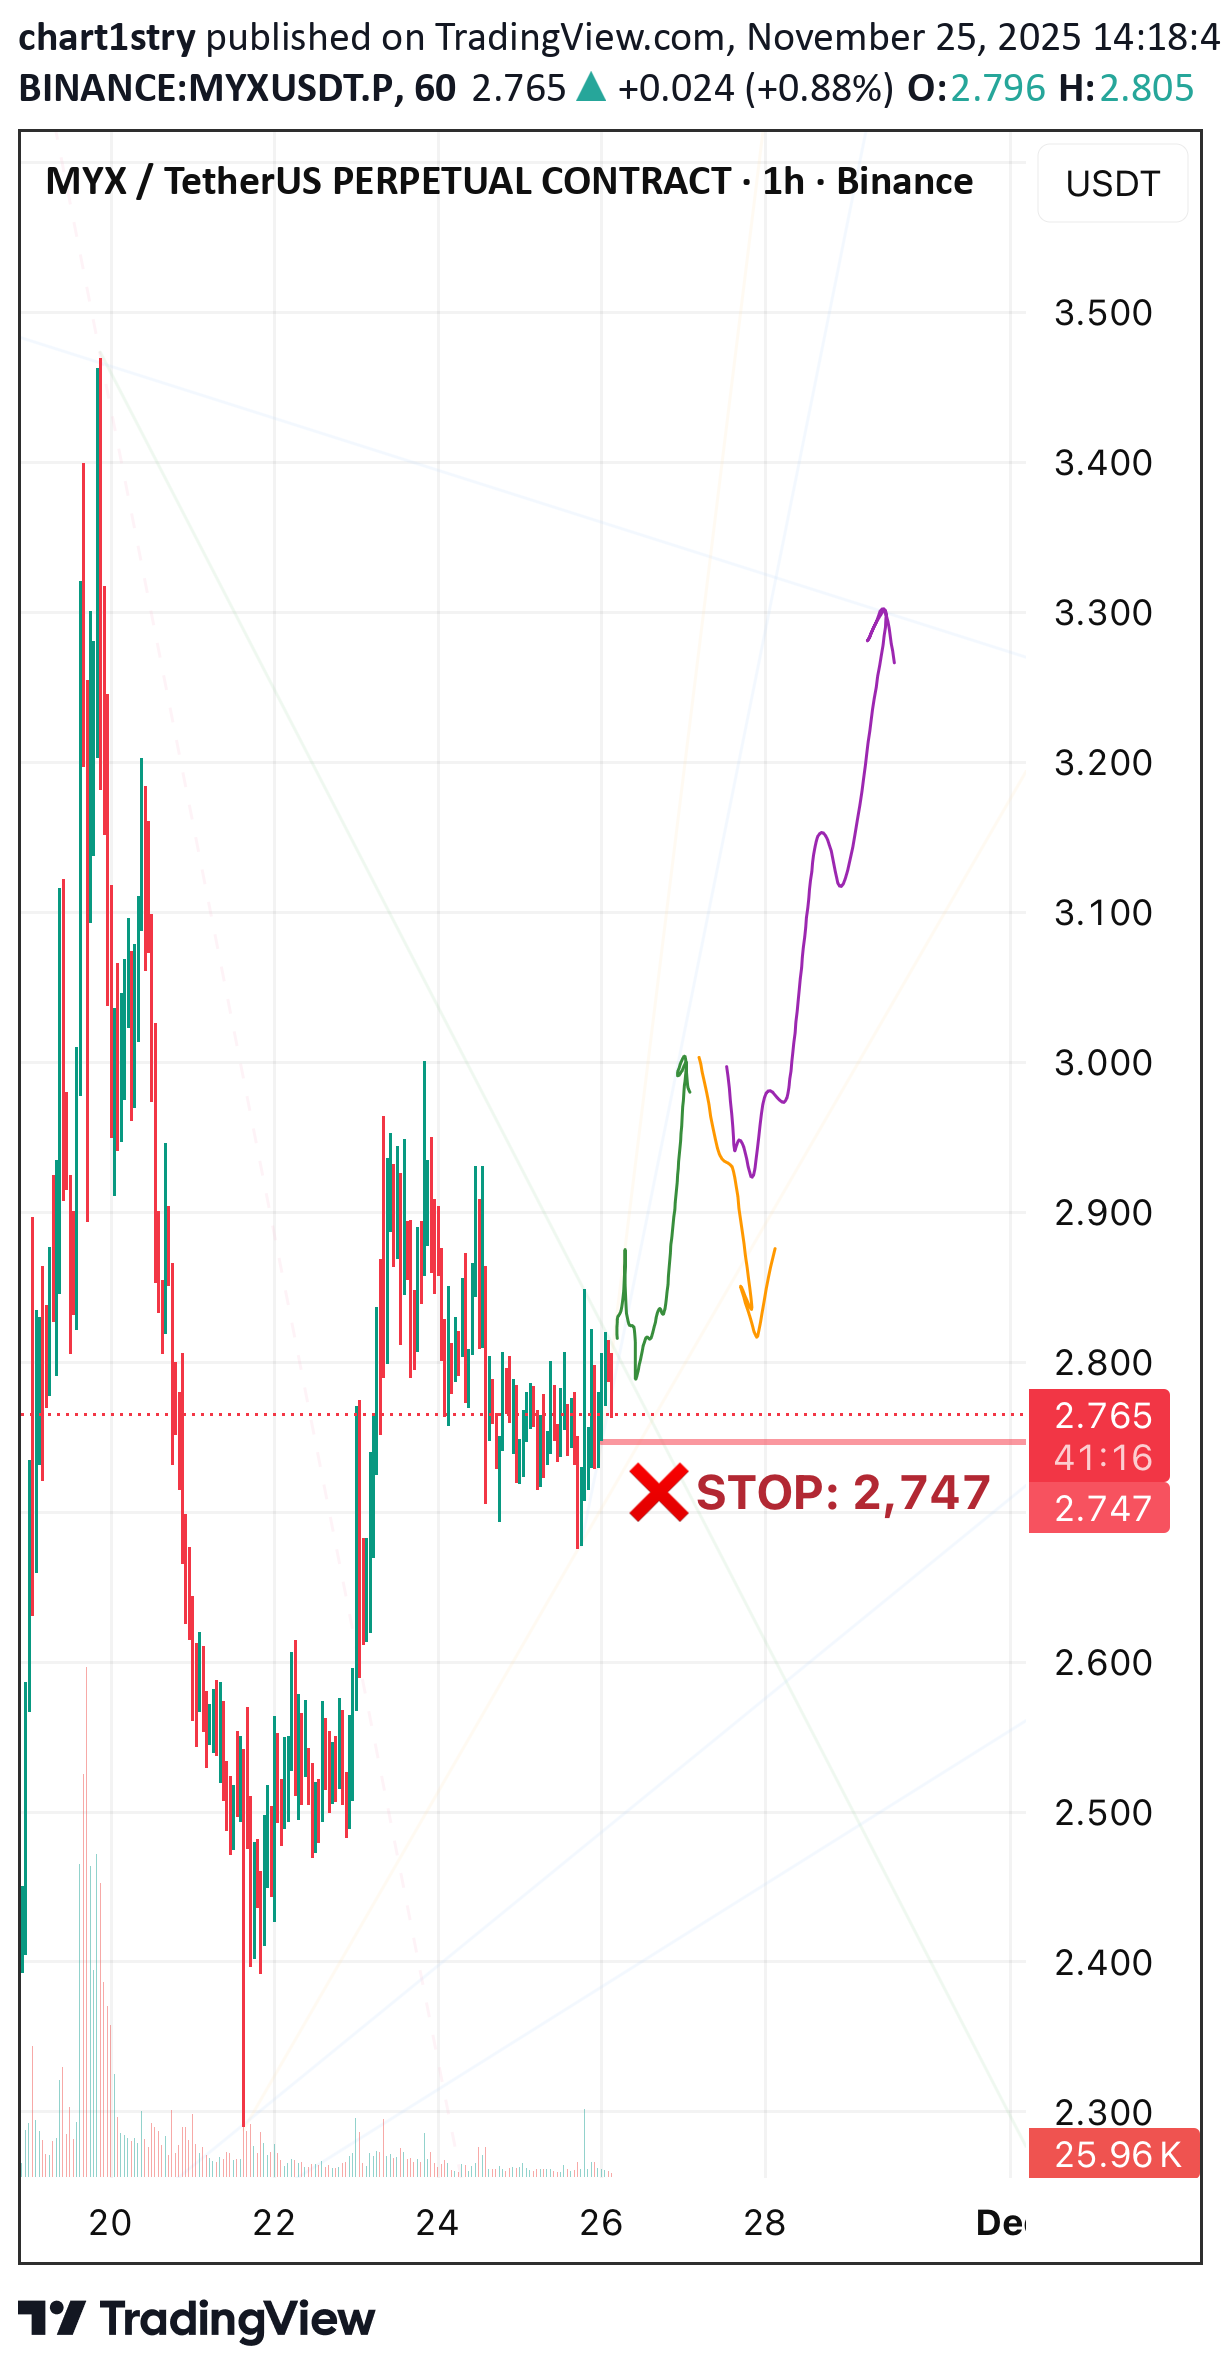
Hi friends! How’s your trading day going? I spotted an interesting setup in MYX. In my view, it’s at a low start, ready to rocket 🚀 🎯Main target: 3 📈Potential upside: 3.3 and higher 🎬Two scenarios after reaching the main target : follow the orange or purple arrows on the chart ❌Plan invalidation zone: 2.747 ⚠️As always, trade carefully — stop-losses are a must. Risk management is key! Let’s see what the chart shows! 📈

iMoneyTeam
اصلاحات شدید در انتظار MYX: سیگنال خروج یا فرصت خرید پنهان؟
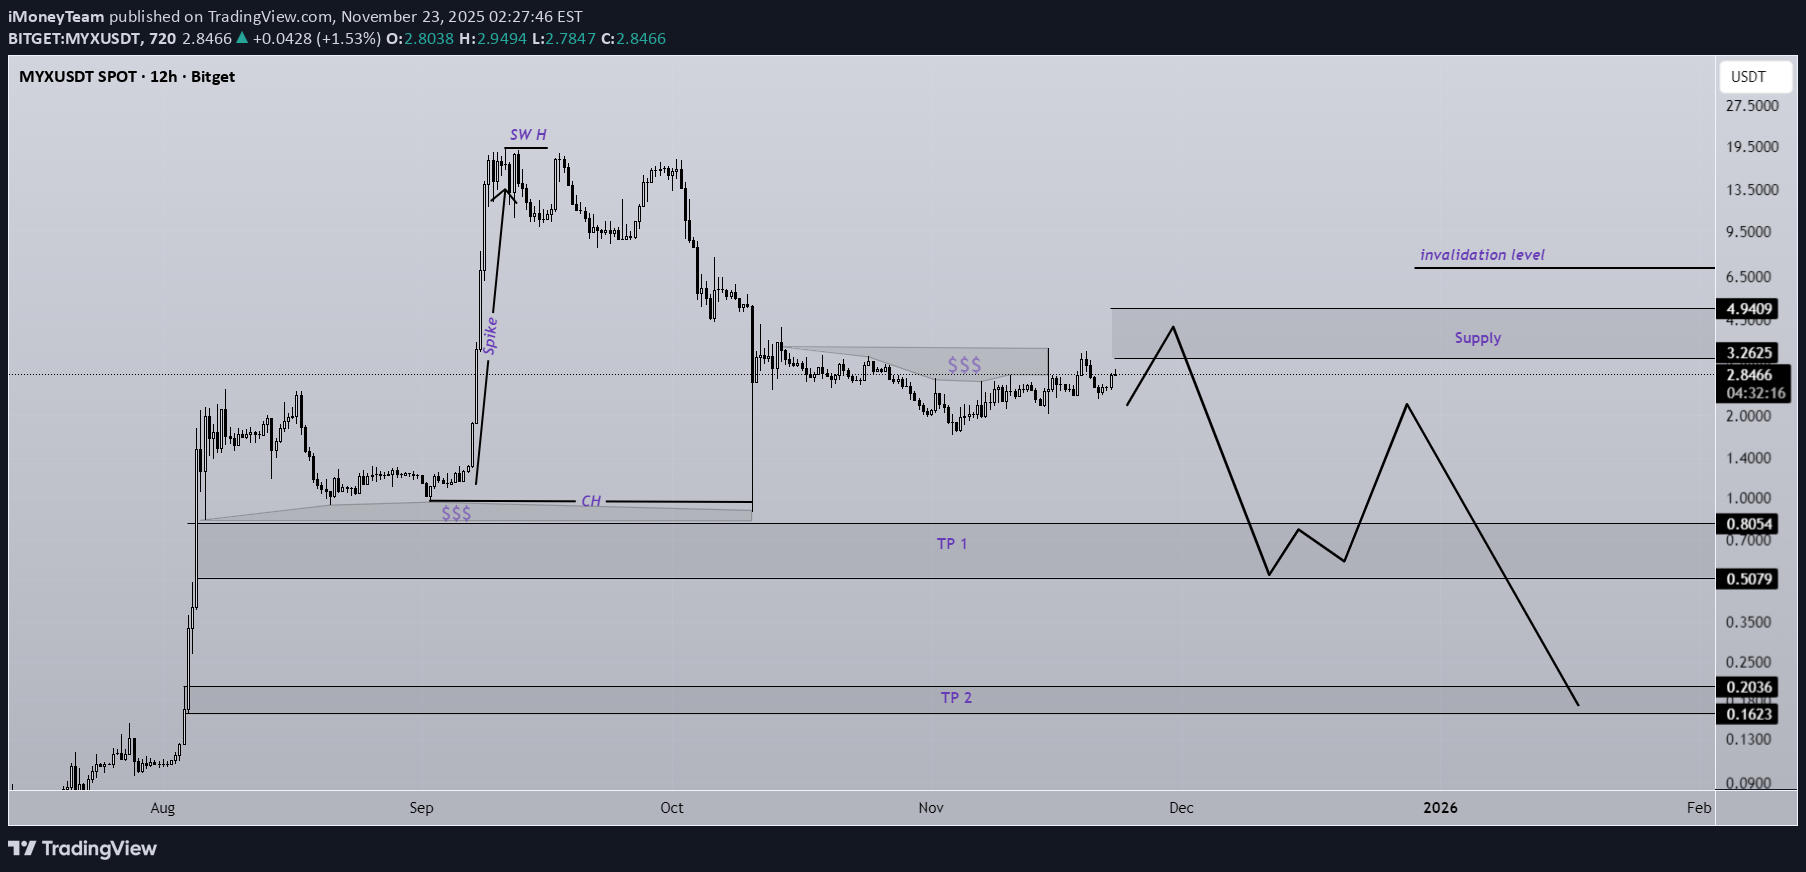
The MYX token has risen without supportive market structure and mainly through spike-driven moves. After a major bearish CH and the formation of a liquidity pool above the chart, it is now prone to further corrections. It is expected to move from the supply zone toward the target levels marked on the chart. It’s advisable not to hold this asset or maintain a bullish outlook on it. This coin is highly volatile, so use low leverage, scale into positions in multiple entries, and strictly follow your stop-loss. A daily candle closing above the invalidation level will invalidate this analysis. Do not enter the position without capital management and stop setting Comment if you have any questions thank you
technicalChile37651
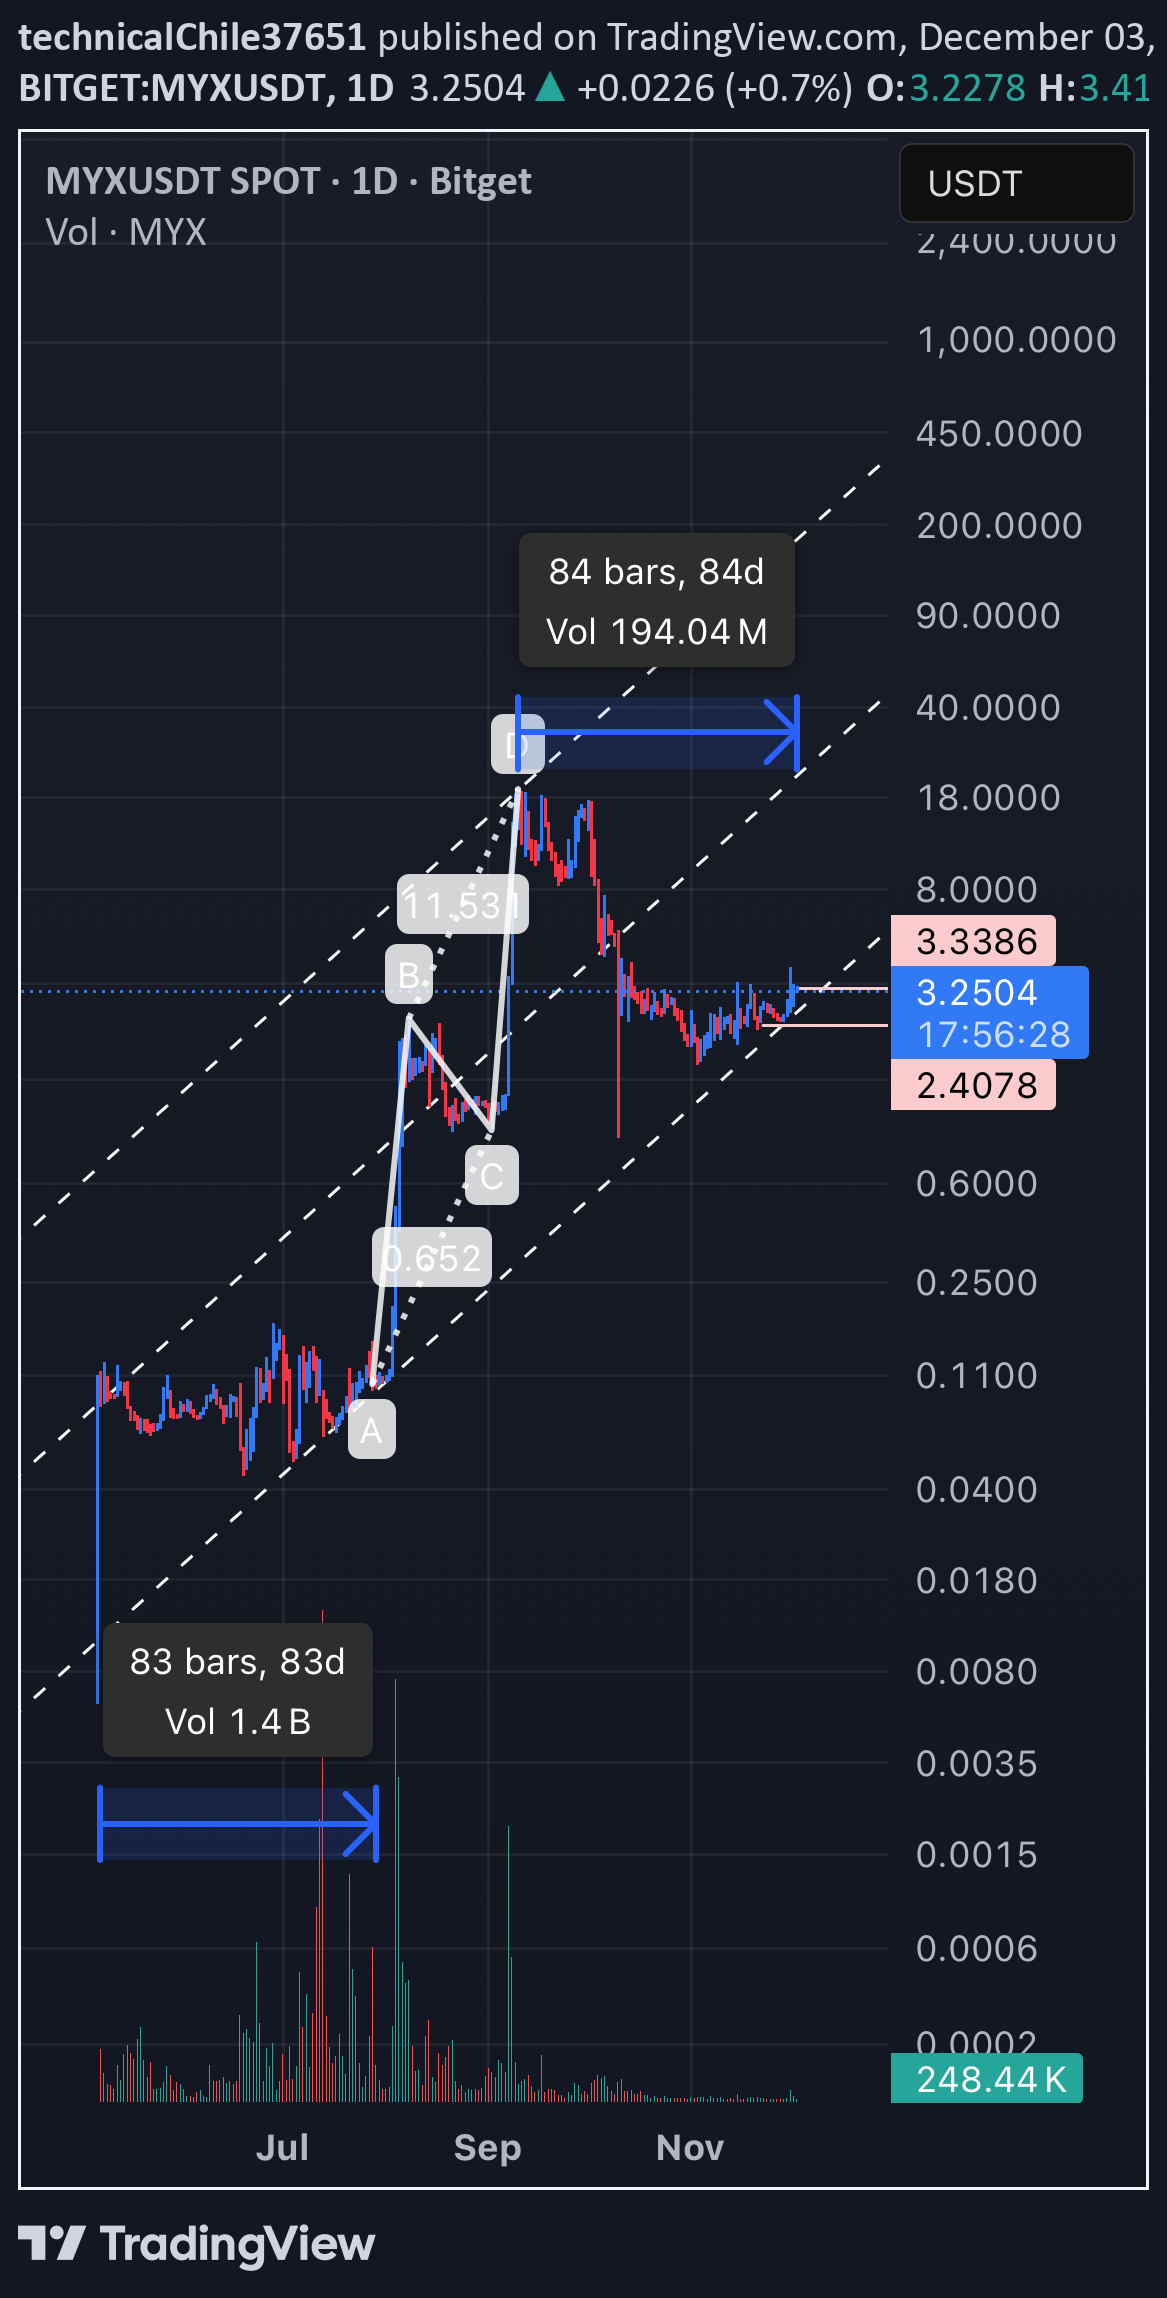
MYXUSDT در کف کانال قدرتمند: انتظار رسیدن به ۱۳۰ دلار در چند روز آینده!
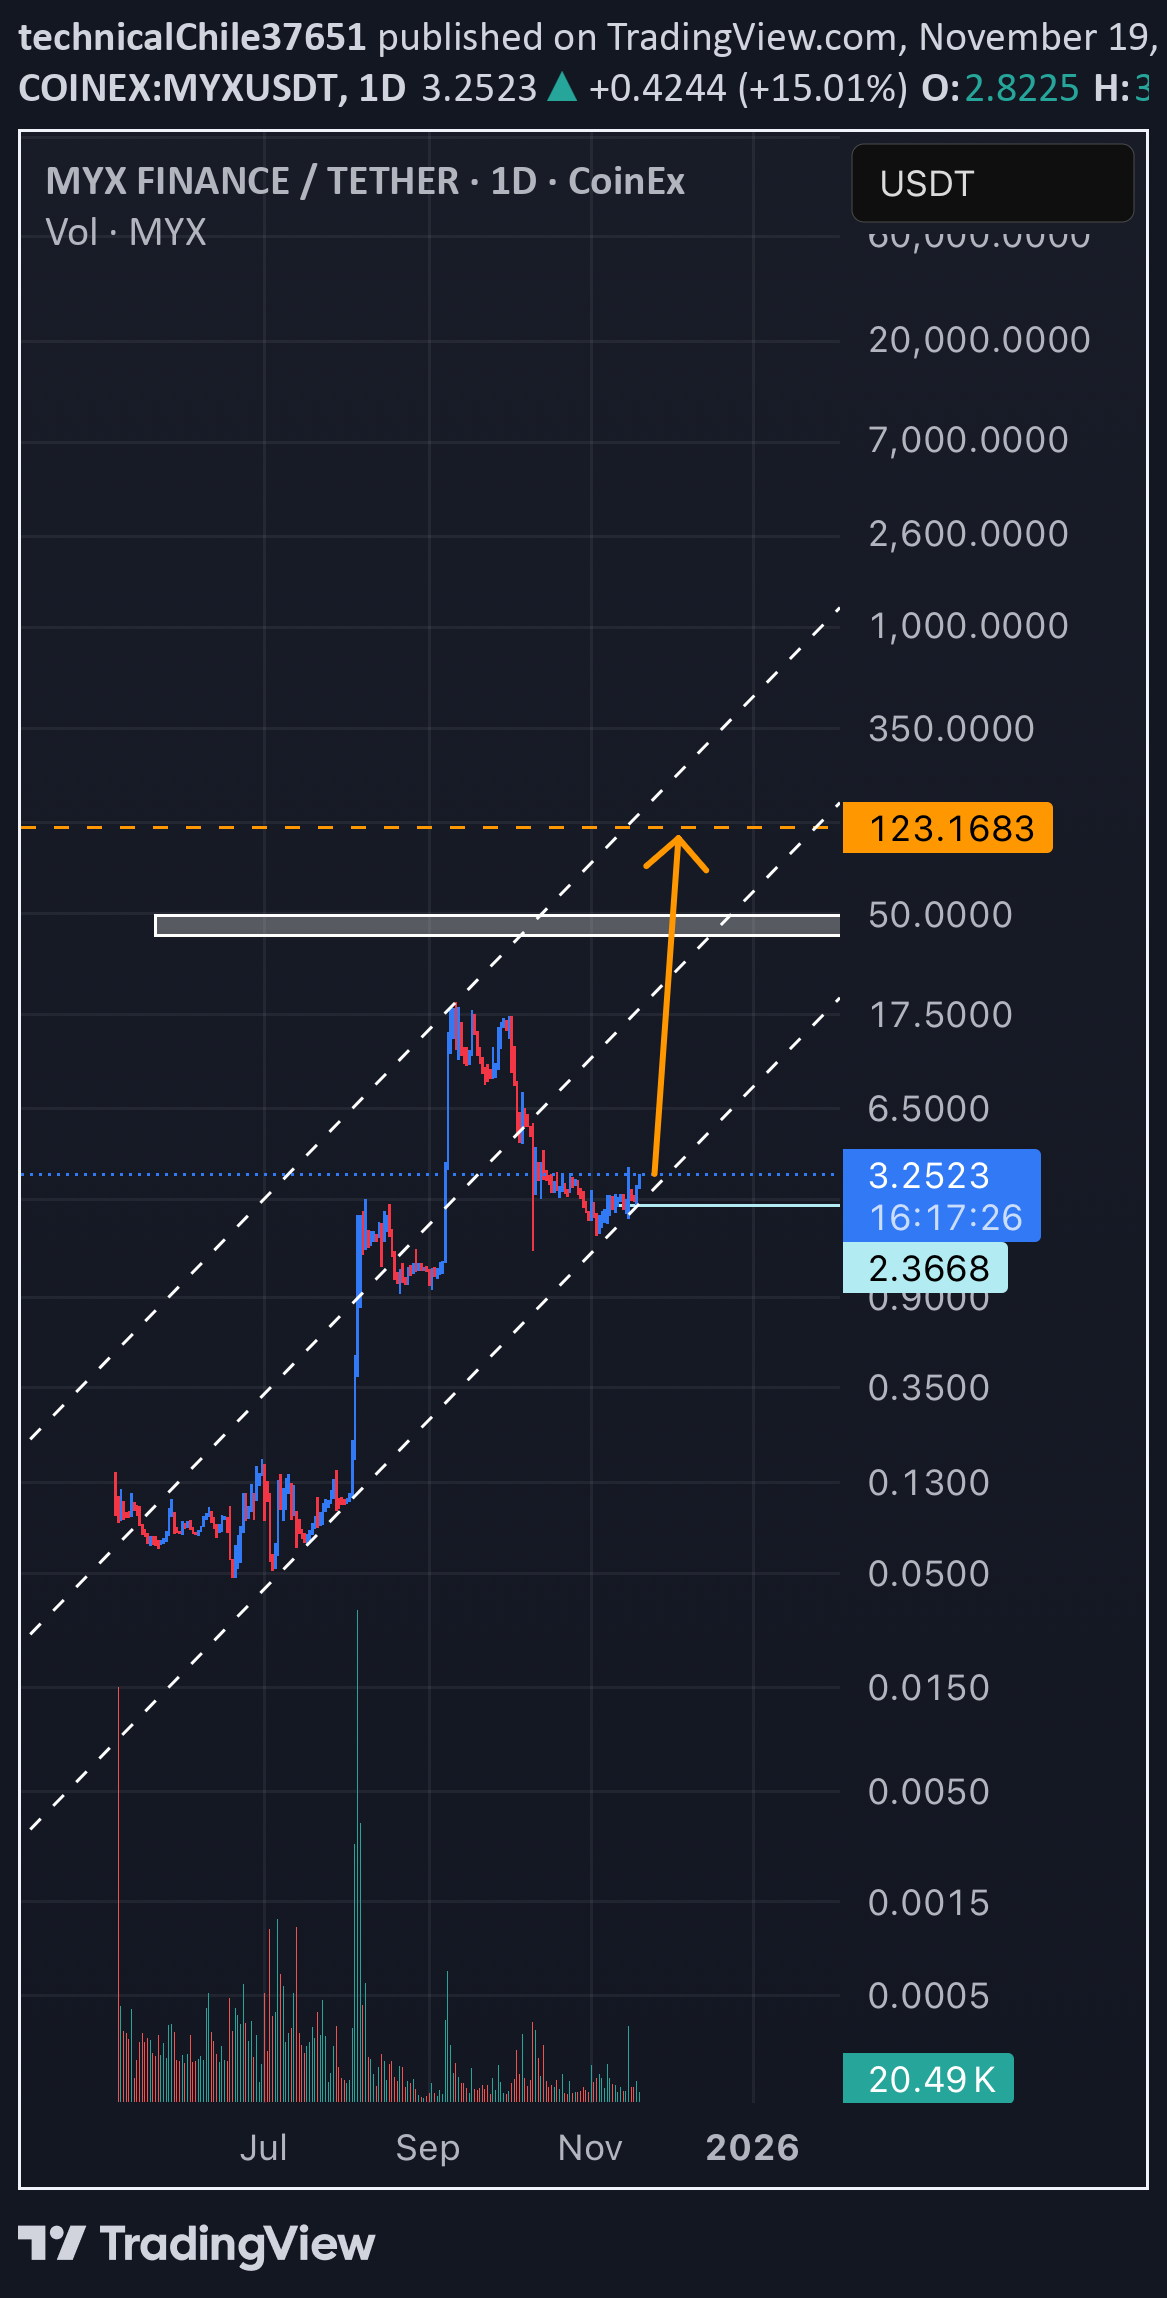
It is in the bottom of a firm and strong channel and will touch 130$ Less than a few days
WaveRiders2

OlegDC
سناریوی صعودی MYXUSD: فرصت خرید در کف قیمت، انتظار سود 100 برابری!
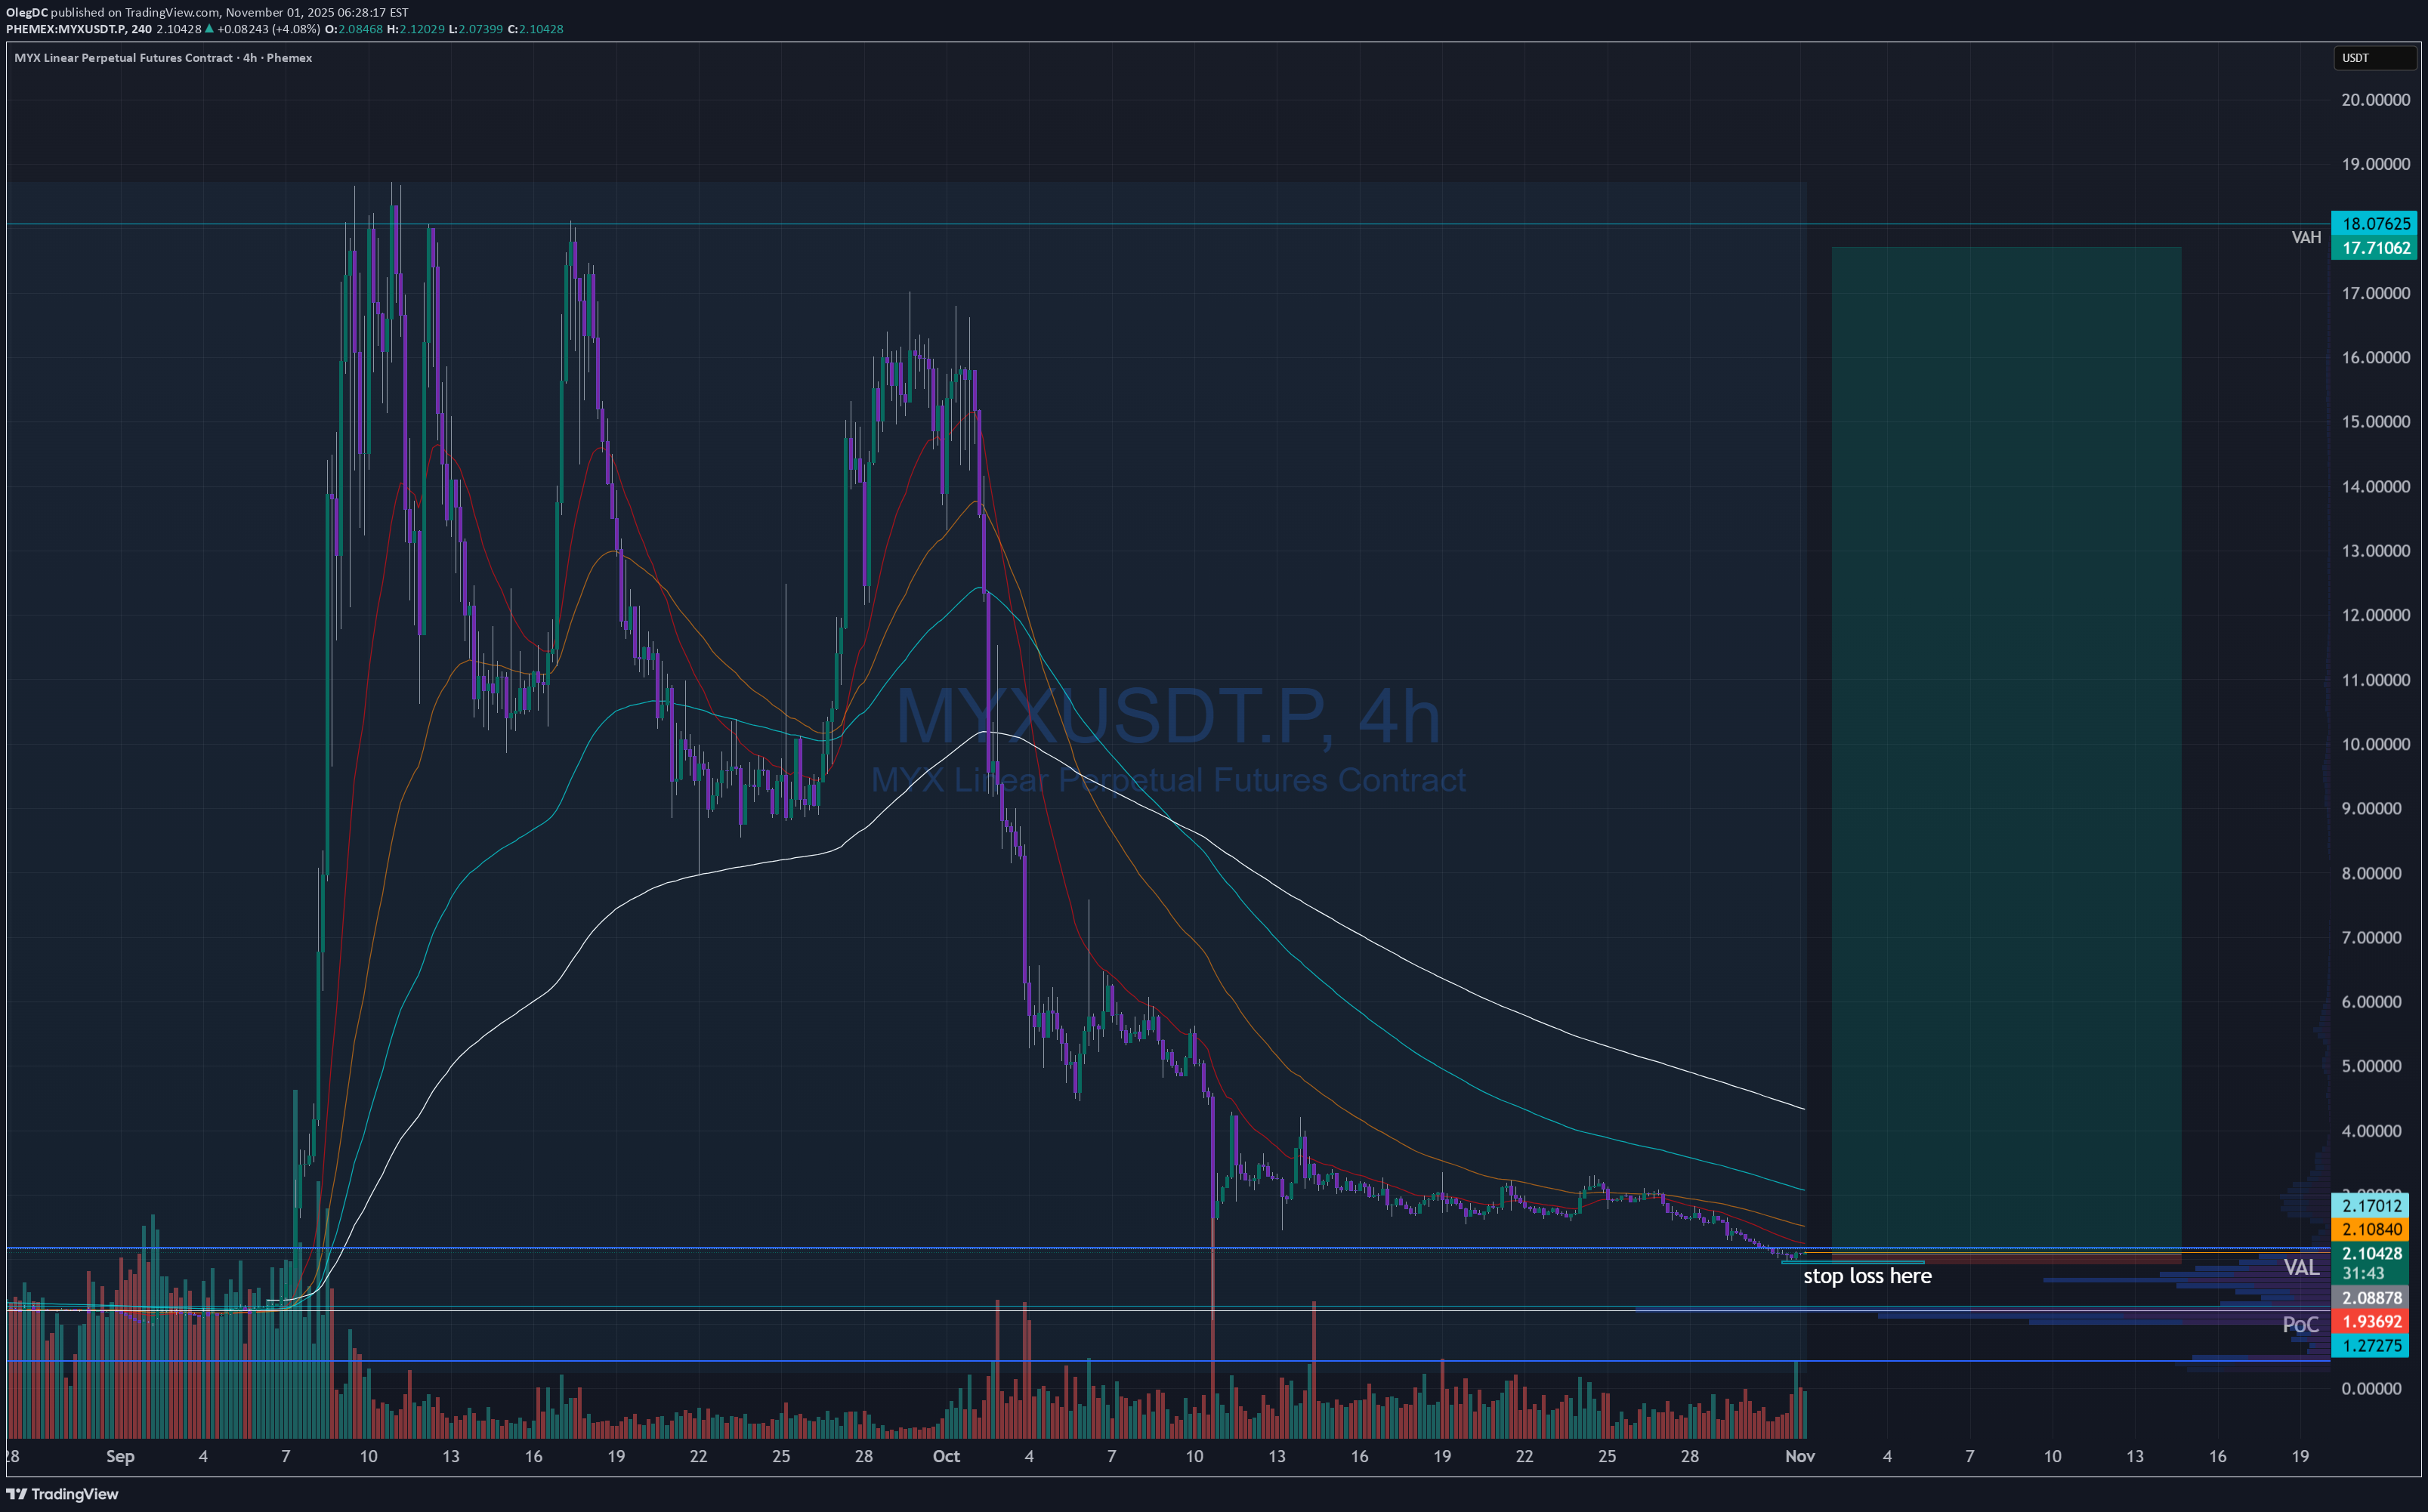
MYXUSD has reached low point, currently at VAL. Perfect entry would be lower at PoC. I guess I have no patience or trying to front run. RR is 100 if it get back to highest point, might take a month of grinding, but Im ready for that. SL is 3% below. Perfect scenario would be either touch VAL or PoC. Time will show.

Cryptojobs
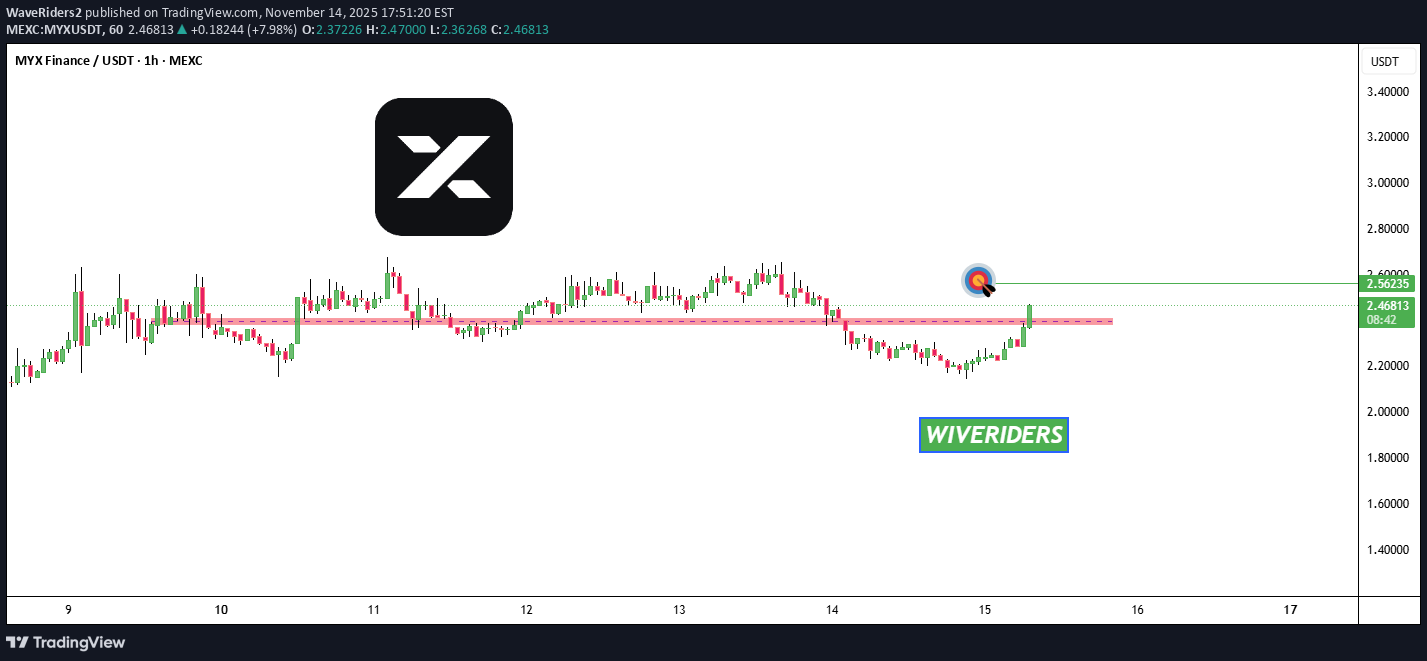
MYX: آیا پامپ 50 درصدی در راه است؟ تحلیل فنی و سیگنالهای صعودی!
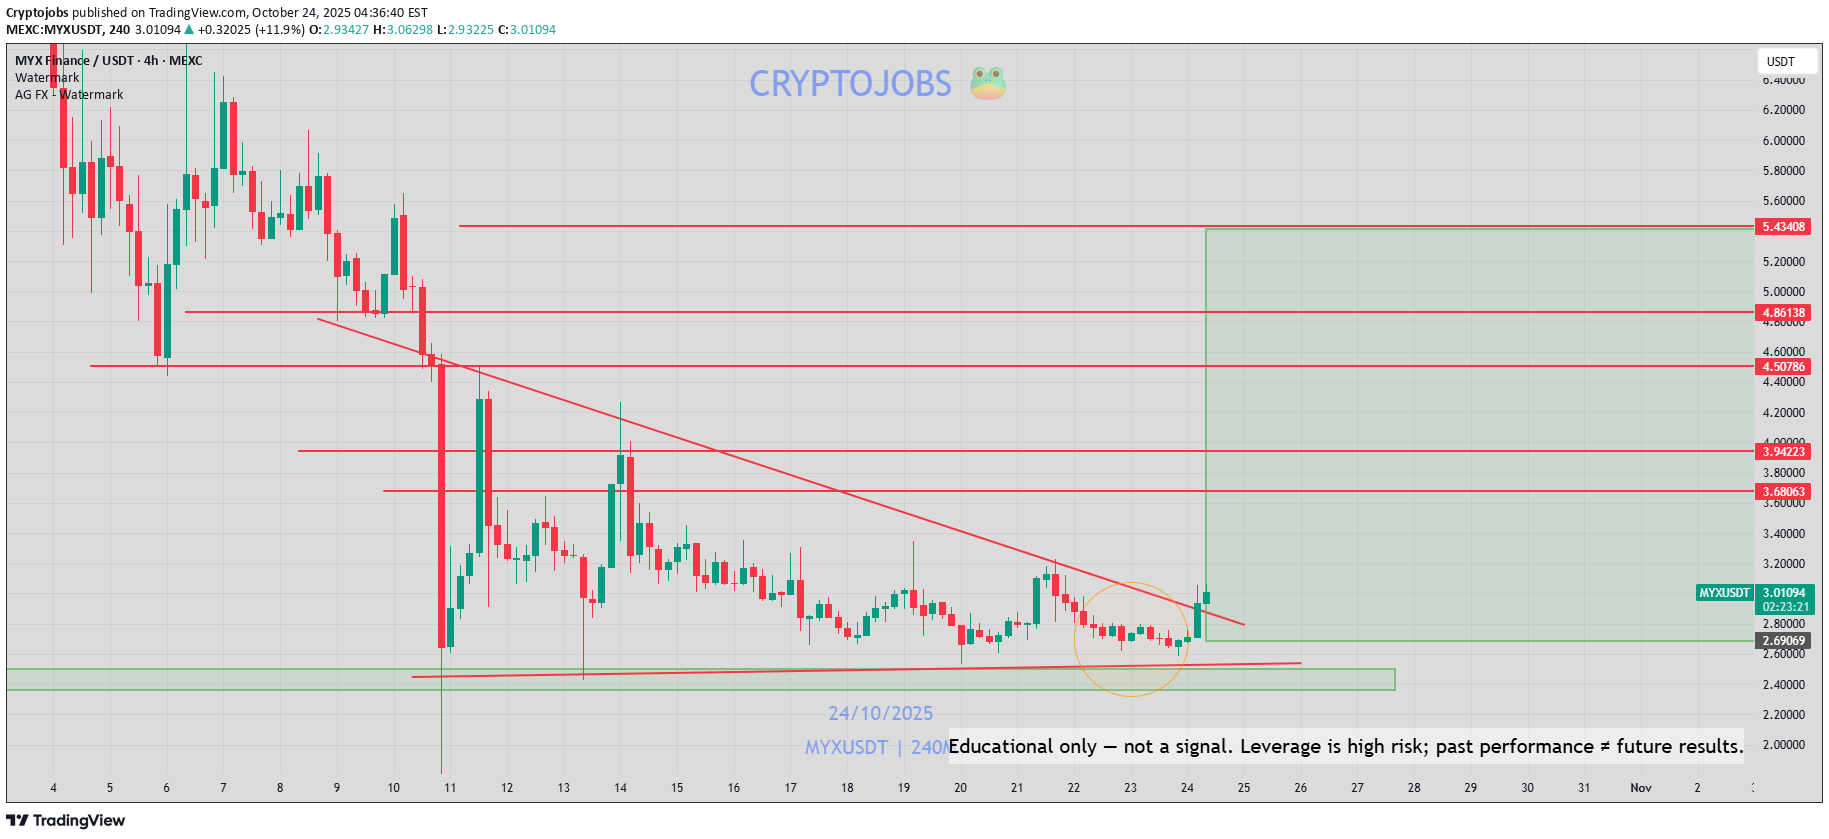
Is MYX ready for another leg up? 🚀 Technical analyses outlook: -Bull div RSvI Daily ✅ -Solid support forming above the 2.500$ level✅ -85% down from Triple TOP weekly resistance! [likely manipulation] -H1 Triangle structure [reversal?] Breakout ✅ -Bullish morning star candle daily? 💣 In my opinion, as long as prices consolidate above the green zone [2.5$], we could see another bull rally like 50%+! 📈 Do you have Any informations about the project, dev etc...?
Disclaimer
Any content and materials included in Sahmeto's website and official communication channels are a compilation of personal opinions and analyses and are not binding. They do not constitute any recommendation for buying, selling, entering or exiting the stock market and cryptocurrency market. Also, all news and analyses included in the website and channels are merely republished information from official and unofficial domestic and foreign sources, and it is obvious that users of the said content are responsible for following up and ensuring the authenticity and accuracy of the materials. Therefore, while disclaiming responsibility, it is declared that the responsibility for any decision-making, action, and potential profit and loss in the capital market and cryptocurrency market lies with the trader.