
MLN
Enzyme
| تریدر | نوع سیگنال | حد سود/ضرر | زمان انتشار | مشاهده پیام |
|---|---|---|---|---|
 Alpha-GoldFXRank: 34432 | خرید | حد سود: تعیین نشده حد ضرر: تعیین نشده | 11/6/2025 |
Price Chart of Enzyme
سود 3 Months :
سیگنالهای Enzyme
Filter
Sort messages by
Trader Type
Time Frame

noam_chom
هیولای خفته دیفای (Melon) منتظر بیداری اتریوم ۲۰۲۶: هدف قیمتی ۱۰۰ دلار!
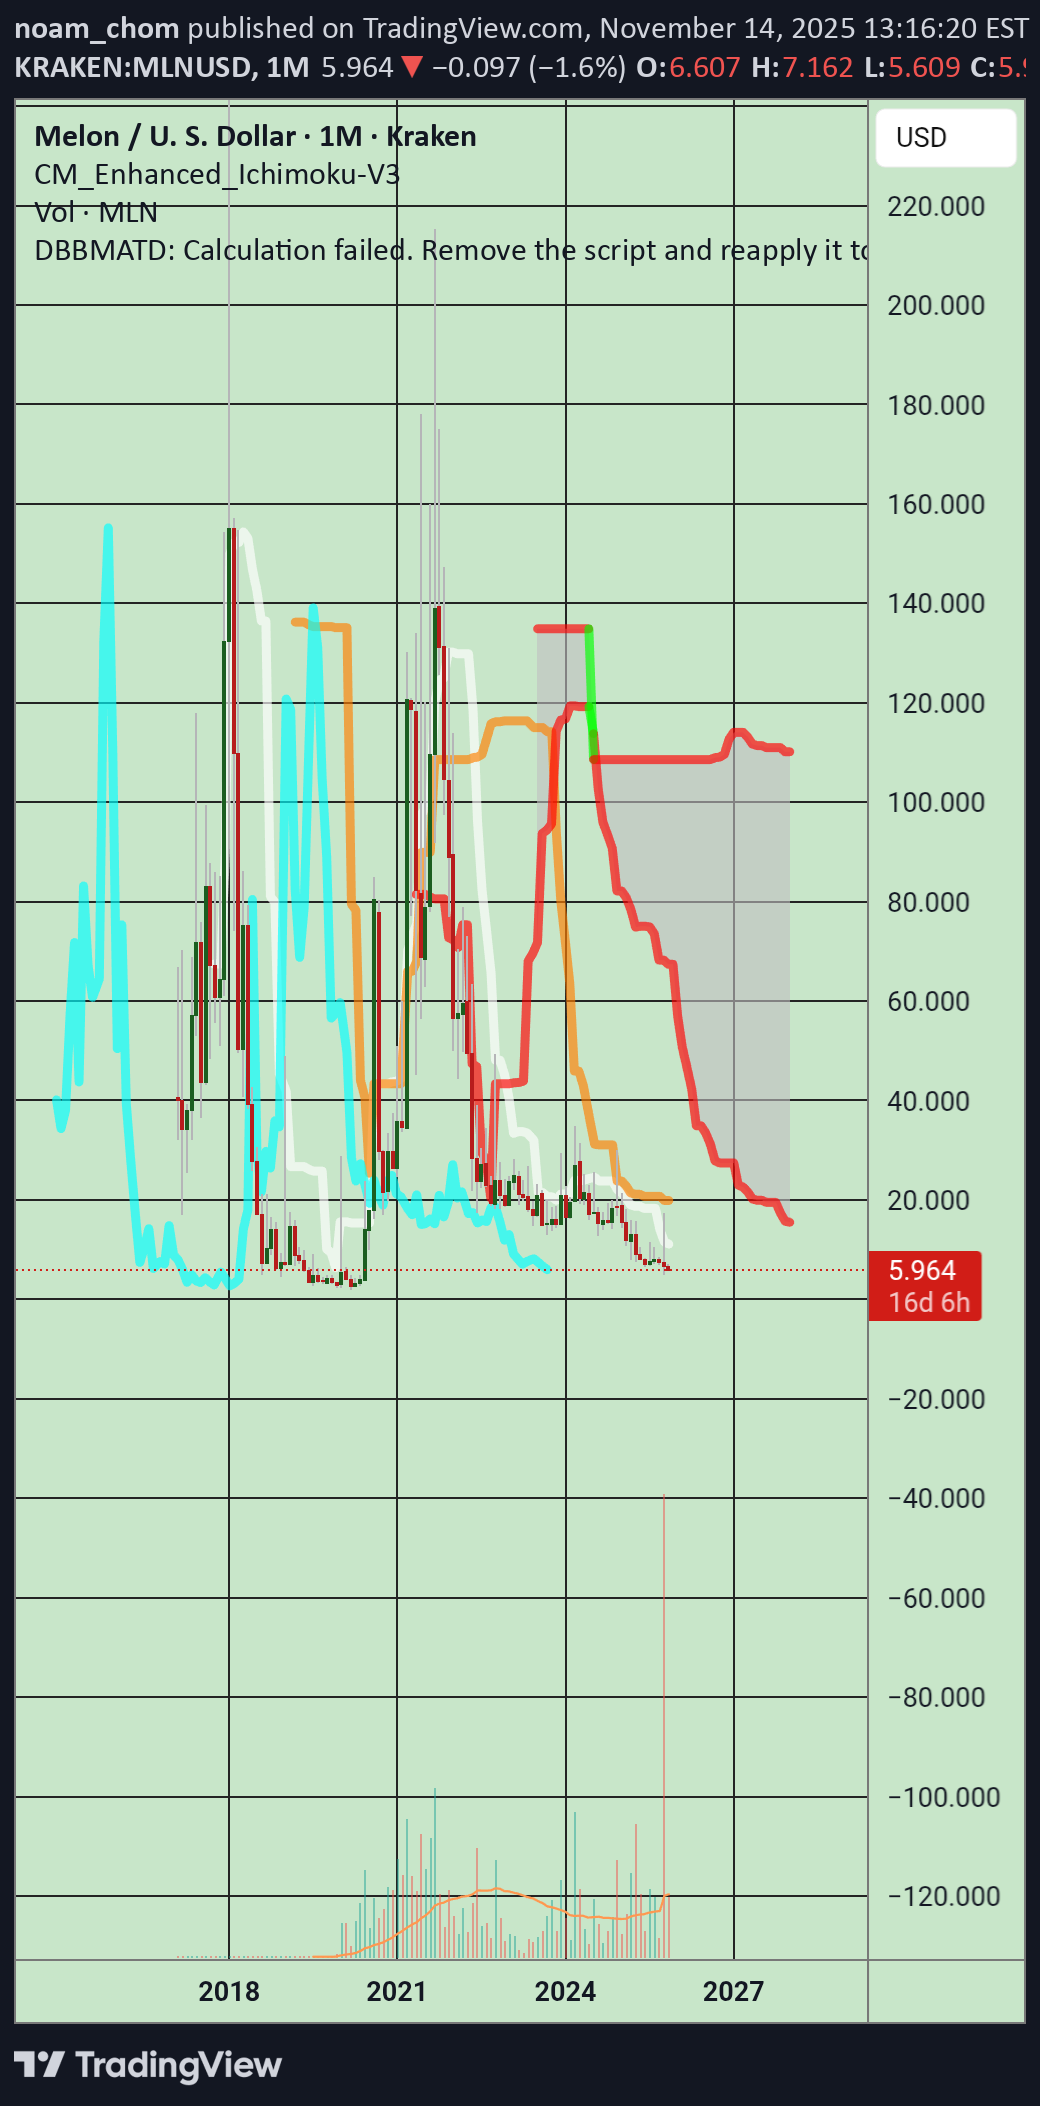
This should rally hard, if Ethereum wakes up in 2026 Price target would be $100

DragonCaoB
پیشنهاد معامله خرید (Long) برای MLN: سود ۲ برابری با ریسک کنترلشده!
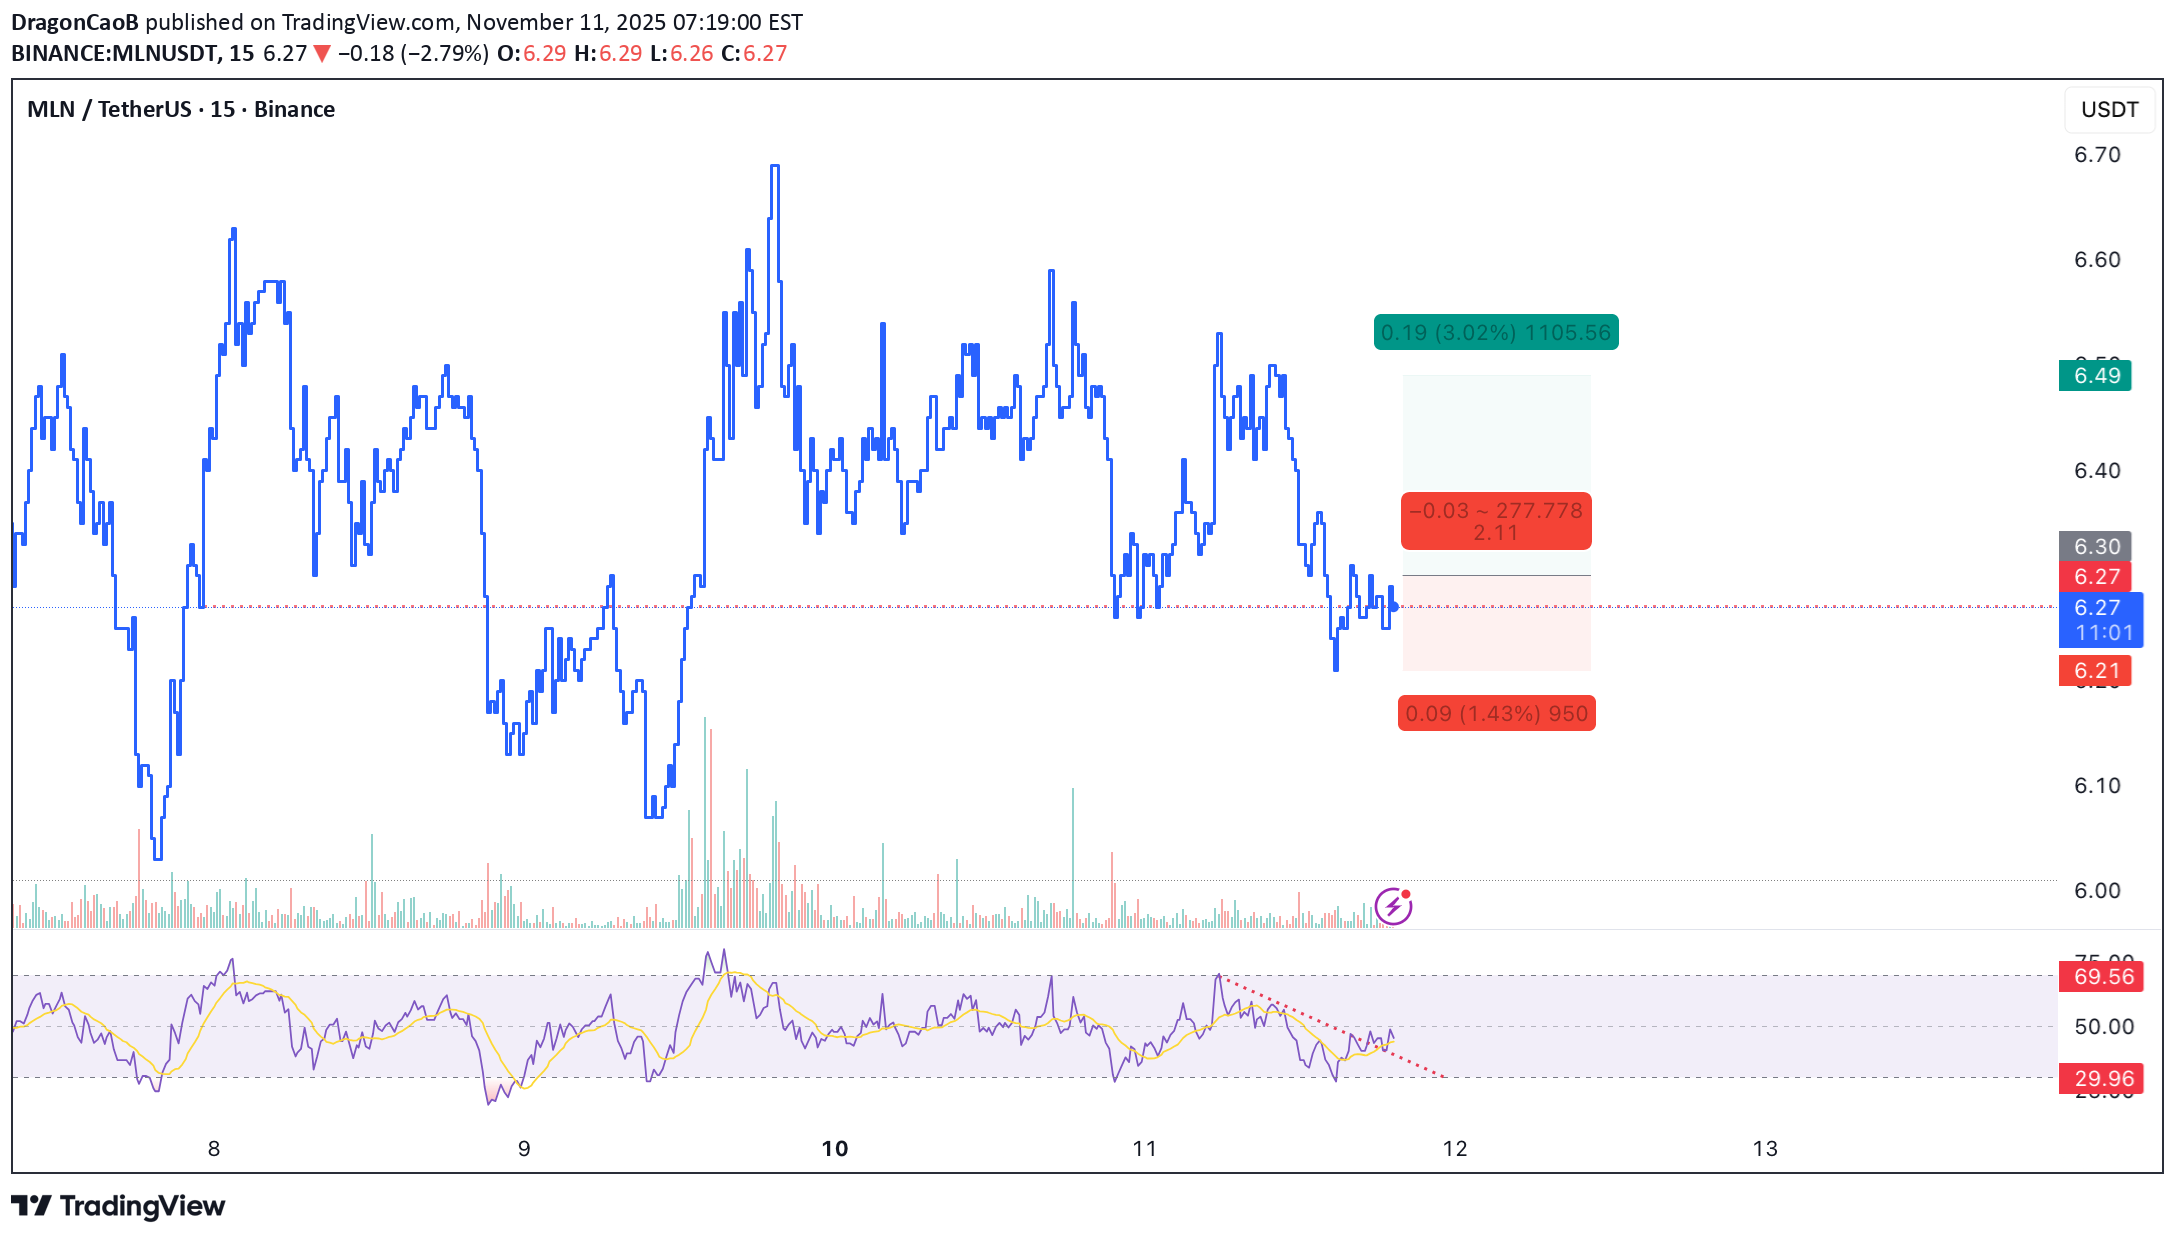
📈 Scalp Long – MLN Strong buying momentum is returning across lower timeframes, and price action indicates a potential move to retest the local high. The price is currently holding above a solid support zone, suggesting a favorable setup for continuation. 🎯 Trade Setup: Take Profit (TP): 6.49 Stop Loss (SL): 6.21 Risk/Reward Ratio (RR): 1 : 2.11 A concise long setup supported by renewed buying pressure and solid structural support.

Cryptojobs

Alpha-GoldFX
پیشبینی انفجاری MLNUSDT: موج صعودی قدرتمند با پتانسیل رشد 100 درصدی!
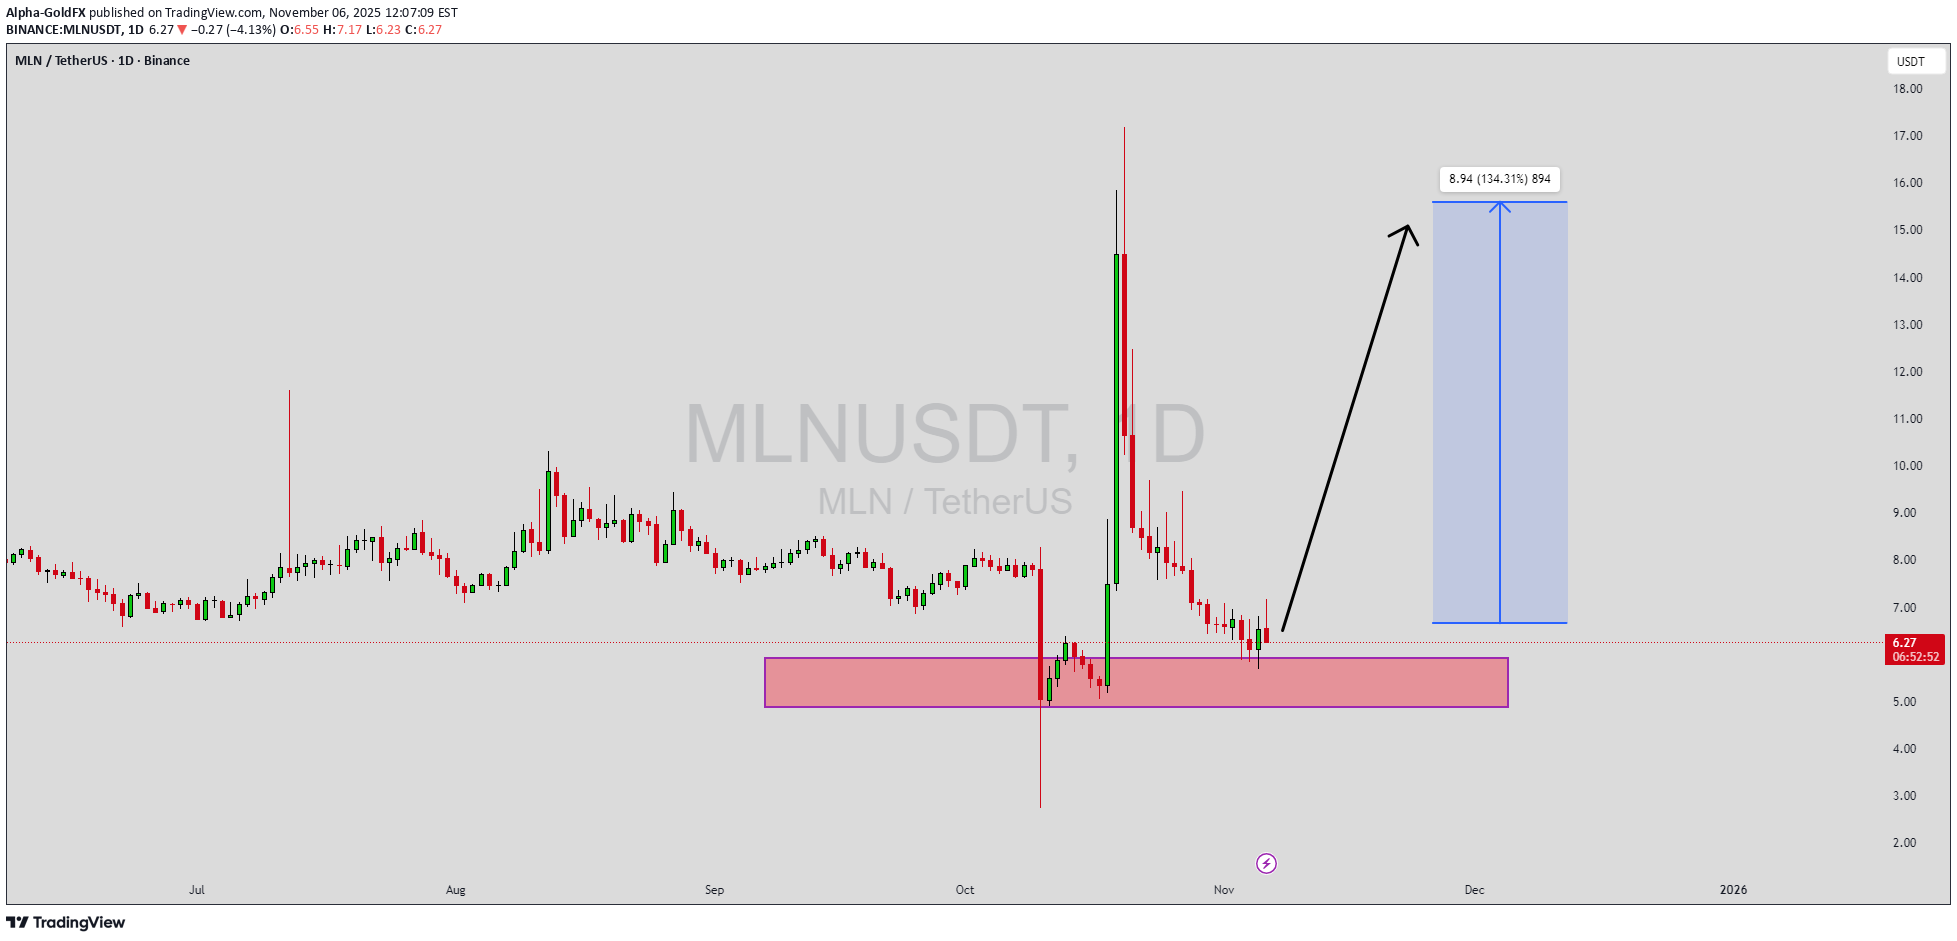
MLNUSDT is forming a clear bullish wave pattern, a dynamic Elliott impulse signal that points to building upward momentum in the DeFi asset management space. Trading around $6.20 USDT with a $19 million market cap, the token has traced higher lows and accelerating swings since its October base near $5.00, capping a mild 8% correction amid broader altcoin digestion. With good volume averaging $15 million daily, up 20% week-over-week, this setup confirms accumulation as buyers stack positions, eyeing a breakout above $6.50 resistance for the next wave leg—projecting 90% to 100%+ gains to $12.00+, a repeat of its 180% summer rally. This bullish wave in MLNUSDT unfolds as corrective ABC dips resolve into impulsive 1-2-3 advances, a classic reversal hallmark after prolonged sideways action, drawing technical eyes for its Fibonacci-aligned extensions and RSI climbs past 55. Traders scanning MLNUSDT price prediction charts note the volume-backed thrusts rejecting lower supports, signaling a sentiment flip from neutral to greedy as Enzyme's on-chain vaults see 12% TVL growth, priming for bullish wave pattern crypto executions in the ongoing bull cycle. Rising investor interest in MLNUSDT underscores faith in Enzyme's modular vaults and yield strategies for tokenized assets, positioning it as a DeFi revival play amid protocol upgrades for cross-chain liquidity. With tight risk below $5.80 and momentum coiling, this wave could spark Enzyme token analysis and "bullish reversal altcoins 2025" fervor—confirmation on volume surge might ignite the full cascade for strategic longs. ✅ Show your support by hitting the like button and ✅ Leaving a comment below! (What is You opinion about this Coin) Your feedback and engagement keep me inspired to share more insightful market analysis with you!
Cryptojobs
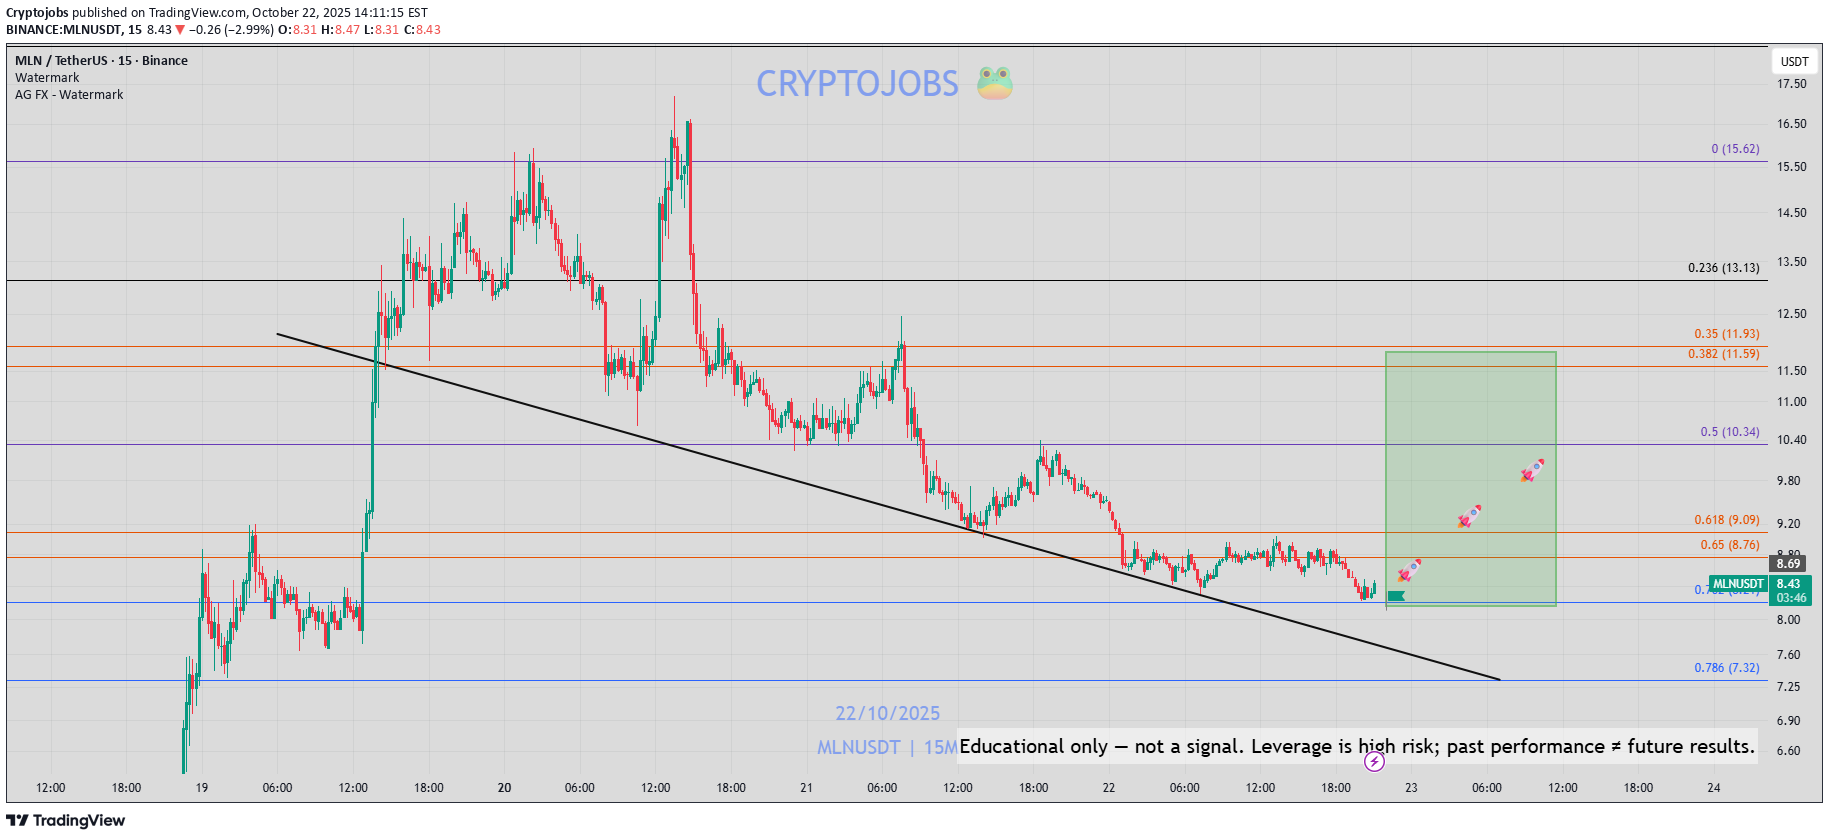
شکست صعودی هیجانانگیز MLN: آیا موج بزرگ آغاز میشود؟ (هدف ۱۲ دلار!)
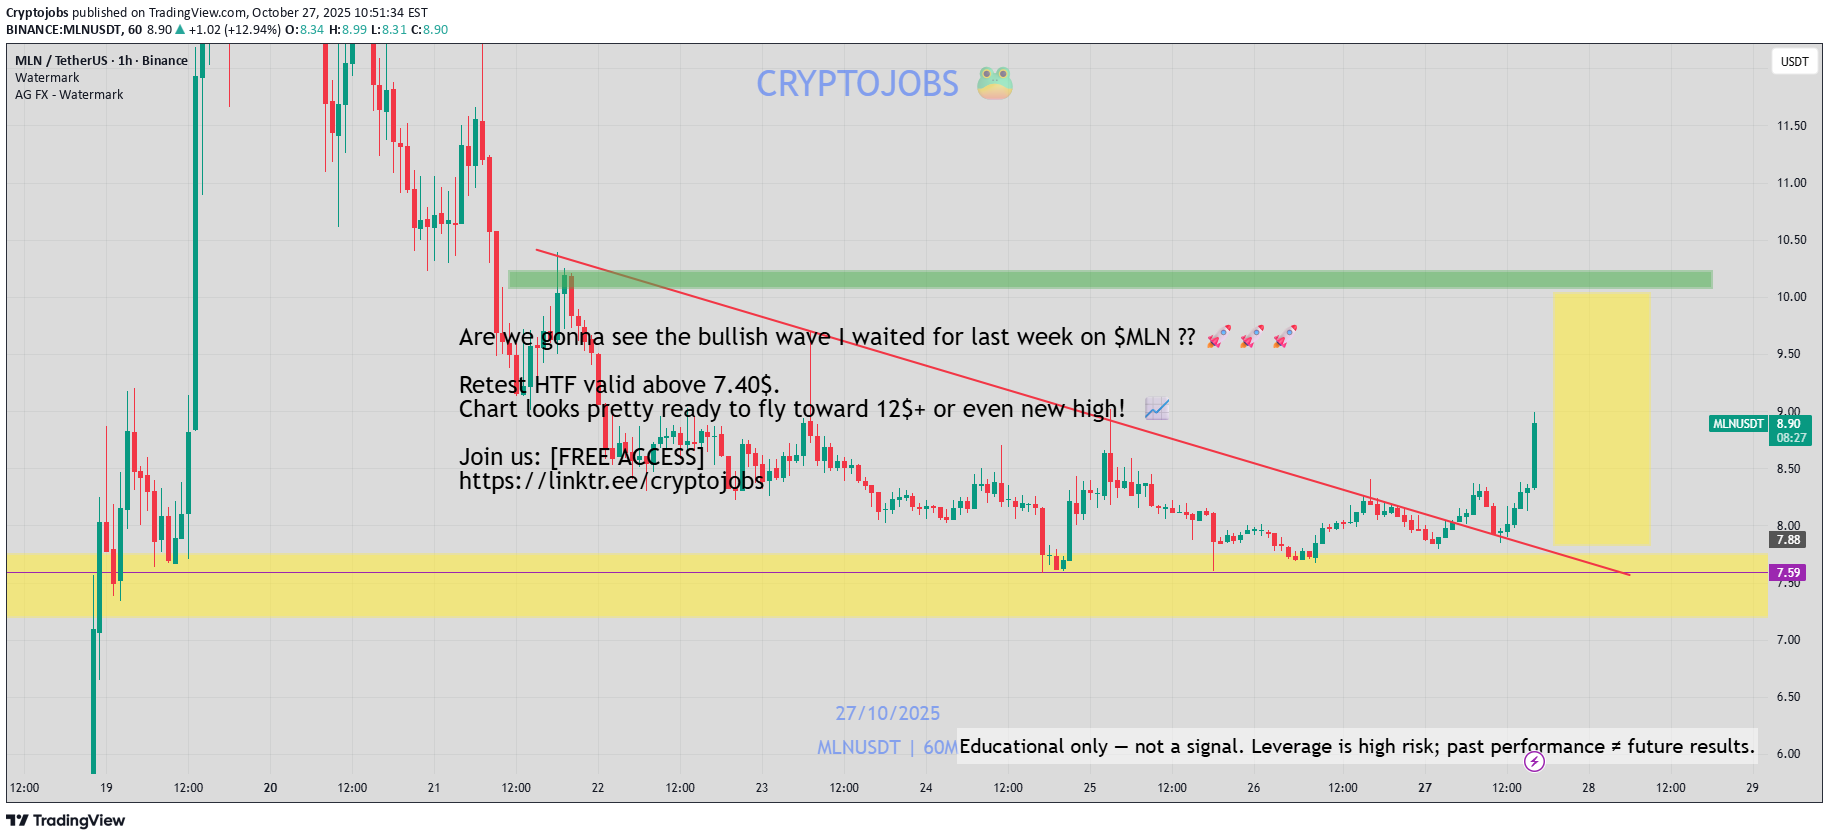
Are we gonna see the bullish wave I waited for last week on MLN ?? 🚀🚀🚀 Retest HTF valid above 7.40$. Chart looks pretty ready to fly toward 12$+ or even new high! 📈
Cryptojobs
خرید میلیونی MLN در کف قیمت: آیا زمان ورود به بازار است؟
MLN TIC TAC TIC TAC Thanks for this dip 8.20 - 8.50$ [I DCA]. #DYOR.
Cryptojobs
واکنش گاوی بزرگ در انتظار MLN: آیا قیمت بالای 8.20 دلار حفظ میشود؟
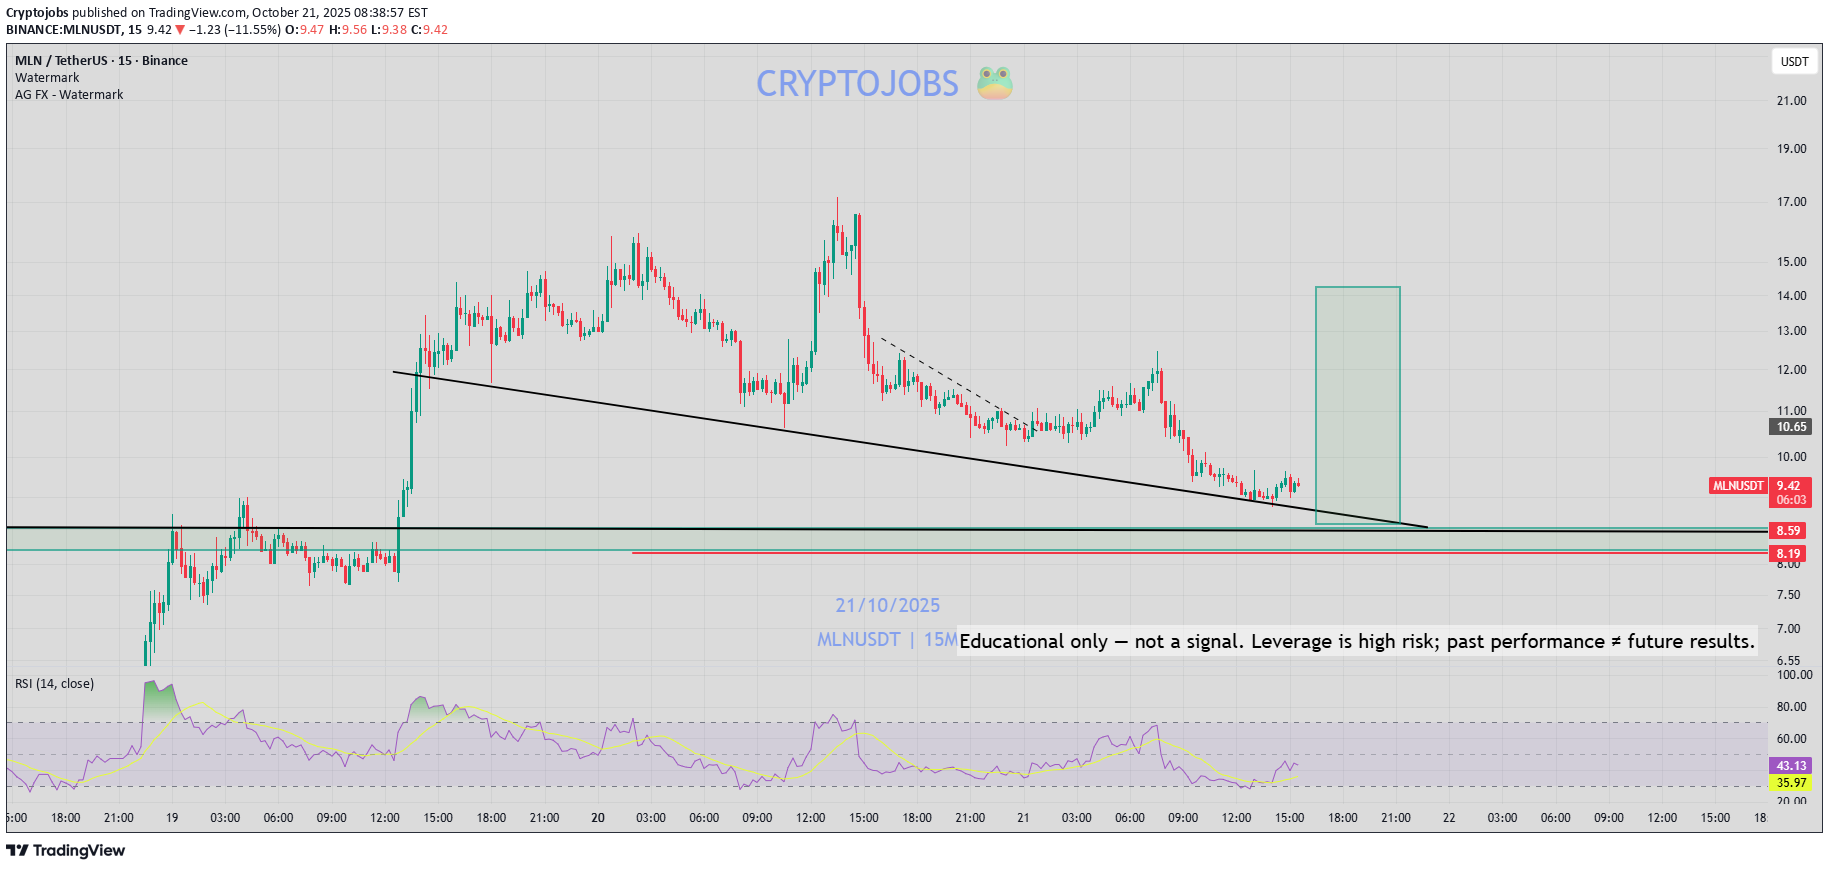
MLN , as long as price hold above 8.20$ I'll do DCA. Expecting to see another big bull reaction 📈
Cryptojobs
شکست انفجاری MLN: آیا قیمت به زودی سقف جدید میسازد؟ (سیگنال خرید قوی)
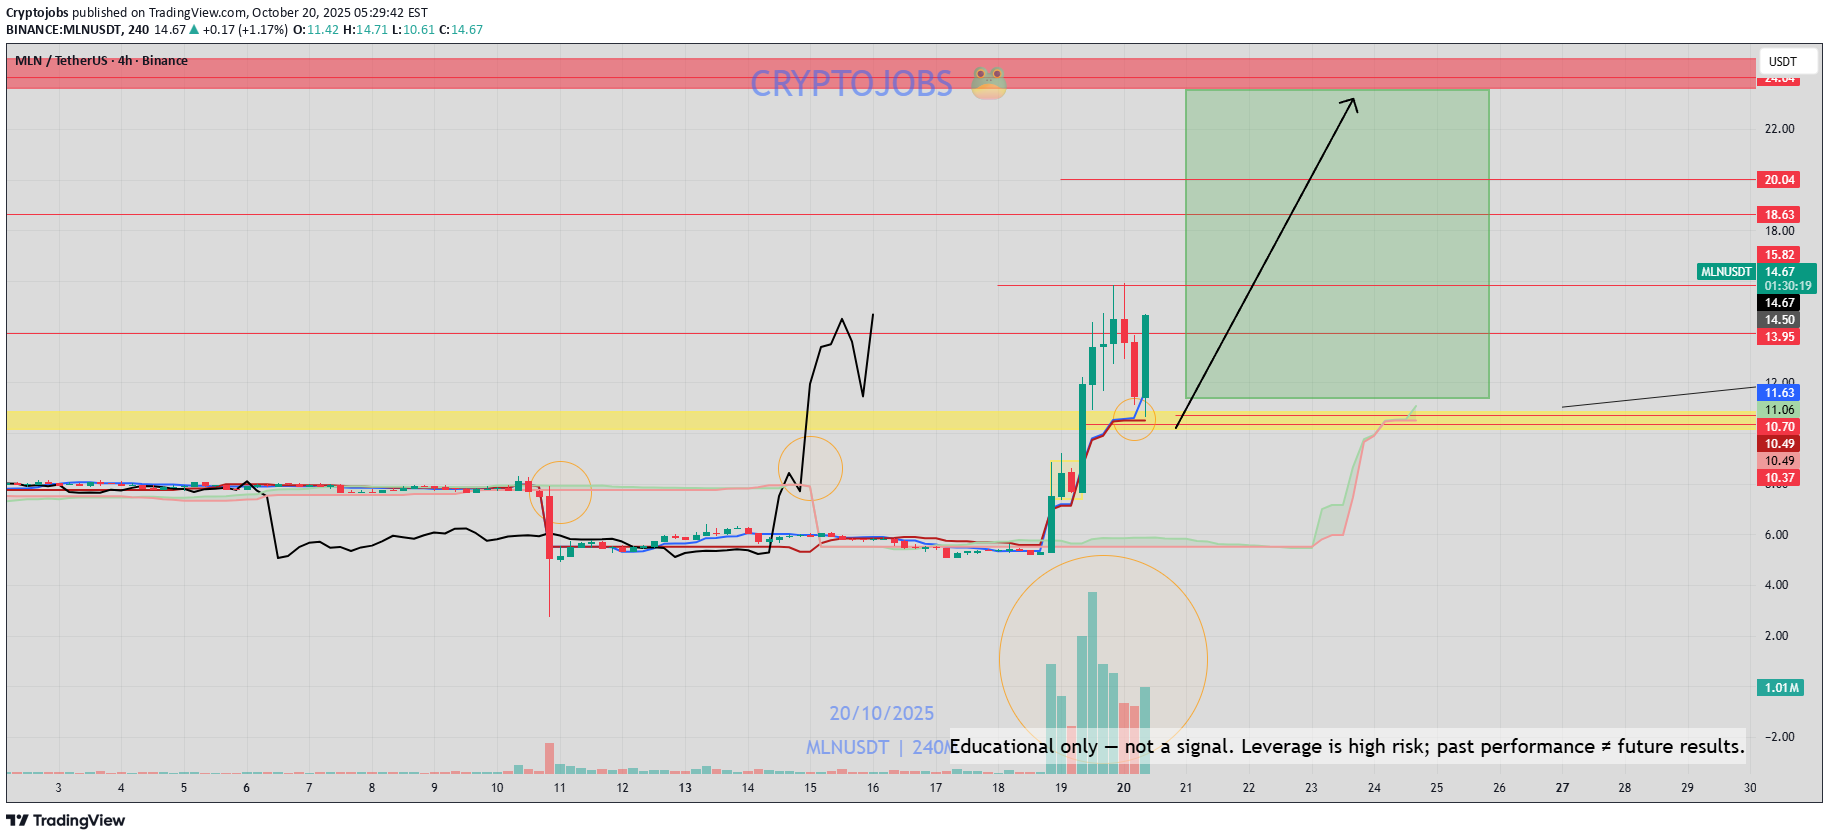
🚨 SPOT BREAKOUT ALERT 🚨 I see a solid and clean breakout + retest daily on MLN / USDT 🚀 ✅Perfect daily retest of the 10.40$ previous KEY resistance. [weekly] ✅HTF Trend reversal [ichimoku] ✅Ichimoku reyest (Kijun) ✅Strong buy volume ⚠️Better to wait for a weekly candle break above 18.20$ for full confirmation; but according to my setups, resistances are likely gonna be breakout!. Prices is surely gonna fly much higher during the next few days / week. 🚀 Current price +/- 13.20$ 🎯 - See you! Not a financial advice! #DYOR

Oligao

MeTraderTr
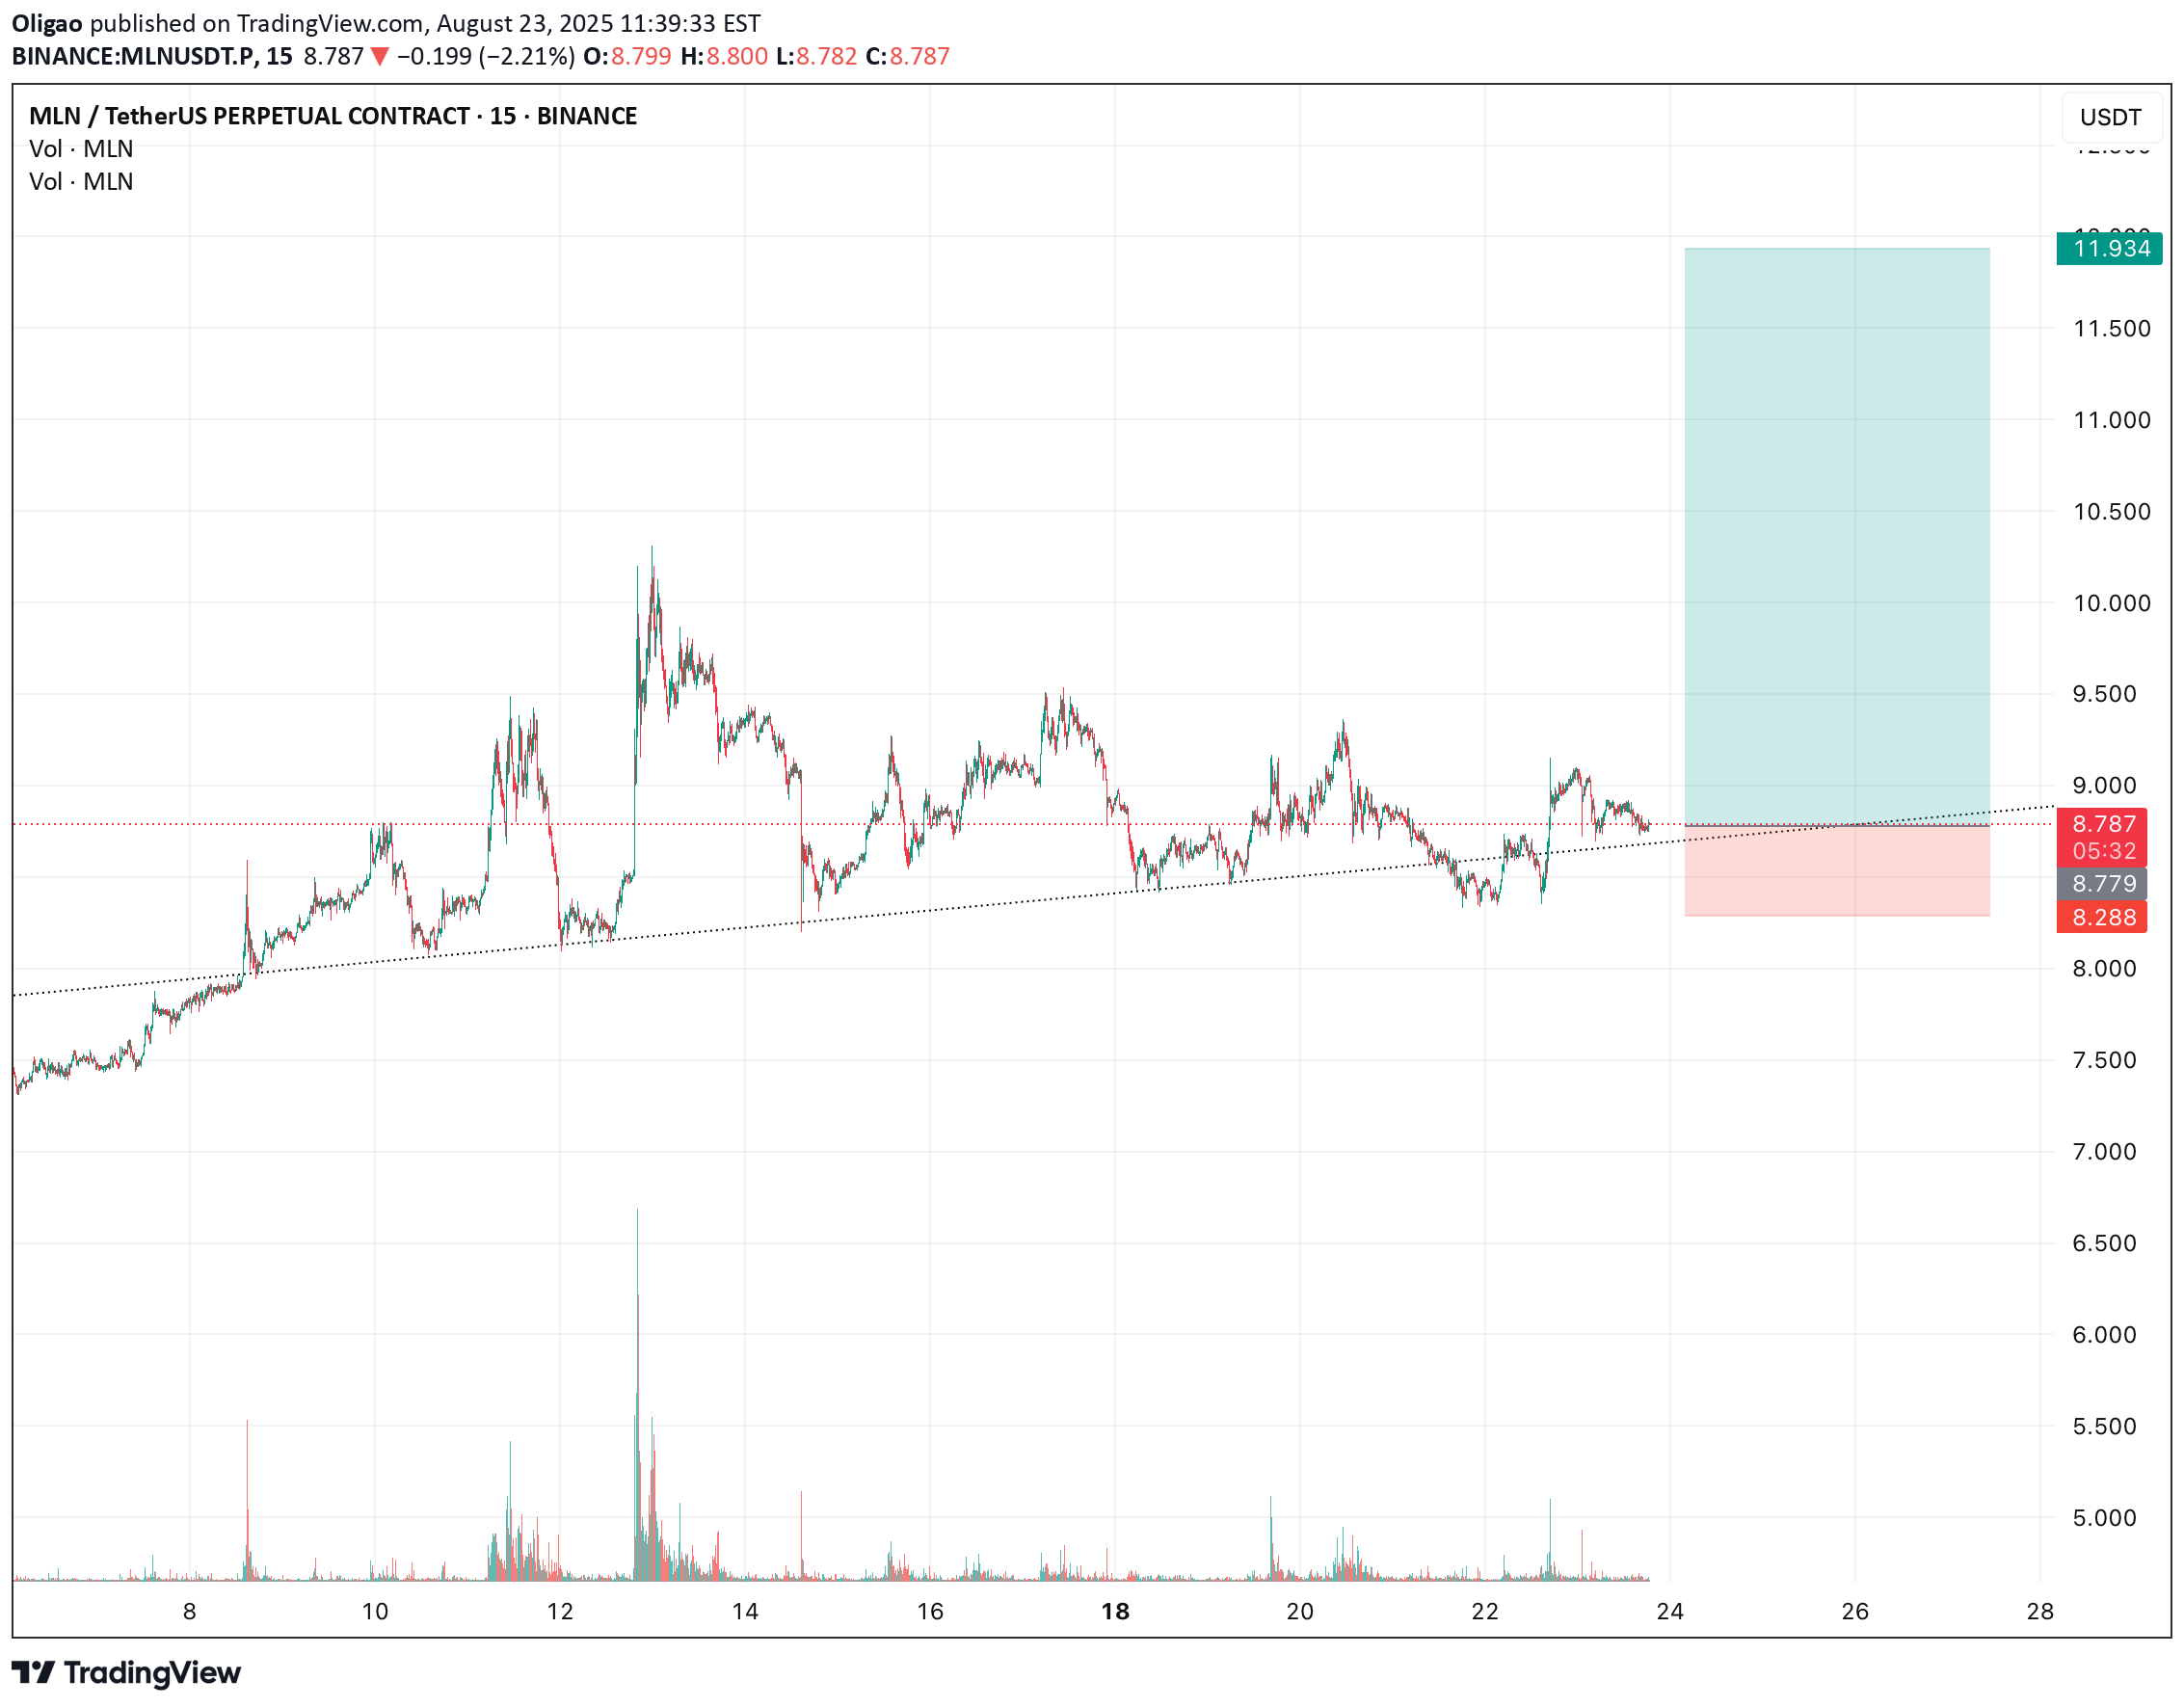
#MLN Coin, İsmi Güzel Grafiği Çirkin !!!
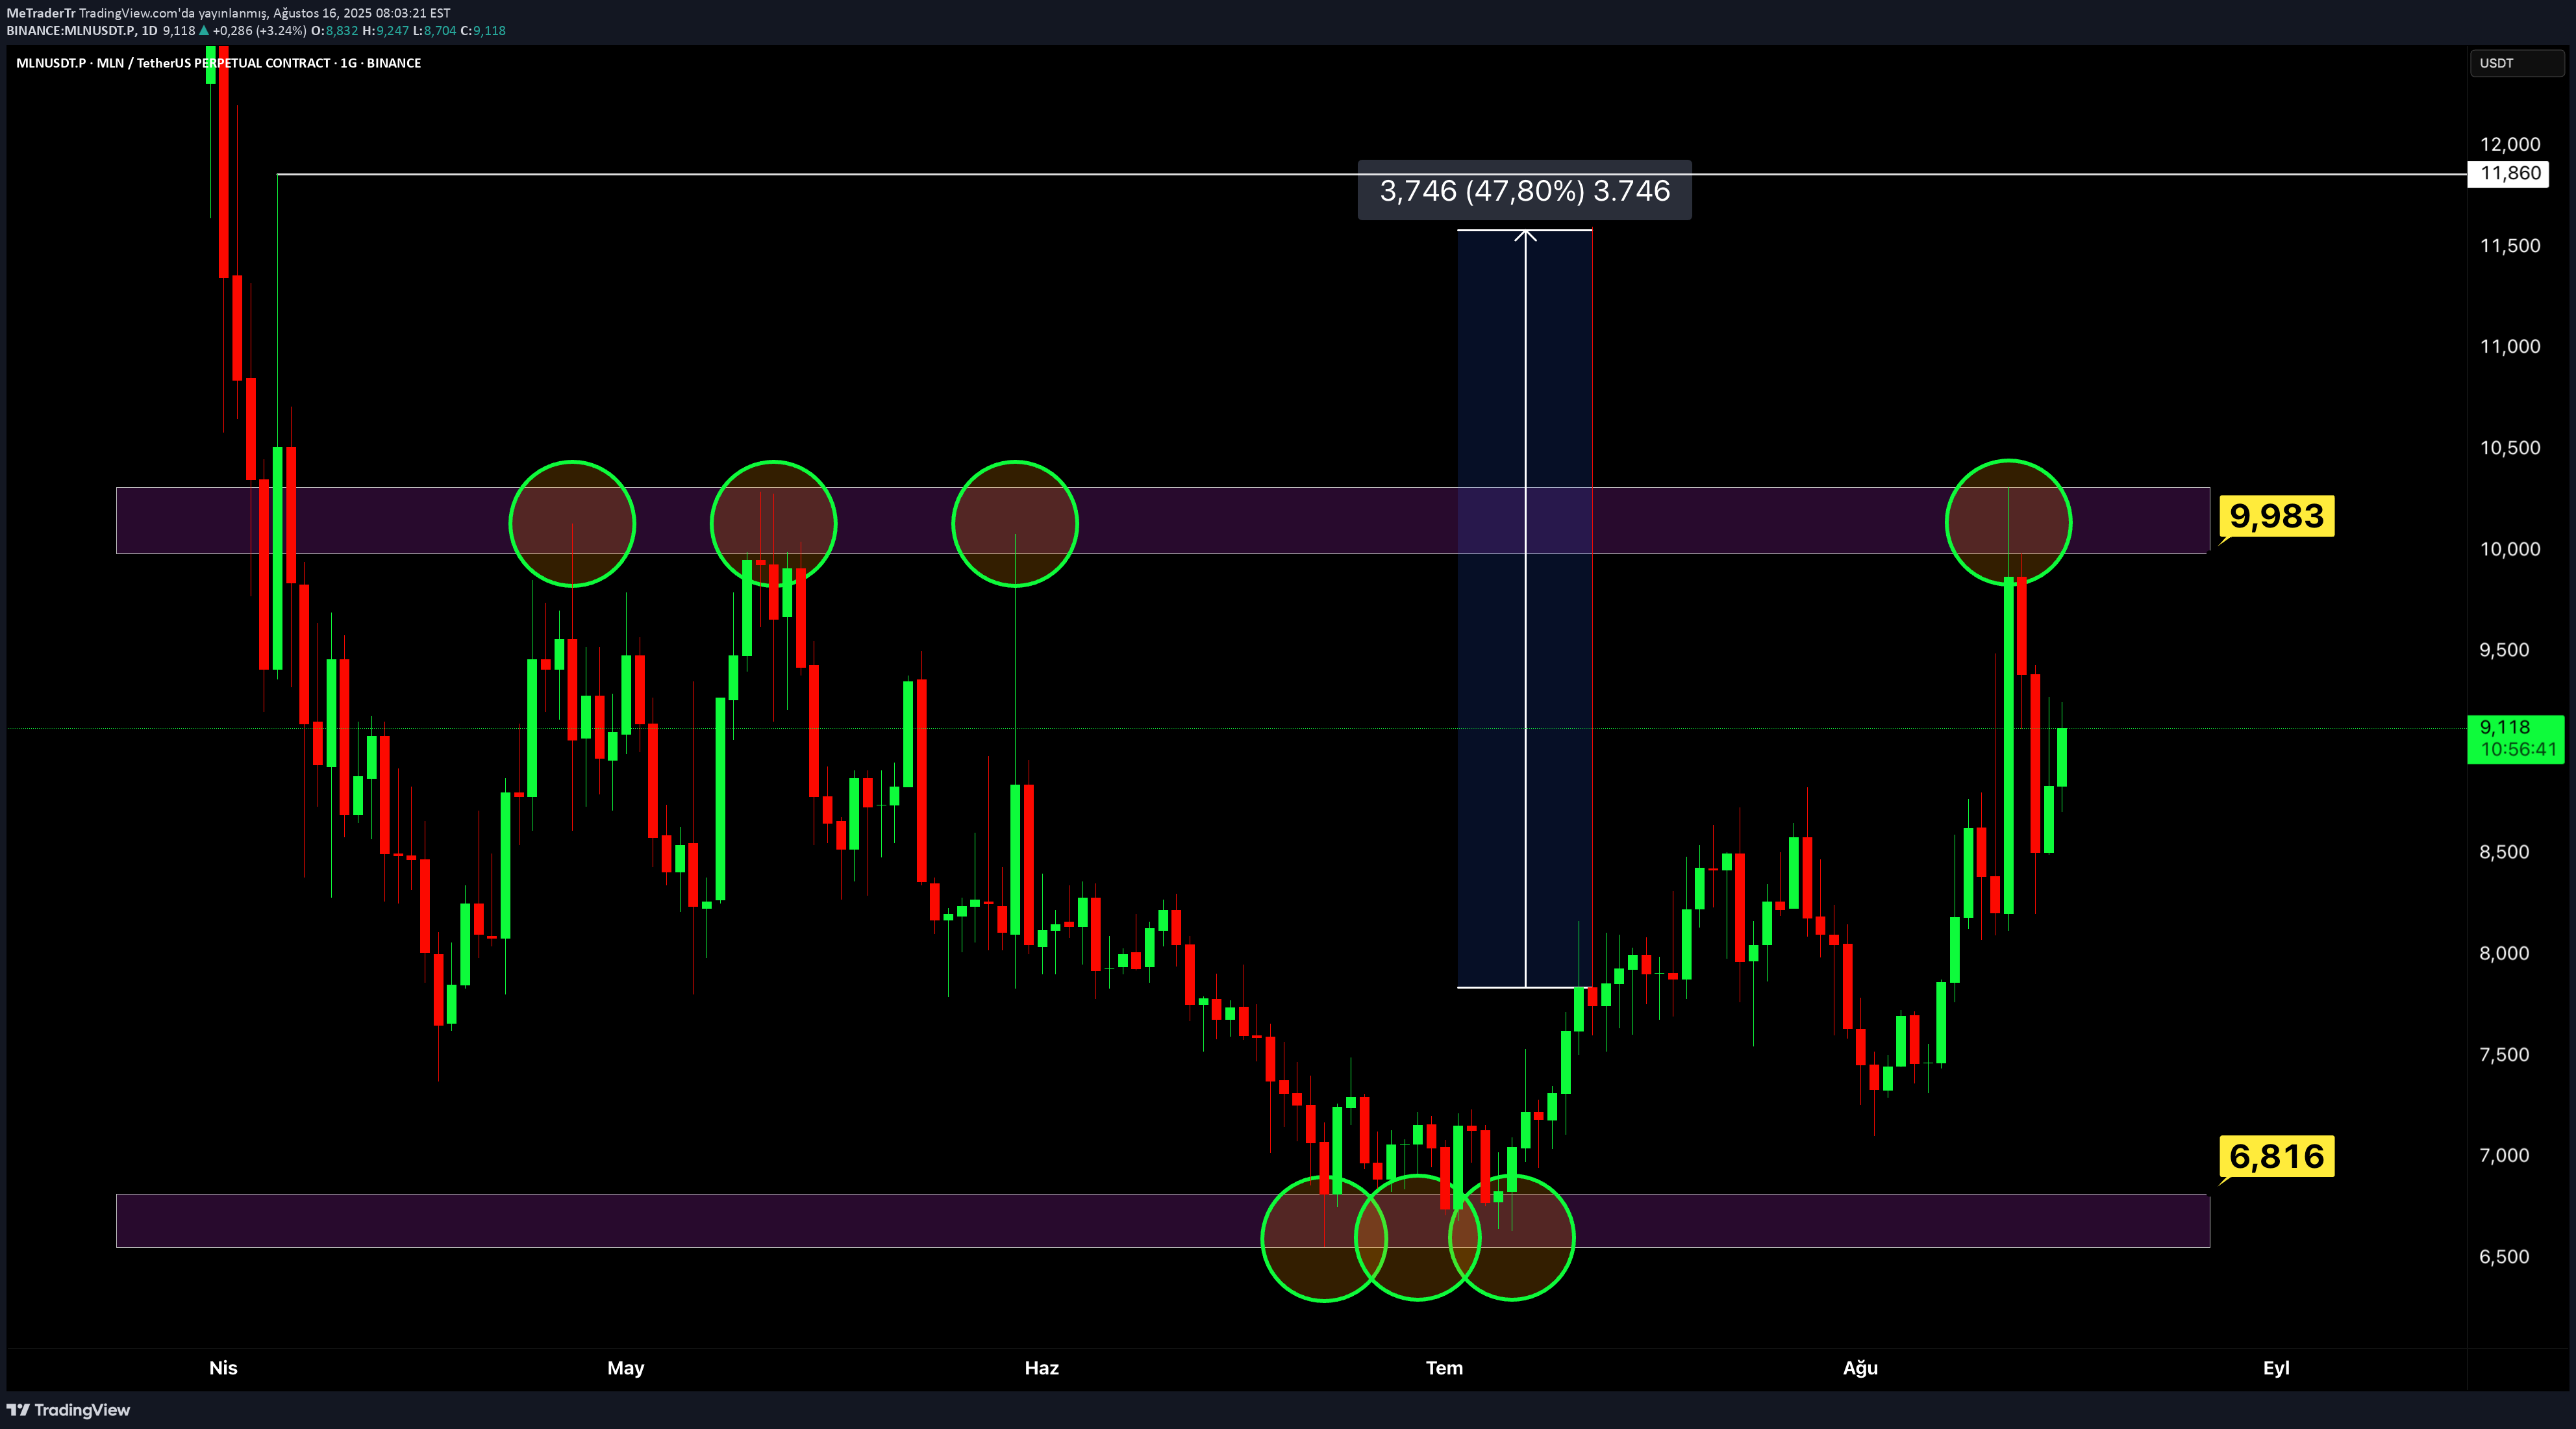
MLN There is not much to say for unfortunately ... The name of the beautiful graph is ugly ... Neither process or rich we will be rich ... Stay away from such coins ...
Disclaimer
Any content and materials included in Sahmeto's website and official communication channels are a compilation of personal opinions and analyses and are not binding. They do not constitute any recommendation for buying, selling, entering or exiting the stock market and cryptocurrency market. Also, all news and analyses included in the website and channels are merely republished information from official and unofficial domestic and foreign sources, and it is obvious that users of the said content are responsible for following up and ensuring the authenticity and accuracy of the materials. Therefore, while disclaiming responsibility, it is declared that the responsibility for any decision-making, action, and potential profit and loss in the capital market and cryptocurrency market lies with the trader.