
MDT
Measurable Data Token
| تریدر | نوع سیگنال | حد سود/ضرر | زمان انتشار | مشاهده پیام |
|---|---|---|---|---|
No results found. | ||||
Price Chart of Measurable Data Token
سود 3 Months :
سیگنالهای Measurable Data Token
Filter
Sort messages by
Trader Type
Time Frame

Alpha-GoldFX
MDTUSDT Forming Falling Wedge
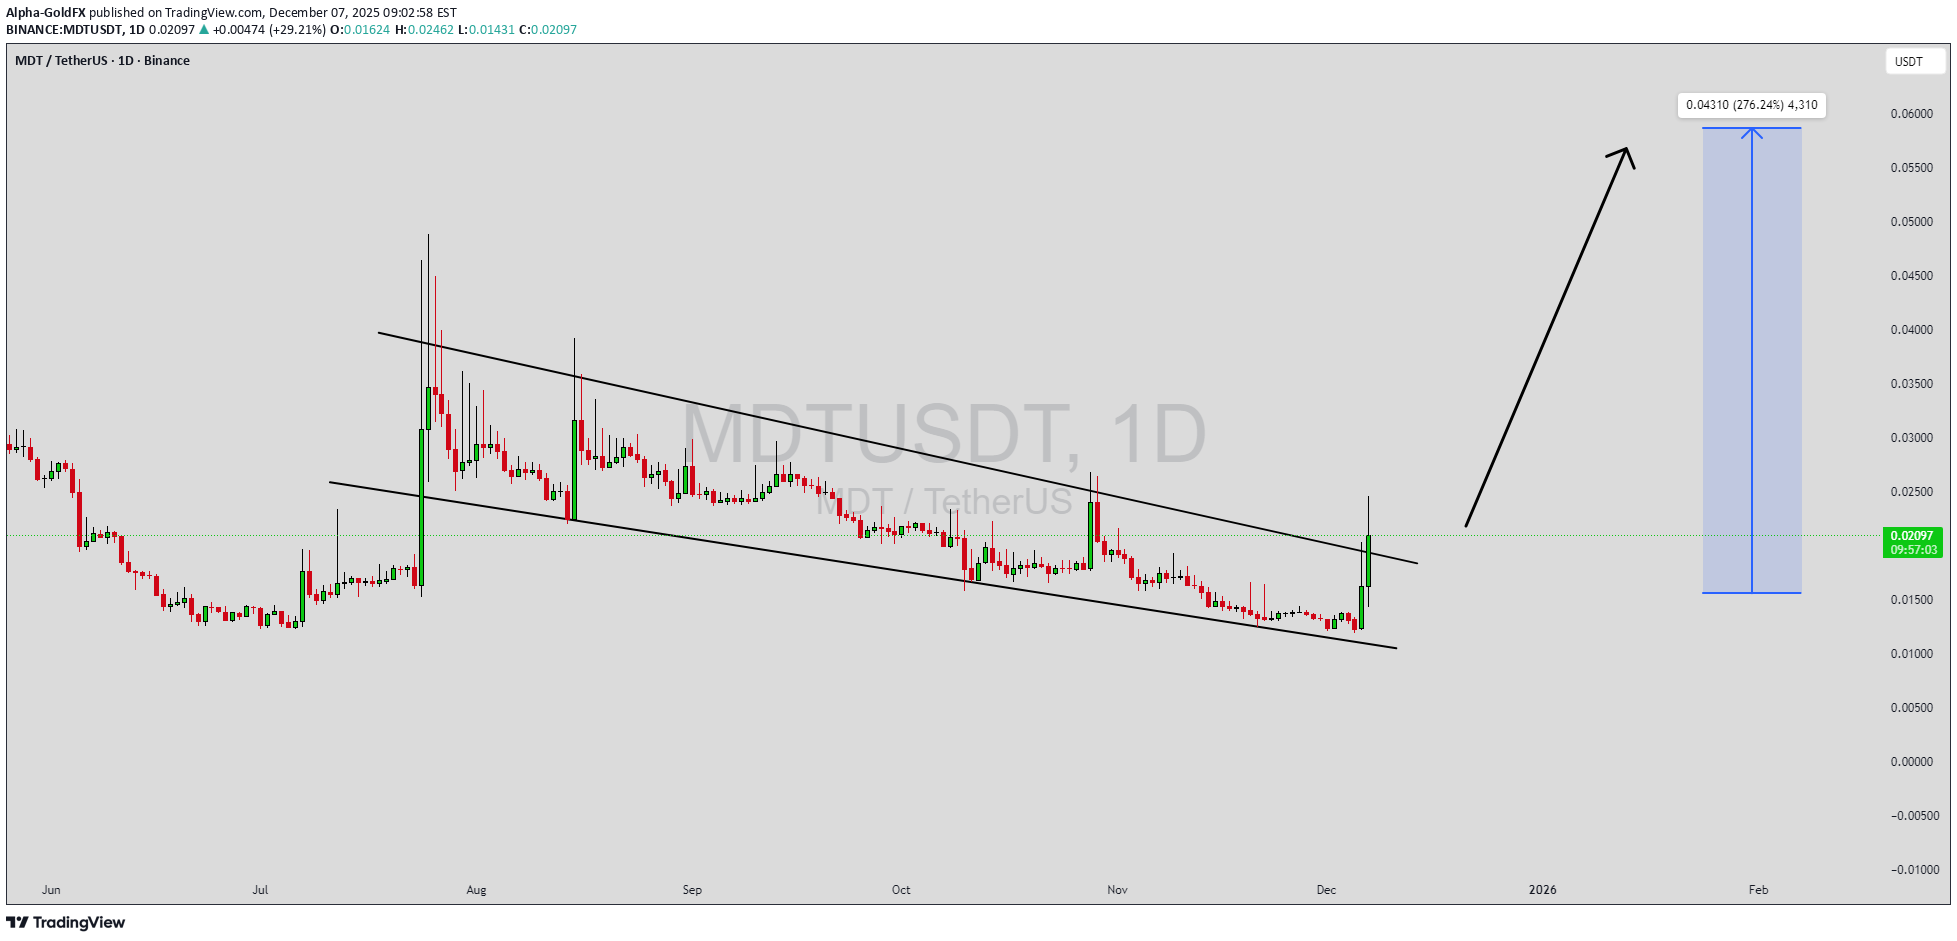
MDTUSDT is forming a clear falling wedge pattern, a classic bullish reversal signal that often indicates an upcoming breakout. The price has been consolidating within a narrowing range, suggesting that selling pressure is weakening while buyers are beginning to regain control. With consistent volume confirming accumulation at lower levels, the setup hints at a potential bullish breakout soon. The projected move could lead to an impressive gain of around 190% to 200% once the price breaks above the wedge resistance. This falling wedge pattern is typically seen at the end of downtrends or corrective phases, and it represents a potential shift in market sentiment from bearish to bullish. Traders closely watching MDTUSDT are noting the strengthening momentum as it nears a breakout zone. The good trading volume adds confidence to this pattern, showing that market participants are positioning early in anticipation of a reversal. Investors’ growing interest in MDTUSDT reflects rising confidence in the project’s long-term fundamentals and current technical strength. If the breakout confirms with sustained volume, this could mark the start of a fresh bullish leg. Traders might find this a valuable setup for medium-term gains, especially as the wedge pattern completes and buying momentum accelerates. ✅ Show your support by hitting the like button and ✅ Leaving a comment below! (What is your opinion about this Coin?) Your feedback and engagement keep me inspired to share more insightful market analysis with you!
Alpha-GoldFX
سیگنال انفجاری MDTUSDT: چنگال نزولی نویدبخش جهش 100 درصدی!
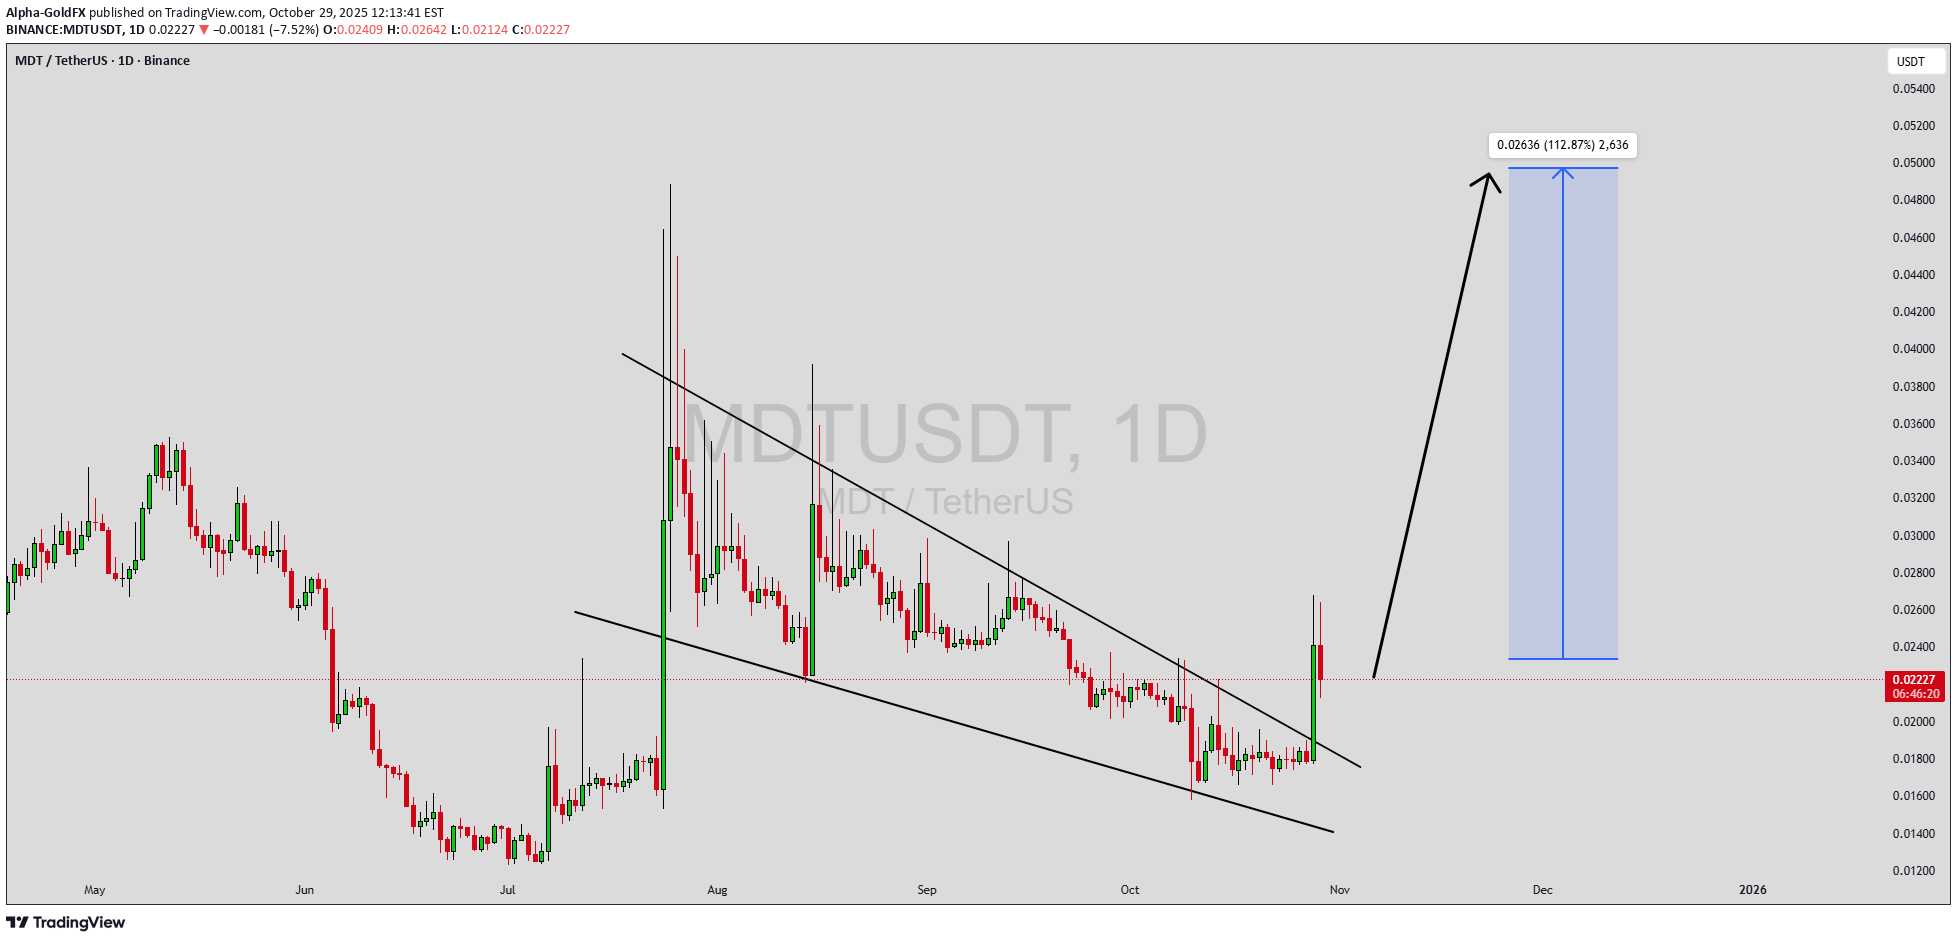
MDTUSDT is forming a strong falling wedge pattern, a bullish setup that often signals a potential reversal and the start of a major upward trend. After an extended consolidation phase, the price appears to be tightening within the wedge, suggesting that selling pressure is weakening and buyers are gradually taking control. This pattern typically precedes a powerful breakout, and with the current technical structure, MDTUSDT could be gearing up for a potential gain of 90% to 100% once the breakout confirms. The trading volume for MDTUSDT has remained consistently healthy, supporting the likelihood of a bullish move. Increased accumulation during this phase indicates that investors are positioning themselves early in anticipation of a breakout. The strong volume backing suggests that once resistance levels are breached, momentum could accelerate quickly, pushing prices to new short-term highs. Market sentiment around MDT (Measurable Data Token) has been improving, with investors showing renewed interest in its data-driven blockchain solutions. The combination of positive sentiment, strong volume, and a classic bullish reversal pattern creates a favorable setup for potential upside. Traders are closely monitoring key breakout zones that could trigger a new wave of bullish momentum and potentially initiate a longer-term uptrend. ✅ Show your support by hitting the like button and ✅ Leaving a comment below! (What is You opinion about this Coin) Your feedback and engagement keep me inspired to share more insightful market analysis with you!

The_Alchemist_Trader_
MDT Holds Key Confluence Zone, Poised for Bullish Contunation

Measurable Data Token (MDT) has surged from $0.13 support and is now testing the 0.618 Fibonacci retracement in confluence with the point of control. Holding this level is crucial for continuation. MDT’s price action has shifted decisively after a strong impulsive rally from the $0.13 daily support. The move has carried price into a critical confluence zone at the 0.618 Fibonacci and point of control. This area will define whether MDT’s bullish momentum sustains or falters. With volume printing a climactic influx, traders now await confirmation that demand will continue to back this advance. Key Technical Points: - Critical Confluence at 0.618 Fibonacci + POC: Price must hold this support cluster to sustain momentum. - Volume Spike Observed: A climatic influx signals strong demand, but sustained inflows are required. - Dynamic Resistance Breached: Market structure can fully flip bullish if higher highs and higher lows are established. Main Analysis: MDT’s breakout from $0.13 daily support was marked by an impulsive rally that shifted sentiment in favor of the bulls. The surge has since carried price toward the point of control, where it aligns with the 0.618 Fibonacci retracement and another daily support at $0.10. This triple confluence is now the defining level for continuation, as it represents both volume-based and structural strength. The volume profile has shown a strong spike, printing what can be described as a climactic note. This level of participation often signals the beginning of a larger trend shift. However, for MDT to sustain higher prices, bullish inflows must remain consistent. A one-time burst in volume without continuation can lead to exhaustion; therefore, monitoring demand at this stage is critical. Another positive development is the breach of dynamic resistance on the impulsive move. Breaking through this ceiling is a first step toward flipping broader market structure. For this shift to be confirmed, however, MDT must follow through with consecutive higher highs and higher lows, cementing the reversal from a bearish to bullish trend. If these conditions are met, the technical outlook will favor continuation into higher levels. What to Expect in the Coming Price Action: As long as MDT holds above the 0.618 Fibonacci and point of control confluence, the probability of a bullish continuation remains high. Sustained buying pressure would likely trigger another impulsive leg higher, targeting resistance zones above the current range. Failure to defend this level, however, could drag price back toward prior supports, weakening the bullish case. Conclusion: MDT’s impulsive rally from $0.13 has positioned it at a critical juncture, with support at the 0.618 Fibonacci and point of control acting as the pivot for continuation. If volume confirms and structure shifts into higher highs and higher lows, MDT is set for further bullish expansion. Losing this zone, however, would stall momentum and risk pulling the token back into consolidation.

ABU-RAYAN
كسر ترند فرعي هابط

It is also shown in the graph after breaking the down trend. The price reached the top of the trend. The next target is 0.058 if the price exceeds the required level
Alpha-GoldFX
MDTUSDT Forming Descending Triangle
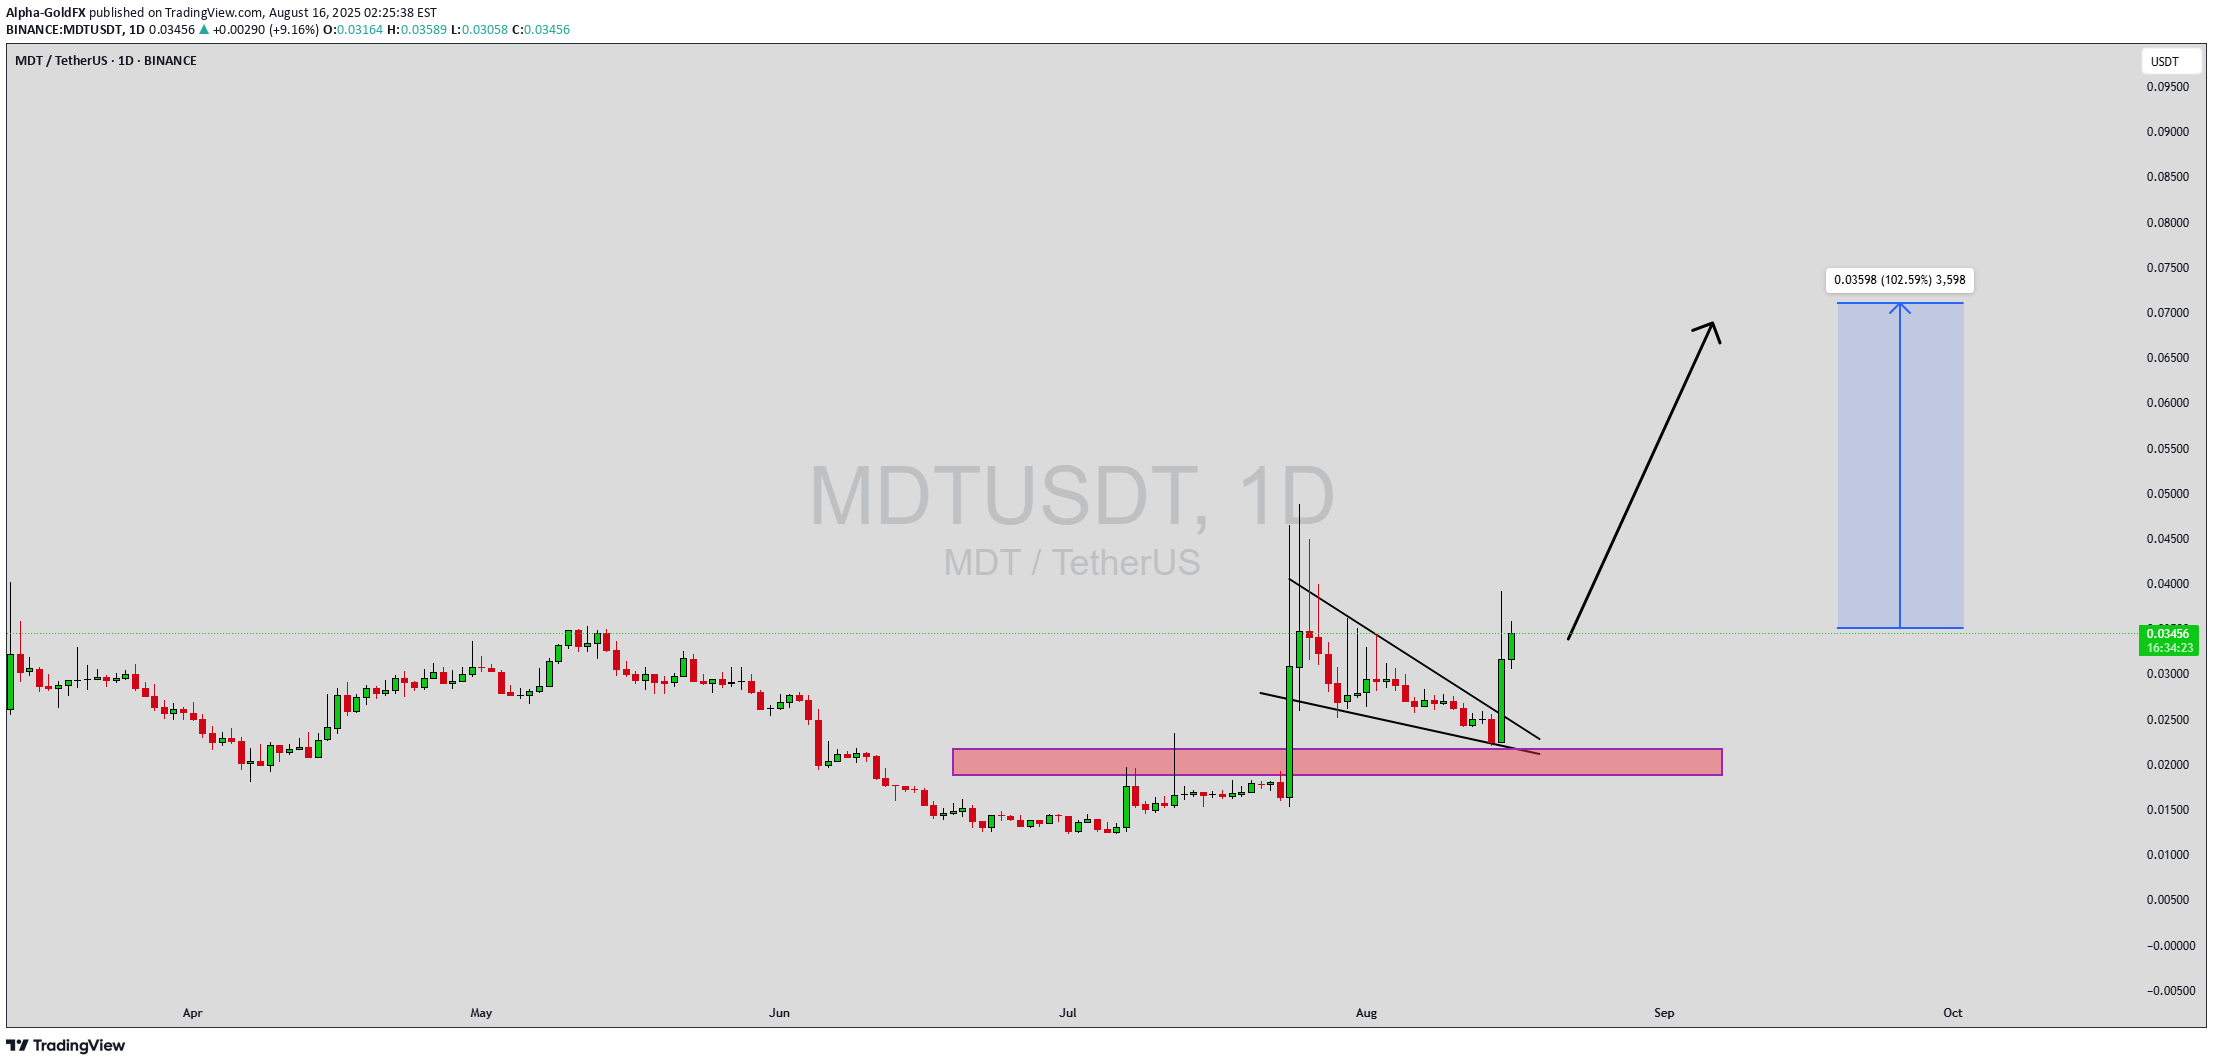
MDTUSDT is currently forming a classic descending triangle pattern, which is typically a continuation pattern suggesting potential for a strong move once a breakout occurs. The price structure is showing repeated lower highs while maintaining a relatively stable support level, indicating pressure is building up. This kind of technical setup often results in a sharp breakout if supported by increasing volume and broader market sentiment. With good volume already observed on recent candles, the chances of a bullish breakout are increasing. The descending triangle pattern has been developing over time, and the current positioning near the breakout level is promising. If MDTUSDT breaks above the resistance zone, a strong rally toward the projected 90% to 100% gain is highly probable, especially considering growing investor interest in the project. This setup aligns with key bullish trading strategies, particularly for those watching for momentum-based breakouts. Traders should keep an eye on volume spikes and candle confirmations at resistance to validate entry points. As the pattern matures, the potential for a trend reversal or breakout continuation becomes more evident, especially on higher time frames like the daily or weekly charts. ✅ Show your support by hitting the like button and ✅ Leaving a comment below! (What is You opinion about this Coin) Your feedback and engagement keep me inspired to share more insightful market analysis with you!

MDTUSDT
I only publish this to show when every one on yester day wad hopeless i said be calm and groth will start soon😉😉

Crypto_alphabit
MDT (SPOT)
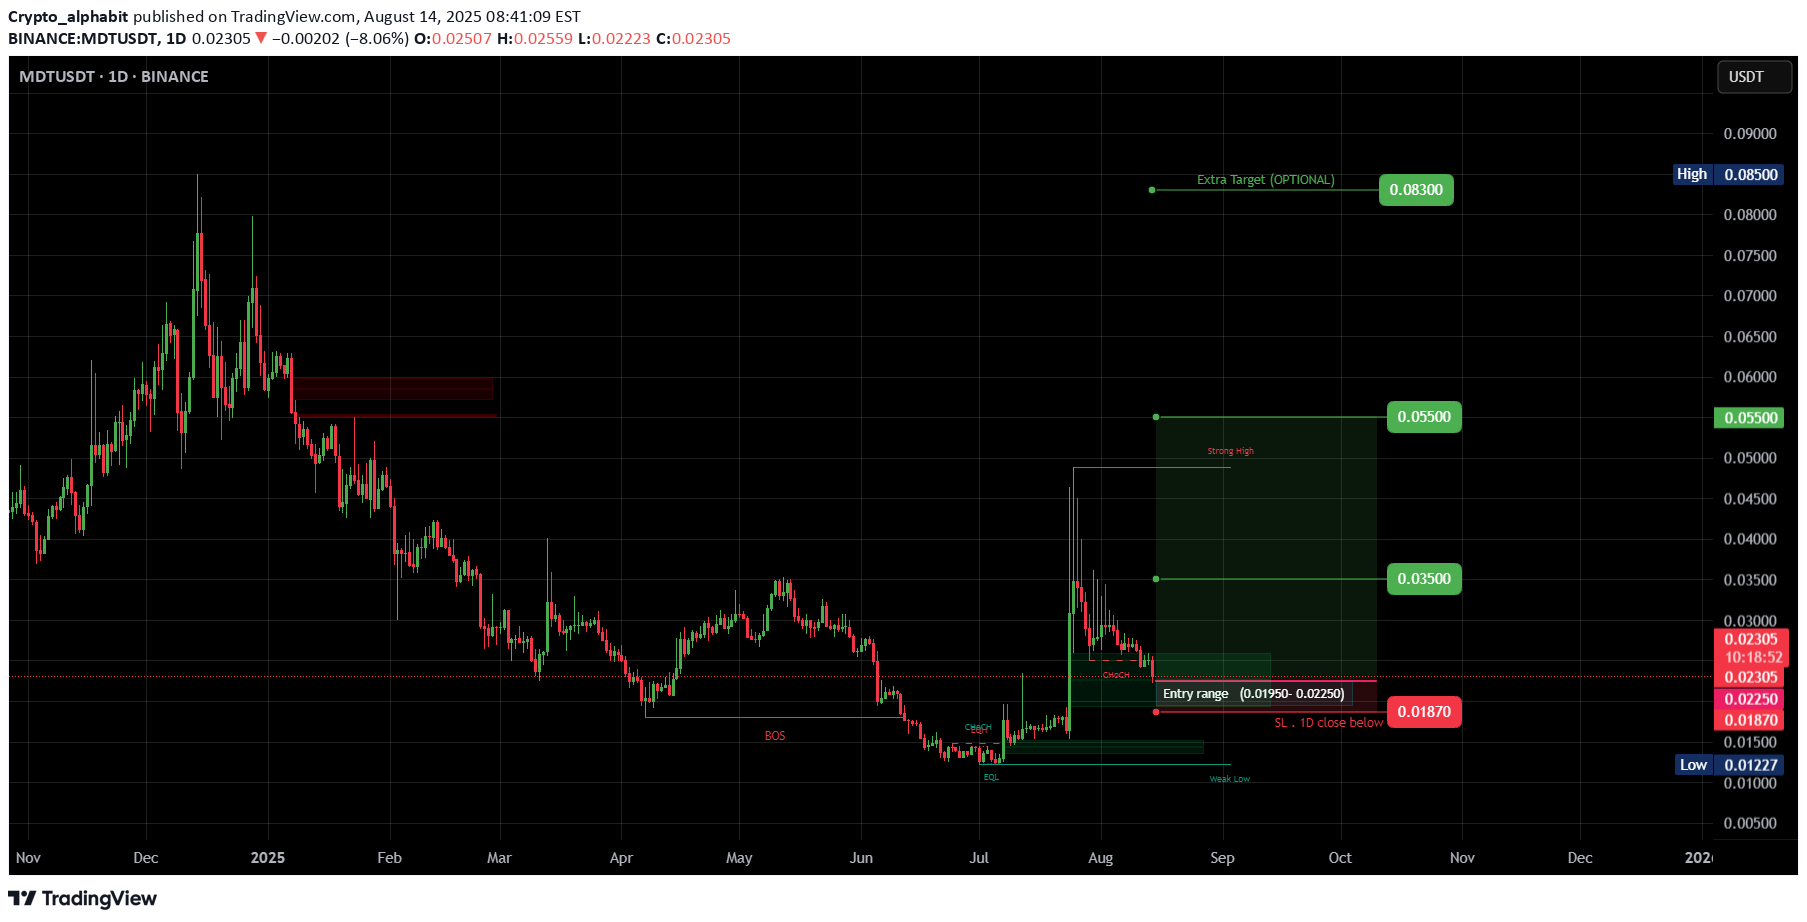
MDTUSDT #MDT/ USDT Entry range (0.01950- 0.02250) SL 1D close below 0.01870 T1 0.03500 T2 0.05500 _______________________________________________________ Golden Advices. ******************** * collect the coin slowly in the entry range. * Please calculate your losses before the entry. * Do not enter any trade you find it not suitable for you. * No FOMO - No Rush , it is a long journey.

Wolftrader1337
MDT / Usdt

MDTUSDT Just do it. Need to hold that area or we will ......... Disclaimer : Not Financial advice
Alpha-GoldFX
MDTUSDT Forming Bullish Wave

MDTUSDT is currently forming a bullish wave pattern, indicating a strong potential for continued upward momentum. This wave structure reflects healthy market cycles, with higher highs and higher lows suggesting that bulls are steadily gaining control. As this wave pattern matures, the current market setup hints at a possible breakout, which could push prices significantly higher in the near term. The volume backing MDTUSDT is robust, which provides a solid confirmation for the ongoing trend. Good volume during the accumulation and breakout phases is essential for sustaining a bullish wave. If the pair maintains its current buying pressure, traders could expect a strong rally, with a projected gain between 90% to 100% based on historical wave completions and resistance breakouts. Investors and traders have started showing increasing interest in MDT, further validating its bullish potential. This growing attention not only boosts market confidence but also contributes to stronger liquidity, which is critical for smooth and sustained upward movement. Technical traders watching for confirmation of the next wave will likely key in on breakout zones and RSI/volume confluences. In summary, MDTUSDT is showing signs of entering a powerful bullish continuation phase, supported by strong volume and increasing market interest. As the wave structure plays out, this pair could offer an excellent opportunity for swing traders aiming for mid-to-high double-digit returns. ✅ Show your support by hitting the like button and ✅ Leaving a comment below! (What is You opinion about this Coin) Your feedback and engagement keep me inspired to share more insightful market analysis with you!
Disclaimer
Any content and materials included in Sahmeto's website and official communication channels are a compilation of personal opinions and analyses and are not binding. They do not constitute any recommendation for buying, selling, entering or exiting the stock market and cryptocurrency market. Also, all news and analyses included in the website and channels are merely republished information from official and unofficial domestic and foreign sources, and it is obvious that users of the said content are responsible for following up and ensuring the authenticity and accuracy of the materials. Therefore, while disclaiming responsibility, it is declared that the responsibility for any decision-making, action, and potential profit and loss in the capital market and cryptocurrency market lies with the trader.