
ABU-RAYAN
@t_ABU-RAYAN

What symbols does the trader recommend buying?
Purchase History
پیام های تریدر
Filter
ABU-RAYAN
الذهب قناة صاعدة

Technical Summary (XAUUSD) Current situation: Price (4,463) is moving within an ascending channel. Bullish scenario: A breach of 4,772 opens the way towards the historical target at 6,200 Bearish scenario: Breaking the support level 4,183 means a negative shift targeting the 3,450 area Conclusion: The general trend is bullish as long as the price is above 4,253
ABU-RAYAN
تحديث للبتكوين على الفاصل اليومي

Current general trend: The bearish trend is still dominant in the short and medium term, as the chart shows a series of lower highs and lower lows. There are no real reversal signals at the moment, as the price needs to overcome the last falling peak and build a higher price base for the momentum to shift Breaking it may open the door to further decline.
ABU-RAYAN
بیت کوین در آستانه انفجار؟ تحلیل الگوی "سر و شانه معکوس" و اهداف قیمتی!

📊Technical Analysis Bitcoin / USD Time frame: 4 hours General situation: Possible reversal pattern (in formation) The pattern is an inverted head and shoulders Model components Left shoulder Formed after a first downward wave with a moderate bounce Head A deeper bottom represents the peak of selling pressure followed by a strong rebound Right shoulder A bottom higher than the peak is an initial indication of a decline in the strength of sellers Neckline It is located at the 90,000 area It represents a strong supply area and pivotal resistance The price is currently trading below the neckline Price base Coherence range 86000 It represents structural support And a potential assembly area Breaking it temporarily invalidates the reversal scenario Activation condition A clear breakout of the neckline near 90,000 Noticeable increase in trading volumes Without that form it is not valid for trading Technical target after confirmation Measure the distance between the head and the neck line After hacking 96500 Technical summary The reversal pattern is possible but uncertain Positivity only begins after penetrating the neck in large quantities Pre-trading before confirmation is high risk The current scenario is watch, not rush
ABU-RAYAN
بیت کوین در آستانه انفجار؟ الگوی سر و شانه معکوس و سطح حیاتی ۹۰,۰۰۰ دلار

🔄 The model is an inverted head and shoulders 🧩 Model components: Left shoulder: Formed after a first downward wave with a moderate retracement. Head: A deeper low represents the peak of selling pressure, followed by a strong bounce. Right shoulder: Bottom higher than head → initial signal of declining seller strength. 📐 Neckline Located at the area: 90,000 Represents a strong supply/pivot resistance area The price is currently trading below the neckline 🧱 Price base Coherence range 86,000 This area represents: Structured support Potential assembly area Breaking it temporarily invalidates the reversal scenario ✅ Condition (activation) 1. Clear breakout of the neckline (≈ 90,000) 2. A significant increase in trading volumes (Volume Expansion) Without this: ❌ The model is not valid for trading 🎯 Technical target after confirmation Measure the distance between the head and the neck line After the breakout: 96,500 🟢 Technical summary The reversal pattern is possible but not confirmed Positivity begins only after penetrating the neck in quantities Pre-trading before confirmation = high risk Current scenario: Wait, not rush
ABU-RAYAN
البتكوين من جرف… إلى دحديرة

The technical scene is still dark red, and the picture is clear: complete selling control with repeated failure of any rebound attempt. Brief technical reading: Failure of corrective channels: Every bounce within an ascending channel ends with a violent break down → The rise is just a liquidity trap. A very bearish structure: successive lower highs, and broken supports turned into solid resistances. Current situation: The price is near 87,292 and on the edge of the last channel; Breaking current support opens the door to lower levels. Conclusion: ❌ No positive signals (no price reversal or divergence). The downward trend will continue until the opposite is proven by breaching 90,000 and holding above it. Advice: 📌 Patience and risk management... Entering now is an adventure awaiting clarity of vision.
ABU-RAYAN
آزمون طلایی: آیا طلا از قله تاریخی عبور میکند یا سقوط میکند؟

Current status Gold now stands at a crucial stage to prove the credibility of the breakout above the $4,380 level on the daily interval. We are waiting for confirmation of the continuation or a return to gain momentum. 📈 Bullish scenario (breakout confirmation) The stability of the price by closing a real daily candle above $4,381 opens the door to the following targets: 🎯 First goal: $4,513 🎯 Second goal: $4,683 🎯 Maximum goal: $4,772 📉 Correction scenario (price attraction) In the event of failure to “prove credibility” and a decline, it is expected to head towards the price attraction zone of the bottom of the historical peak between: 📍$4,185 — $4,249 (repositioning area) 🛡️ Risk engineering Confirmatory entry: based on the explicit daily close. Stop Loss (SL): Daily close below $4,185 ⚠️ Al Qaeda There is no rush before confirming, as stability above the top is the real fuel for historical targets #Gold #GoldAnalysis #Trading #XAUUSD #ProvingCredibility
ABU-RAYAN
تحلیل فنی بیت کوین: سطوح حیاتی حمایت و مقاومت؛ آیا ریزش ادامه دارد؟

📉 General trend: Bitcoin is moving within a clear bearish path on the daily interval below the 200-day average, while continuing to record bearish peaks and troughs, which enhances the short- and medium-term negative outlook. 💧 Liquidity and support areas: The likely scenario remains a decline towards the pivotal liquidity areas between 76 الف and 70 الف, which are areas of interest for major investors and may witness an important price interaction. ⚠️ Signals of conditional positivity: Technical positive features begin only when 95 الف is breached and stability is above it, but it remains a preliminary signal that is not sufficient to confirm a complete reversal. 🚀 Confirmation of the real reversal: The 108 الف area remains the critical level to confirm the price reversal, the return of momentum, and the market’s risk appetite. 🧠 Conclusion: Until a clear and sustainable breakthrough is achieved above the critical levels, caution remains the master of the situation, and risk management and adherence to the technical plan remain essential at this stage.
ABU-RAYAN
بیت کوین در آستانه انفجار: منتظر شکست خط مقاومت حیاتی!
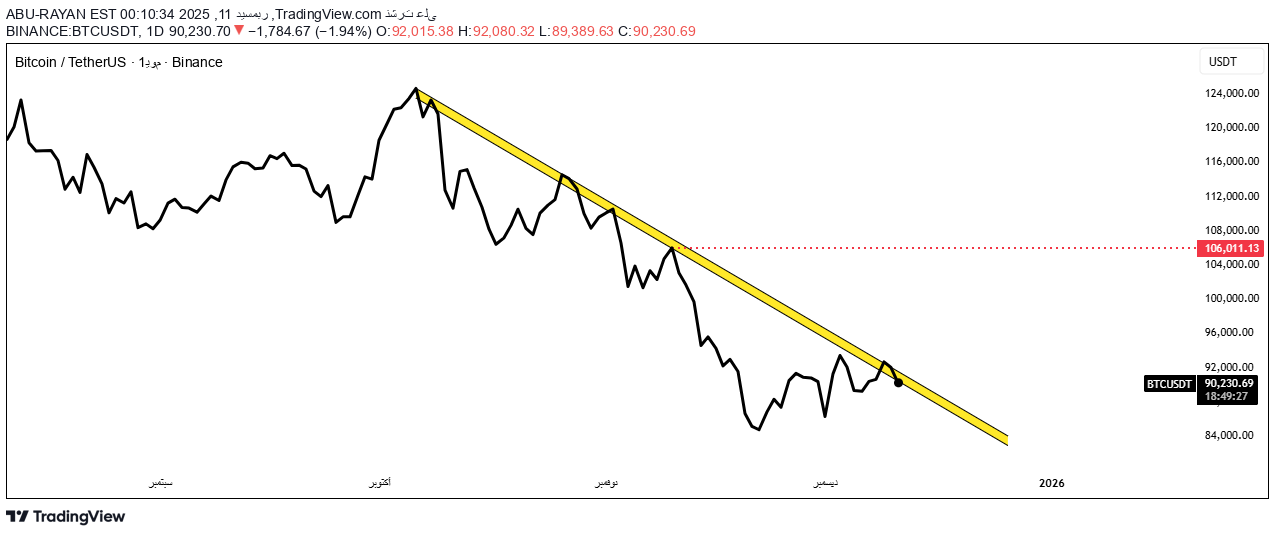
The chart shows a major downtrend extending from the September high all the way into December Consecutive lower peaks that precisely respect the trend line. This type of trend usually reflects a medium-term corrective wave within the larger Bitcoin trend. Most important technical notes: Full respect to the downtrend The price touched the trend line more than 3 times, and this enhances the strength of the trend line and makes its breakout in the future very significant. The price is currently at the last touch point The presence of the price near the descending line in this way indicates two possibilities: The beginning of a weakness in selling momentum. Or prepare for a final test before a breakthrough occurs. Critical Zone The 106,000 level is considered the pivotal resistance, and it is the level that will turn the trend from bearish to bullish if it is breached with a clear daily close. Exactly what we are waiting for now An actual breakout of the trend and not just the tail of a candle. Close above the last seam area to confirm the change in trend. Trading volume that supports the breakout (Volume Confirmation). What does that mean for the price? If the trend is broken: The first goal is for the price to return to the 96,000-100,000 area. The second goal is to target the main resistance 106,000. Breaking 106k means a complete change in price behavior and Bitcoin entering a new bullish wave. If the penetration fails: We may see a retest of the 86,000-84,000 support before a new attempt
ABU-RAYAN
بیت کوین: راز حفظ تعادل و صعود قدرتمند در مسیر فیبوناچی!
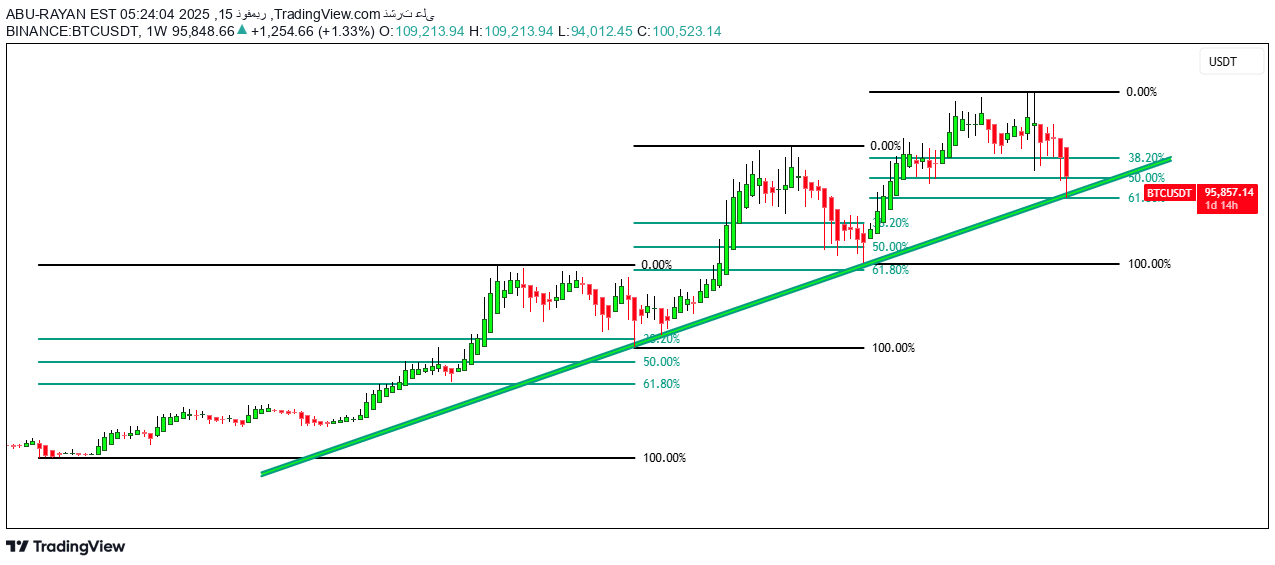
Bitcoin continues to move within a strong upward trend supported by disciplined wave behavior, as all corrections respected the 61.8% Fibonacci level without breaking it, which reflects the strength of the trend and the stability of buyers’ momentum. The price also maintained the ascending trend line without recording any real break, which enhances the continuity of the technical structure and confirms that the current movement is still within a healthy and orderly path. Conclusion: As long as the price remains above the 61.8% levels of the last wave and while continuing to respect the trend line, the way remains paved for retesting the previous peak, with the possibility of opening the way towards higher peaks.
ABU-RAYAN
النموذج النادر "البوق": مفتاح اكتشاف الموجات السعرية الجديدة للبيتكوين!

Disclaimer
Any content and materials included in Sahmeto's website and official communication channels are a compilation of personal opinions and analyses and are not binding. They do not constitute any recommendation for buying, selling, entering or exiting the stock market and cryptocurrency market. Also, all news and analyses included in the website and channels are merely republished information from official and unofficial domestic and foreign sources, and it is obvious that users of the said content are responsible for following up and ensuring the authenticity and accuracy of the materials. Therefore, while disclaiming responsibility, it is declared that the responsibility for any decision-making, action, and potential profit and loss in the capital market and cryptocurrency market lies with the trader.