
MASK
Mask Network
| تریدر | نوع سیگنال | حد سود/ضرر | زمان انتشار | مشاهده پیام |
|---|---|---|---|---|
No results found. | ||||
Price Chart of Mask Network
سود 3 Months :
سیگنالهای Mask Network
Filter
Sort messages by
Trader Type
Time Frame

Kapitalist01
یادداشت شخصی: سرمایهگذاری ممنوع، آموزش محض! (هشدار: این توصیه خرید و فروش نیست)
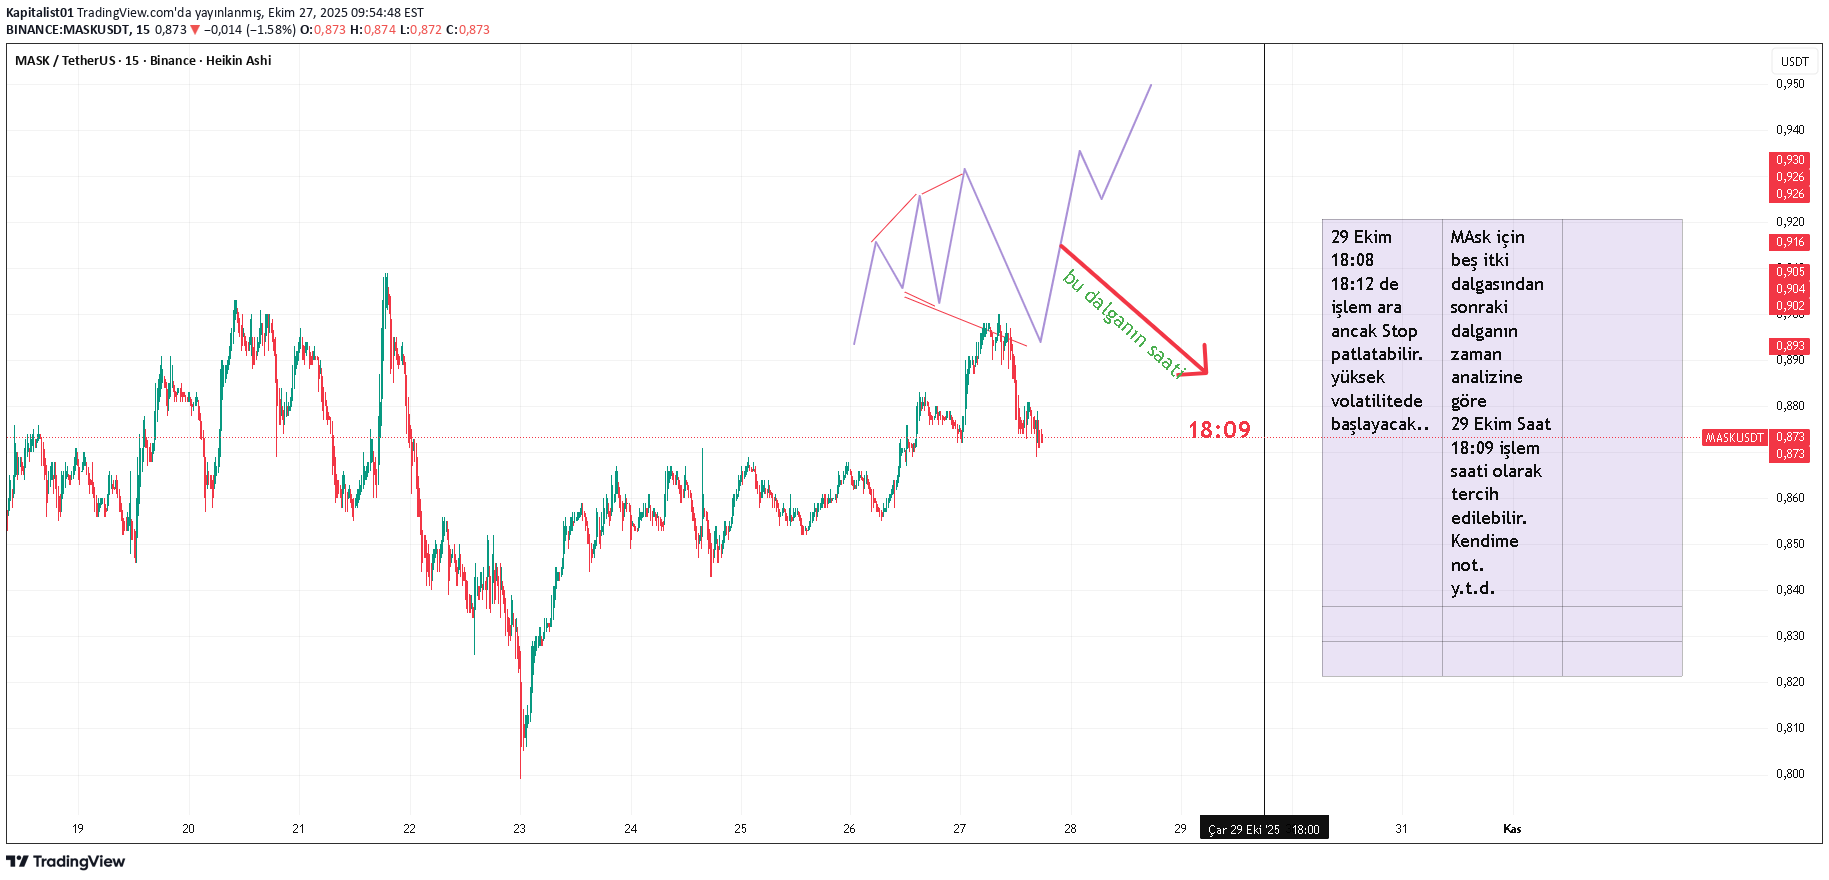
Note to self. It is not investment advice. is for working purposes. It is not a buy or sell tut recommendation.

Cryptojobs
آماده پرواز: شکست صعودی MASK در چند قدمی!
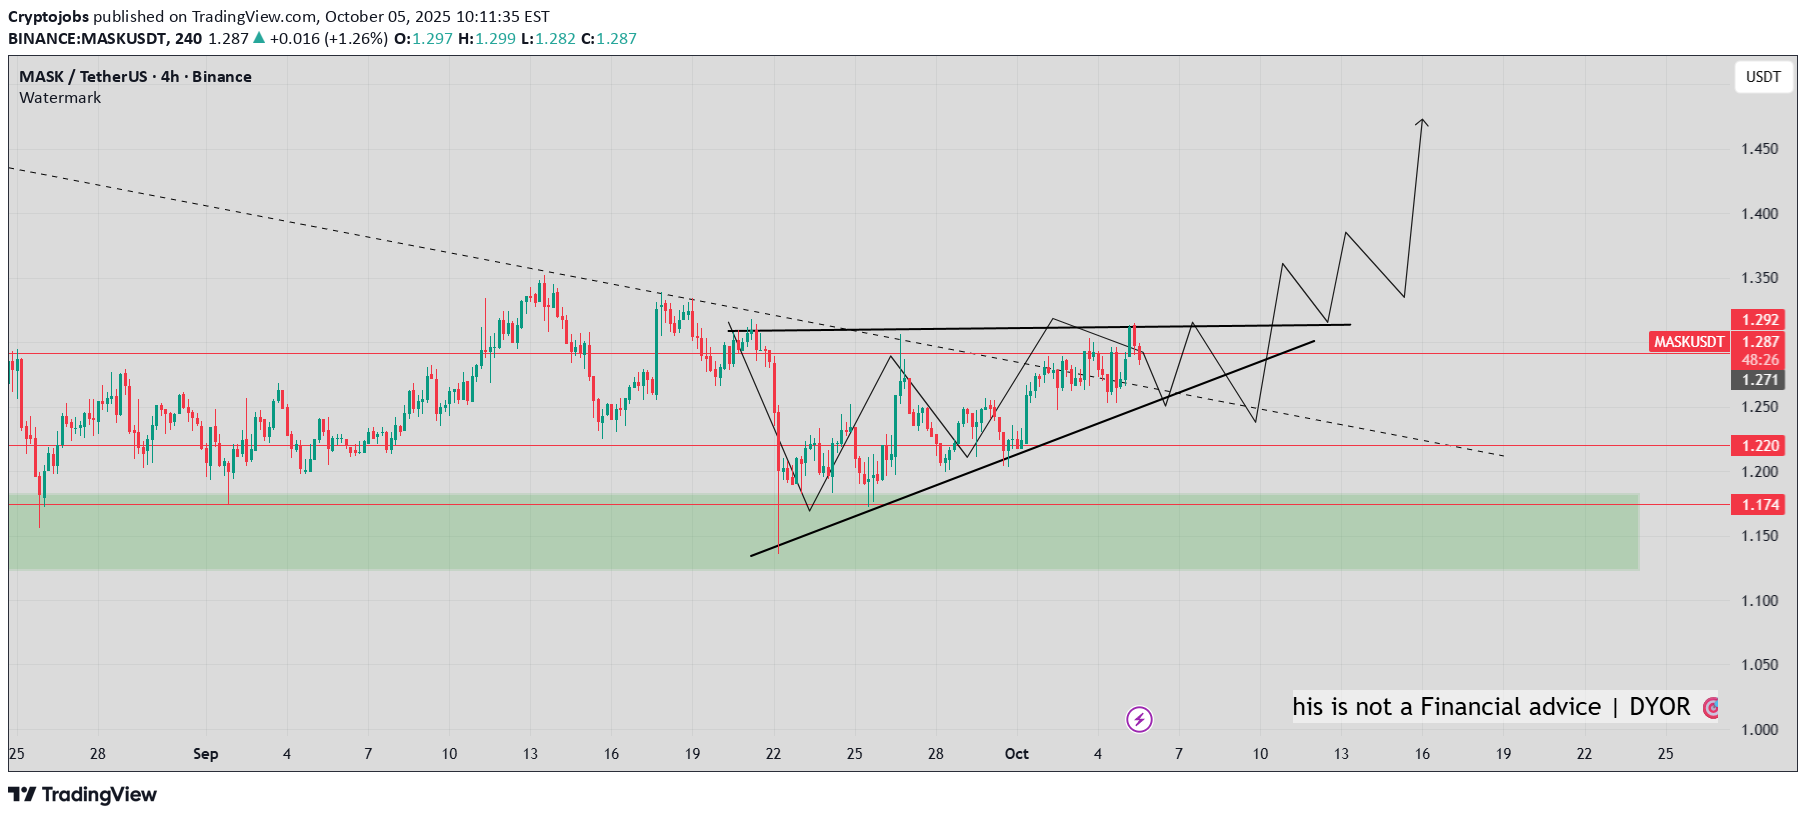
MASK - bullish setup - long term accumulation 📈 Prices looks set to fly. Matters of days 🚀, or weeks? 110 days accumulation above green zone. I see a nice ascending channel above the uptrend. Shakout and bearll trap possible if we grab liquidities around 1.250 - 1.240$ demand zone. [POC point Also] 1.400$ + next🎯 1.510 🎯 1.600$ 🎯

Bithereum_io
MASKUSDT 1D
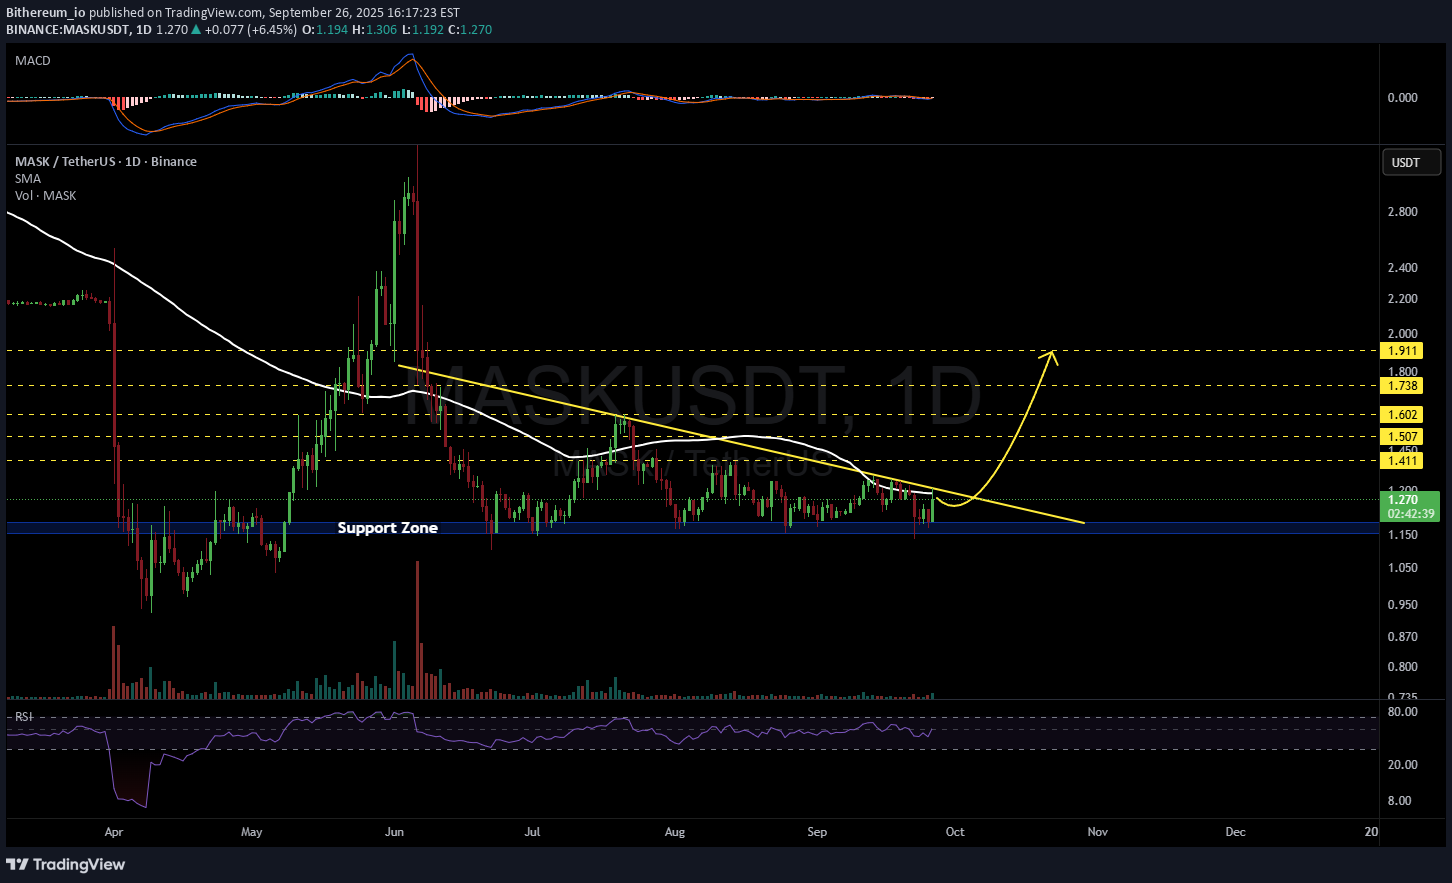
#MASK is moving inside a descending triangle pattern on the daily timeframe. It is currently facing the triangle resistance and the daily SMA100. In case of a breakout above both, the potential targets are: 🎯 $1.411 🎯 $1.507 🎯 $1.602 🎯 $1.738 🎯 $1.911 ⚠️ Always remember to use a tight stop-loss and follow proper risk management.

CryptoNuclear
MASK/USDT — Testing Big Support! Big Rebound or Major Breakdown?
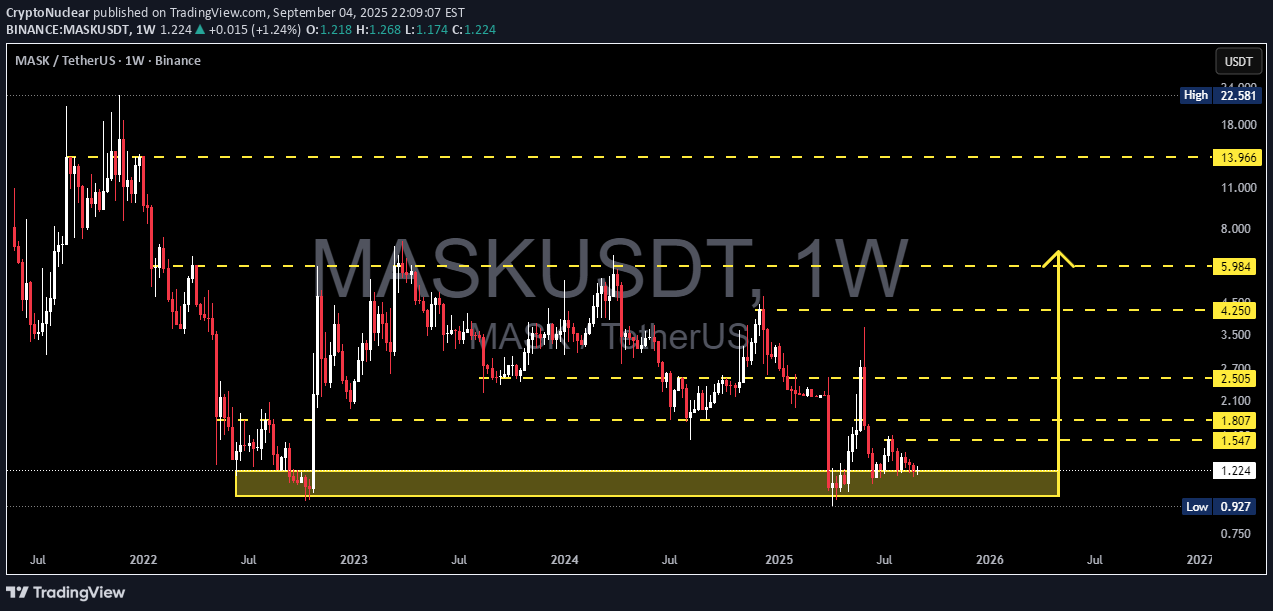
🔎 Overall Analysis MASK is once again testing the historical support zone at 0.93 – 1.22 USDT (yellow box), an area that has repeatedly acted as a demand zone since 2022. Each time price revisited this region, it sparked strong rebounds. However, the long-term structure remains bearish with a clear pattern of lower highs. This means that while support is strong, the broader trend is still downward unless we see a confirmed structural shift. In short, MASK is now at a critical turning point: will this zone serve as a springboard for another rally, or will it finally give way and open the door for deeper downside? --- 📊 Key Technical Levels Main Support Zone: 0.93 – 1.22 (yellow box). Nearest Resistances: 1.547 1.807 2.505 4.250 5.984 13.966 (major resistance before ATH). All-Time High: 22.58 --- 🟢 Bullish Scenario If MASK can hold above 1.22 and confirm a weekly close above 1.55–1.80, upside momentum may return. Short-term target: 1.807. Mid-term target: 2.505. Long-term potential: 4.250 – 5.984 if a strong breakout occurs. Bullish factors: 1. Historical demand zone (yellow box) has triggered multiple rebounds. 2. Noticeable volume spikes when price tests this support → sign of buyer interest. 3. Possible double bottom / accumulation base formation if price holds the zone. --- 🔴 Bearish Scenario If MASK closes below 0.93 on the weekly chart, this support zone would break, signaling a strong bearish continuation. The next downside levels are unclear (no major historical support below), leaving room for a capitulation move. The bearish trend of lower highs would be further reinforced. Bearish factors: 1. Larger trend remains down. 2. Every rally so far has ended with sharp rejections. 3. Weak buying momentum during upswings. --- 🧩 Chart Pattern Insights Current price action shows consolidation within a demand zone — trapped between strong demand (0.93–1.22) and supply (1.55–1.80). Repeated liquidity grabs / false breakouts (long wicks) suggest whales accumulating liquidity. A strong base here could mark the beginning of a larger reversal — but without confirmation, it may also be distribution before a breakdown. --- 📌 Conclusion & Strategy MASK is now at one of its most critical support levels in years. As long as 0.93–1.22 holds, chances for a rebound remain. Bullish confirmation requires a strong weekly close above 1.80. A breakdown below 0.93 would open the door for further downside and potential capitulation. 👉 Best approach: wait for confirmation before committing heavily. Aggressive traders may consider small entries near support with a tight stop below 0.93. --- #MASKUSDT #MASK #CryptoAnalysis #SupportResistance #WeeklyChart #TechnicalAnalysis #Altcoins #SwingTrading #CryptoCommunity

CompoundingGain
$mask

reclaiming 50 ema on D1 assuming we may wick below before weekly close but recon we good for $3plus quickish rsi popping up dominance nuking

Skill-Knowledge-Conduct
MASK_ Network _ Q3_ Forecast
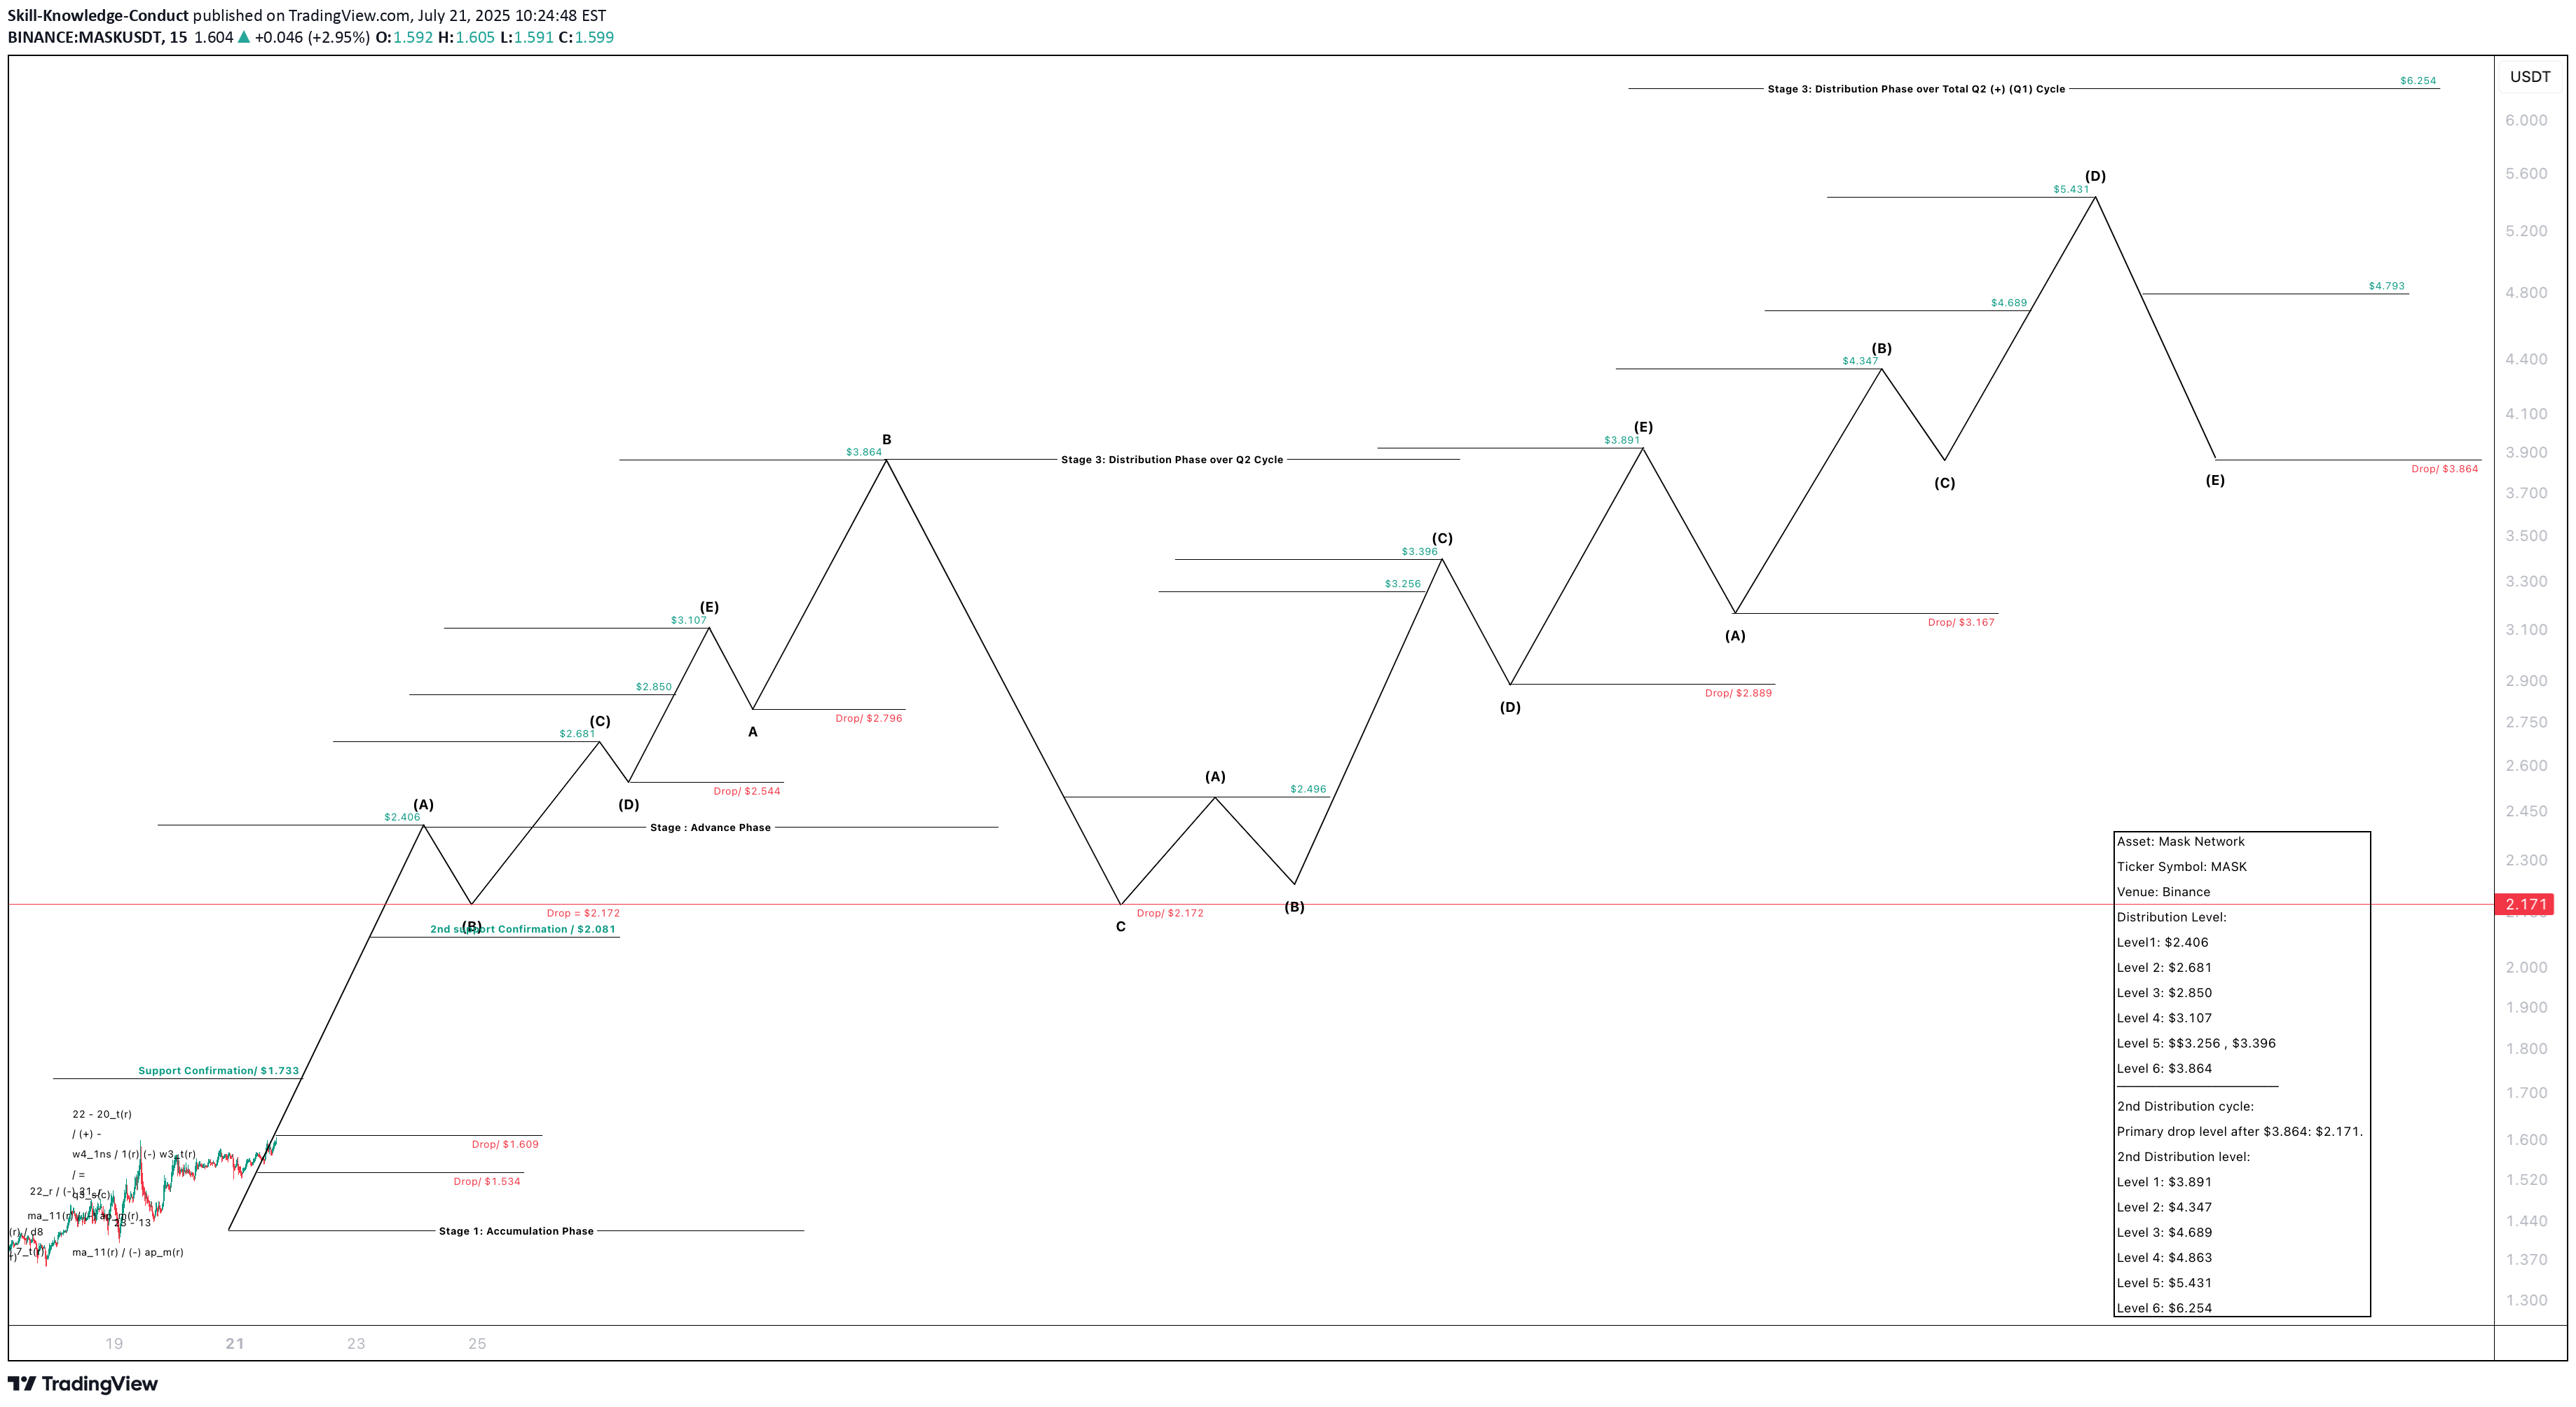
Asset: Mask Network Ticker Symbol: MASK Venue: Binance Distribution Level: Level1: $2.406 Level 2: $2.681 Level 3: $2.850 Level 4: $3.107 Level 5: $$3.256 , $3.396 Level 6: $3.864 _______________________ 2nd Distribution cycle: Primary drop level after $3.864: $2.171. 2nd Distribution level: Level 1: $3.891 Level 2: $4.347 Level 3: $4.689 Level 4: $4.863 Level 5: $5.431 Level 6: $6.254
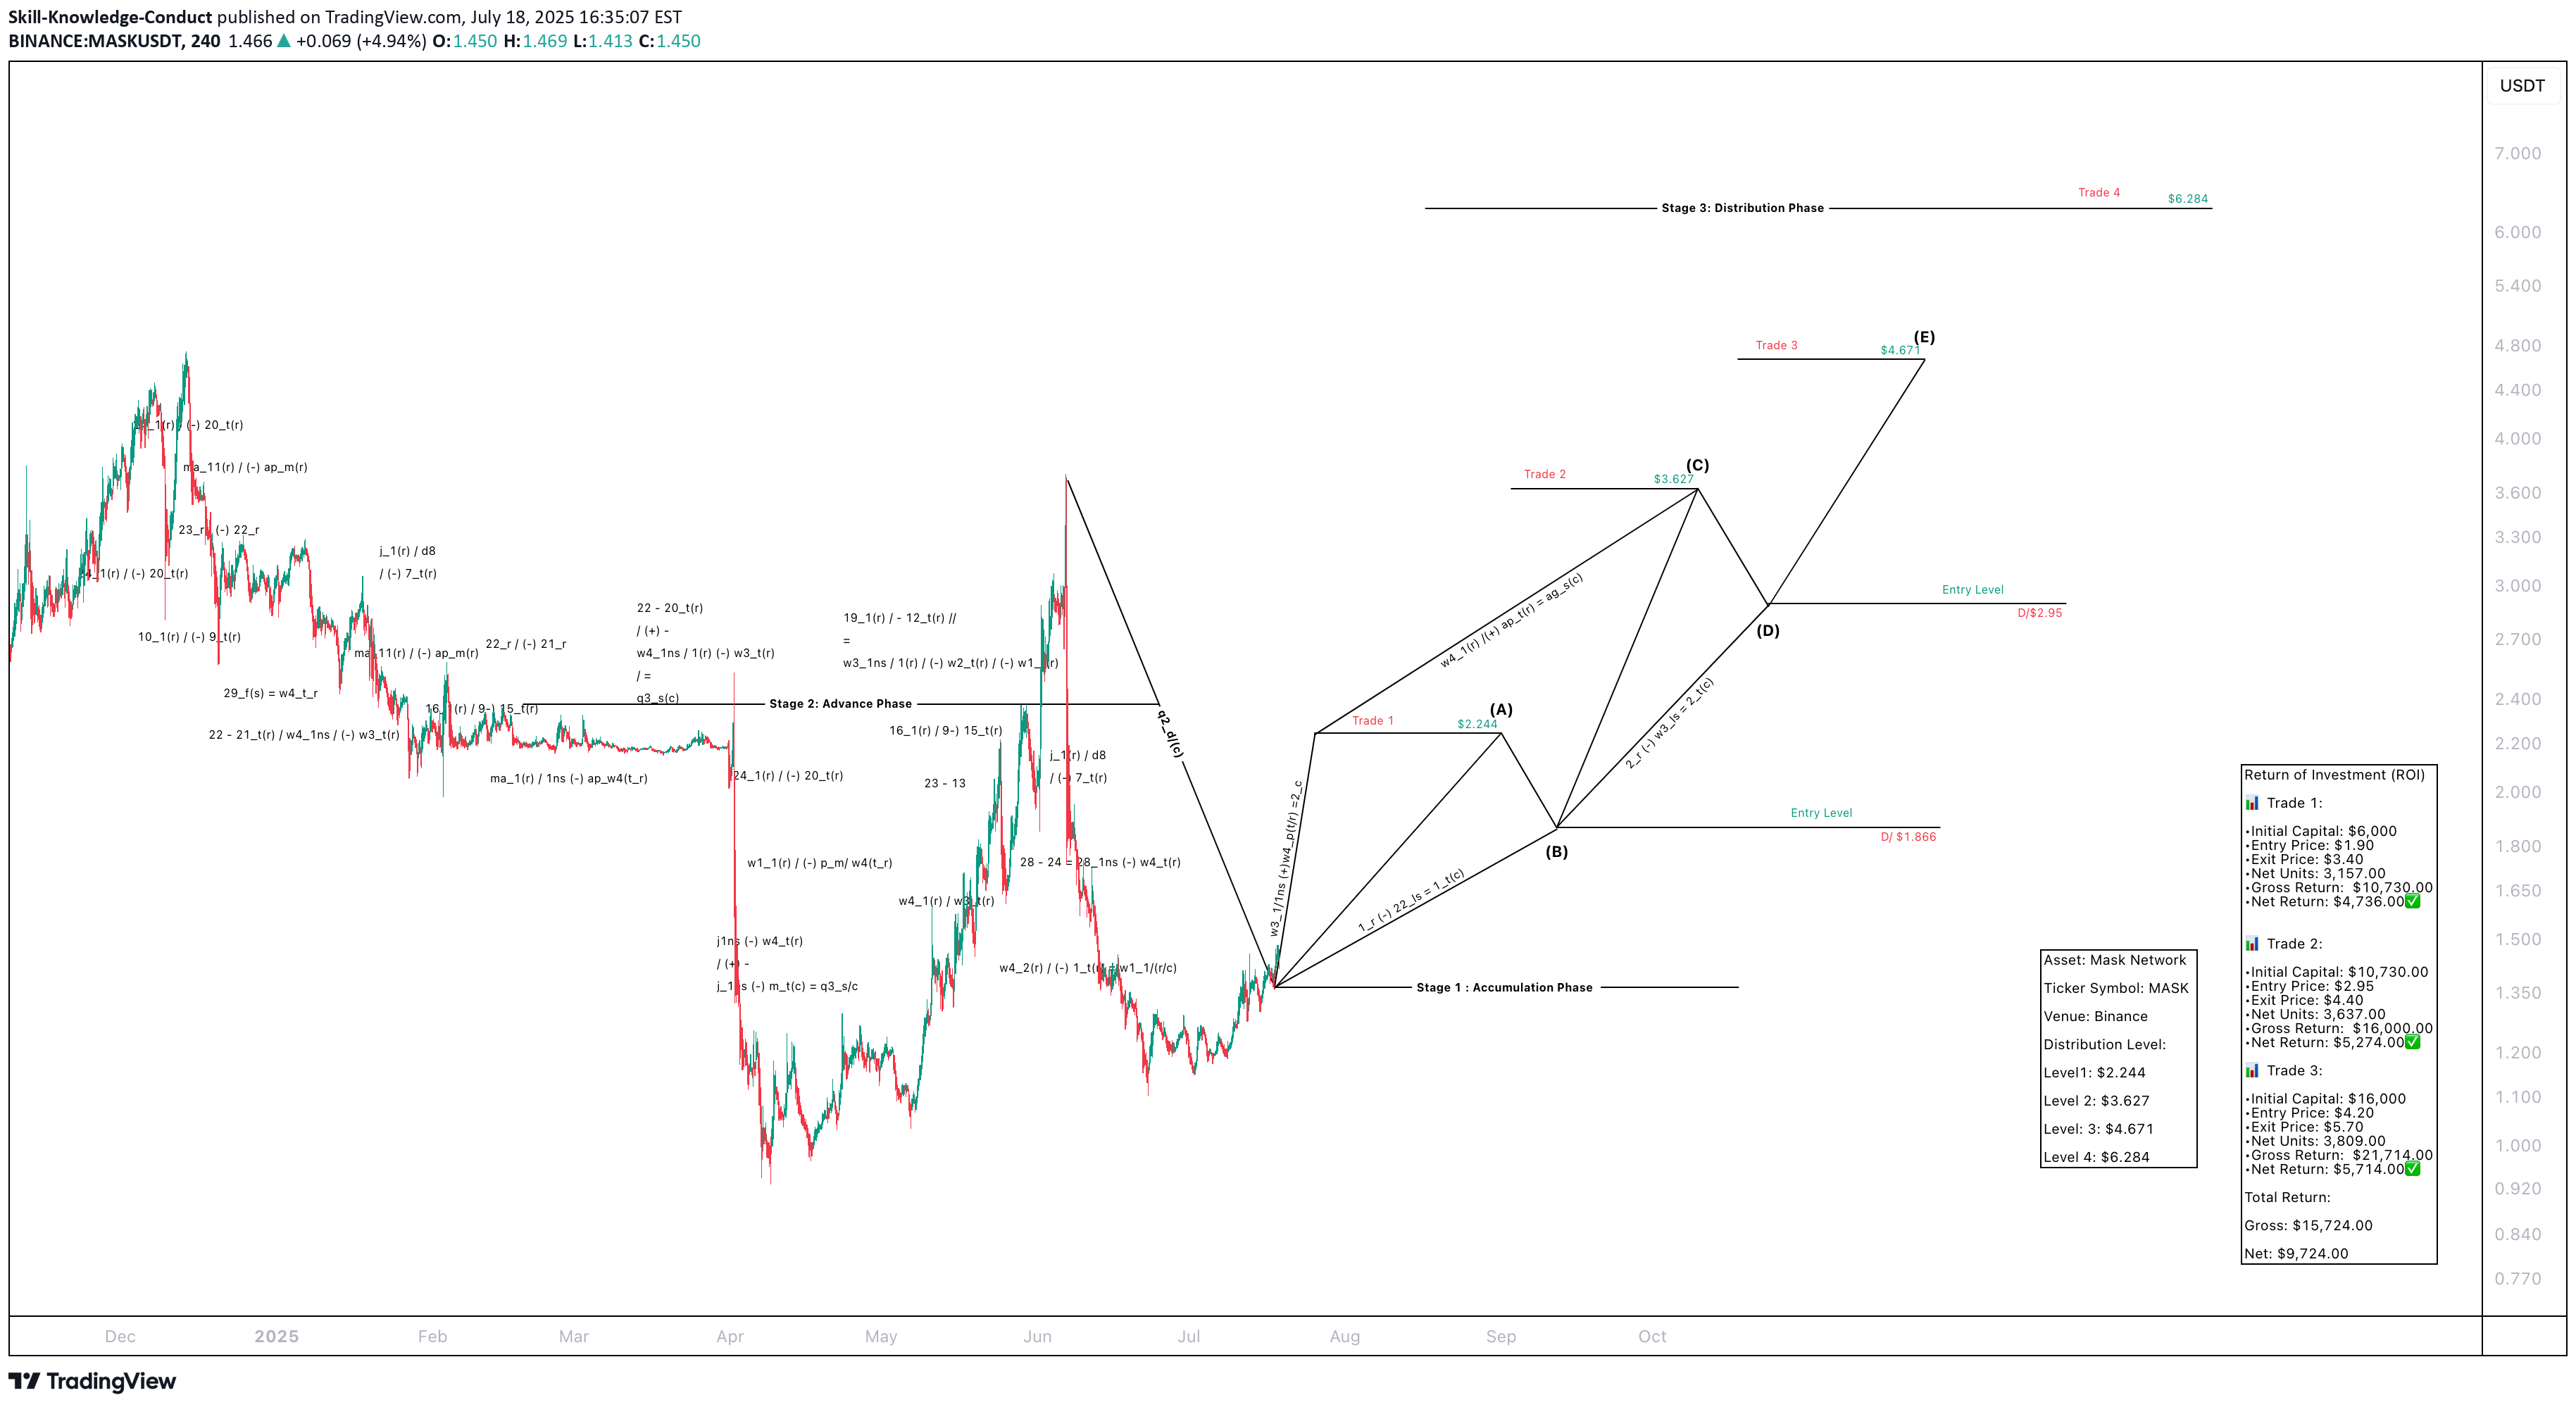
Skill-Knowledge-Conduct
Mask _ Network _ Forecast

Strength_in_numbers
MASK getting ready to pop... again?
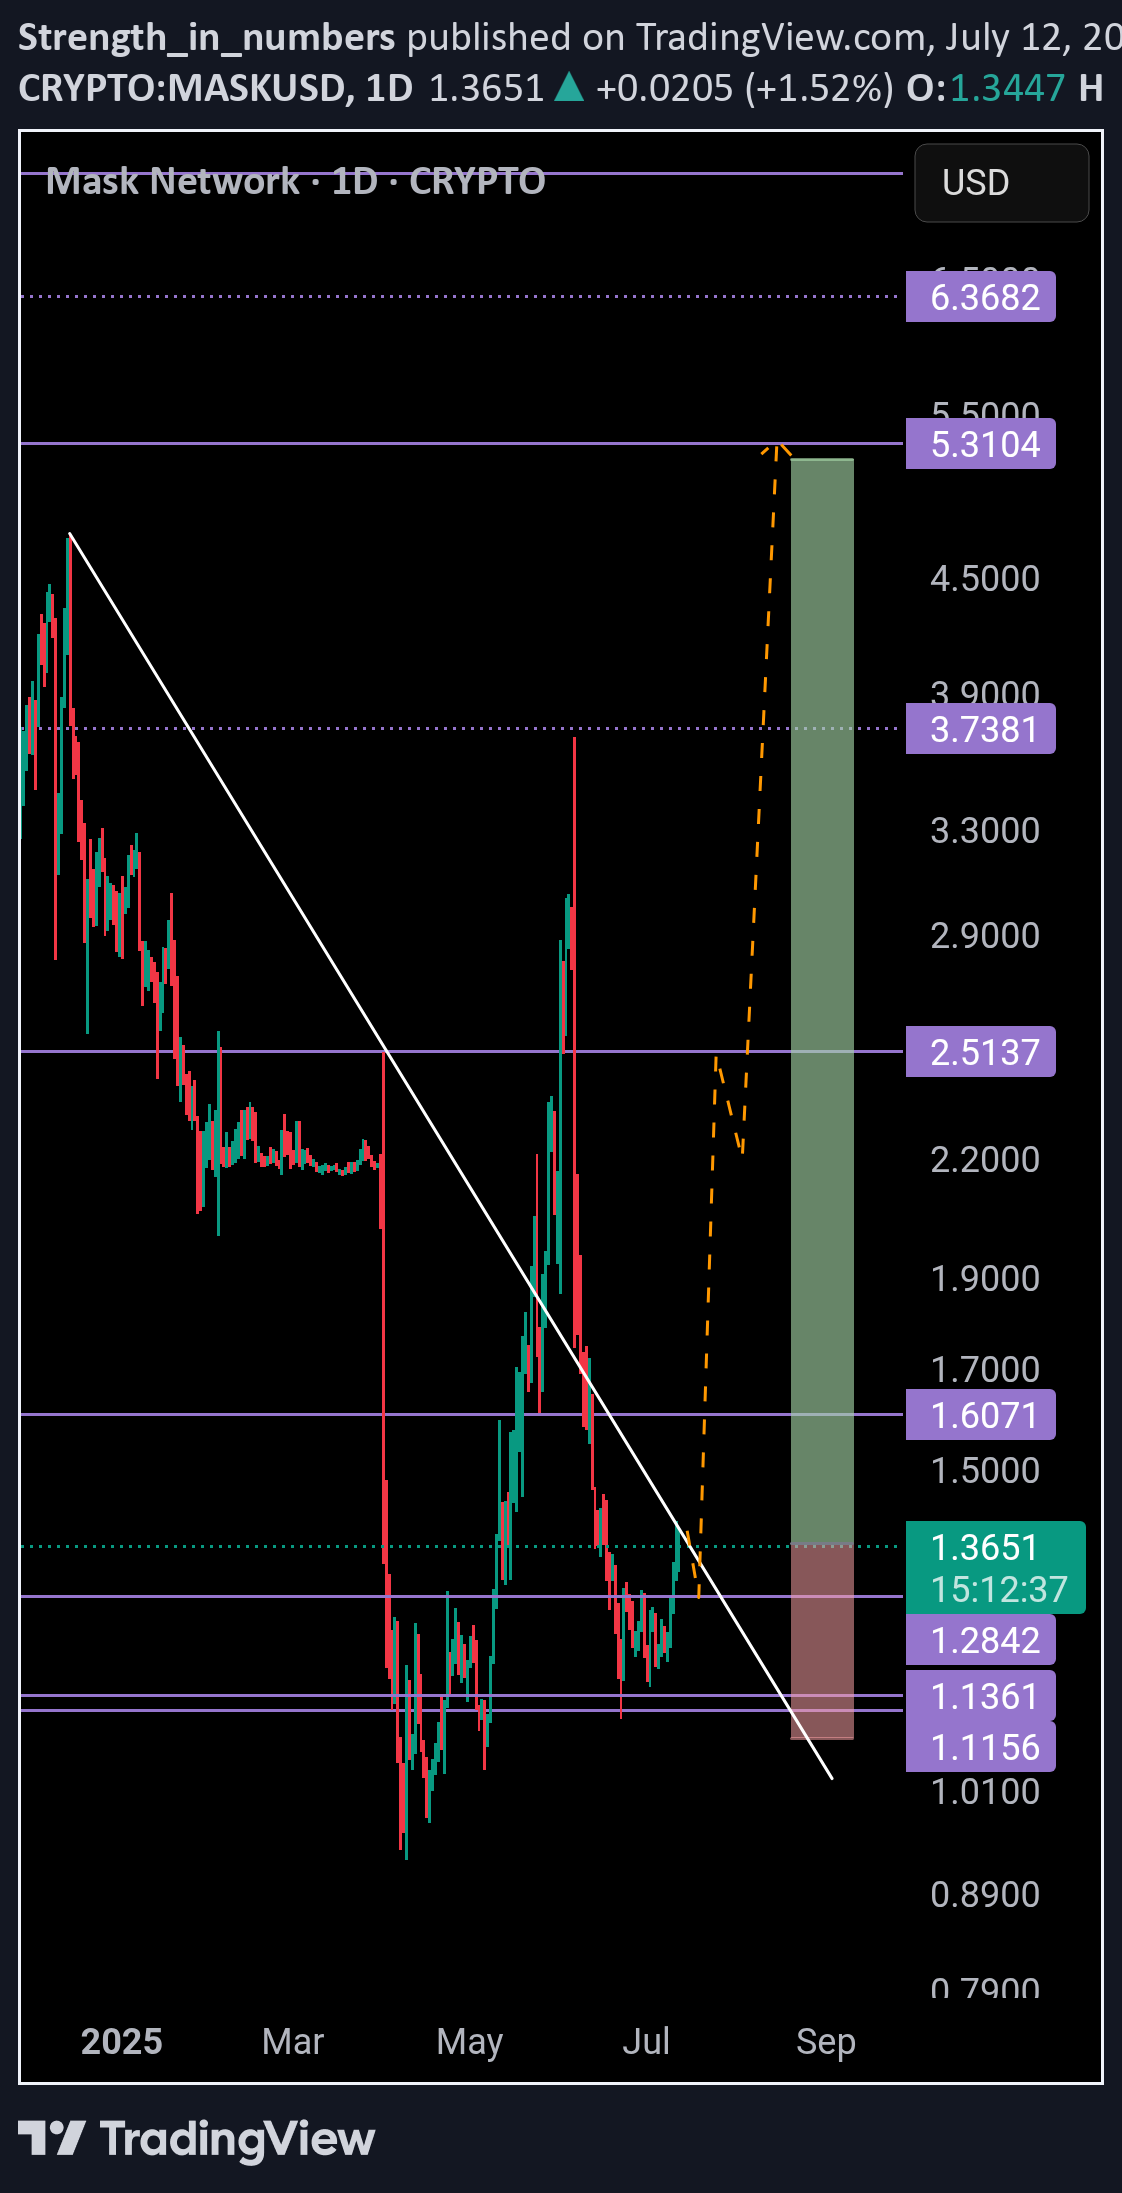
1D timeframe MASK is currently re-testing the downtrend. Breaks above could send price to 5.30 which has acted as resistance 4 x times historically. We did see a fake-out of the downtrend before a significant move to the downside bringing us back underneath and back to previous support levels. Wouldn't be suprised if we re-tested 1.30 as support before going up. 280% up vs 21% down Reward vs Risk @ 13:1

behdark
MASK Analysis (3D)
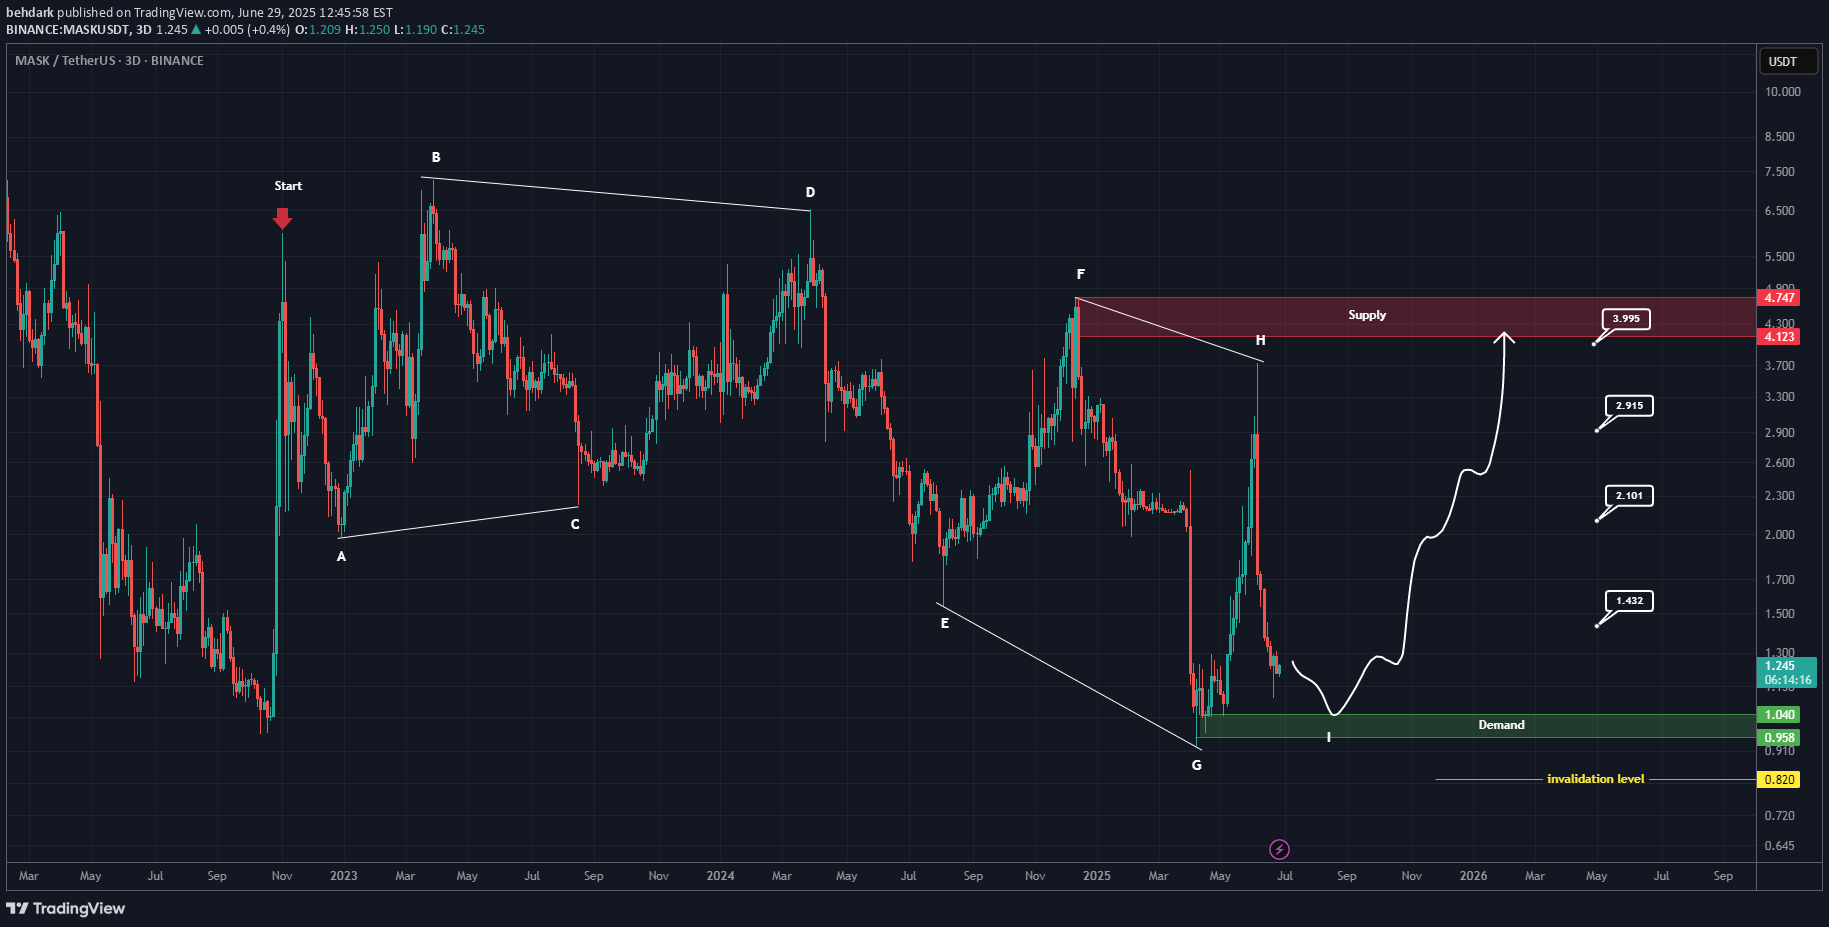
The correction for MASK has started from the area marked as “Strat” on the chart.This appears to be forming a symmetrical correction, and we seem to be approaching the end of wave I.The green zone is considered the most favorable and low-risk area for the completion of wave I.Targets are indicated on the chart.A daily candle closing below the invalidation level will invalidate this analysis.For risk management, please don't forget stop loss and capital managementComment if you have any questionsThank You

systemmania
MASKUSDT.P Adaletsiz Koyun İş Başında !!!

Hi valuable Scalpçı Friends, unjustly grievous mascusdt.p again in the decision phase. This sheep, which is not clear what to do, is unfortunately heated for a movement again. With the possibility of going up and down a little bit, it will quickly take the lonstruffs with the upward movement and take up the upward movement, but the possibility that you will want to get some shorts from below will predominate me before going up. Unfortunately, if I don't want you to play in dangerous waters that never adapt to such formations, this kind of hidden unstable treasures are hidden in the money. Please think and make the right strategy for yourself by scratching the stone a little and make your decision. I wish you all plenty of gains.
Disclaimer
Any content and materials included in Sahmeto's website and official communication channels are a compilation of personal opinions and analyses and are not binding. They do not constitute any recommendation for buying, selling, entering or exiting the stock market and cryptocurrency market. Also, all news and analyses included in the website and channels are merely republished information from official and unofficial domestic and foreign sources, and it is obvious that users of the said content are responsible for following up and ensuring the authenticity and accuracy of the materials. Therefore, while disclaiming responsibility, it is declared that the responsibility for any decision-making, action, and potential profit and loss in the capital market and cryptocurrency market lies with the trader.