
Skill-Knowledge-Conduct
@t_Skill-Knowledge-Conduct

What symbols does the trader recommend buying?
Purchase History
پیام های تریدر
Filter
Skill-Knowledge-Conduct
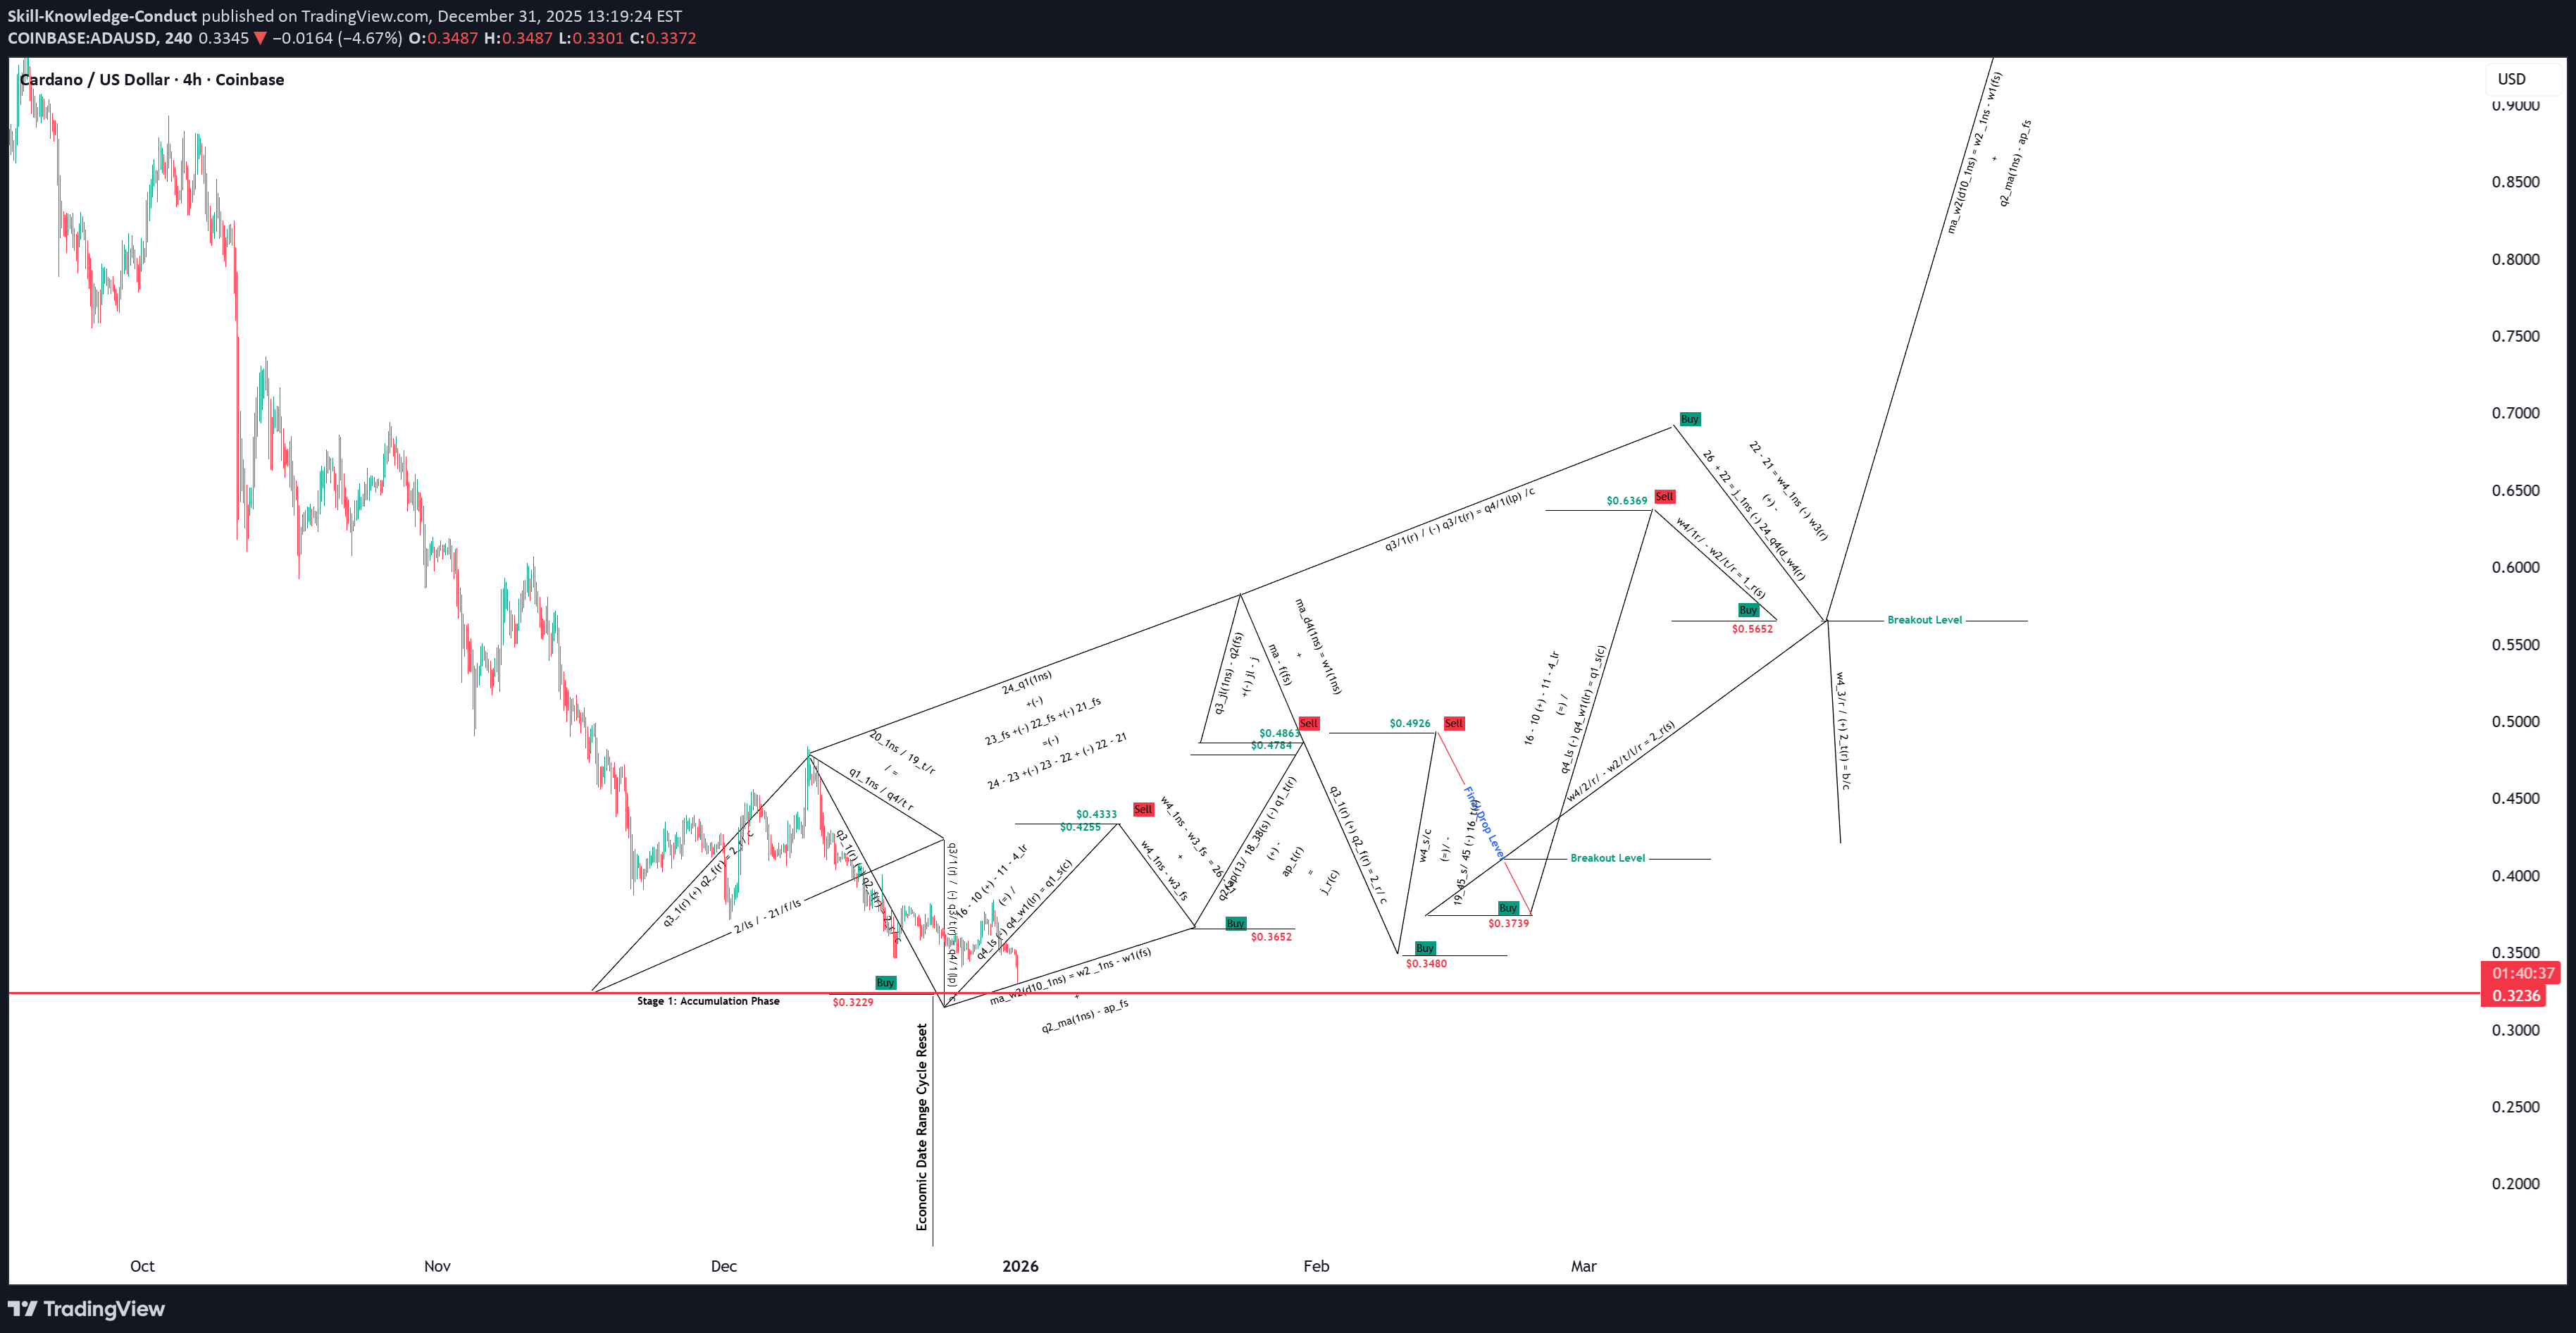
ADA_ _ Jan _ Distribution

ADA_ _ Jan _ Distribution $0.4505 $0.4658 $0.4862 $0.5379
Skill-Knowledge-Conduct
اعلام زمان دقیق: دوره بازنشانی اقتصادی در راه است! (آماده صعود شوید)
Prepare for Ascending Order.
Skill-Knowledge-Conduct
Gold _ Drop _ Update_ Confirmation _ Of_ Rejection
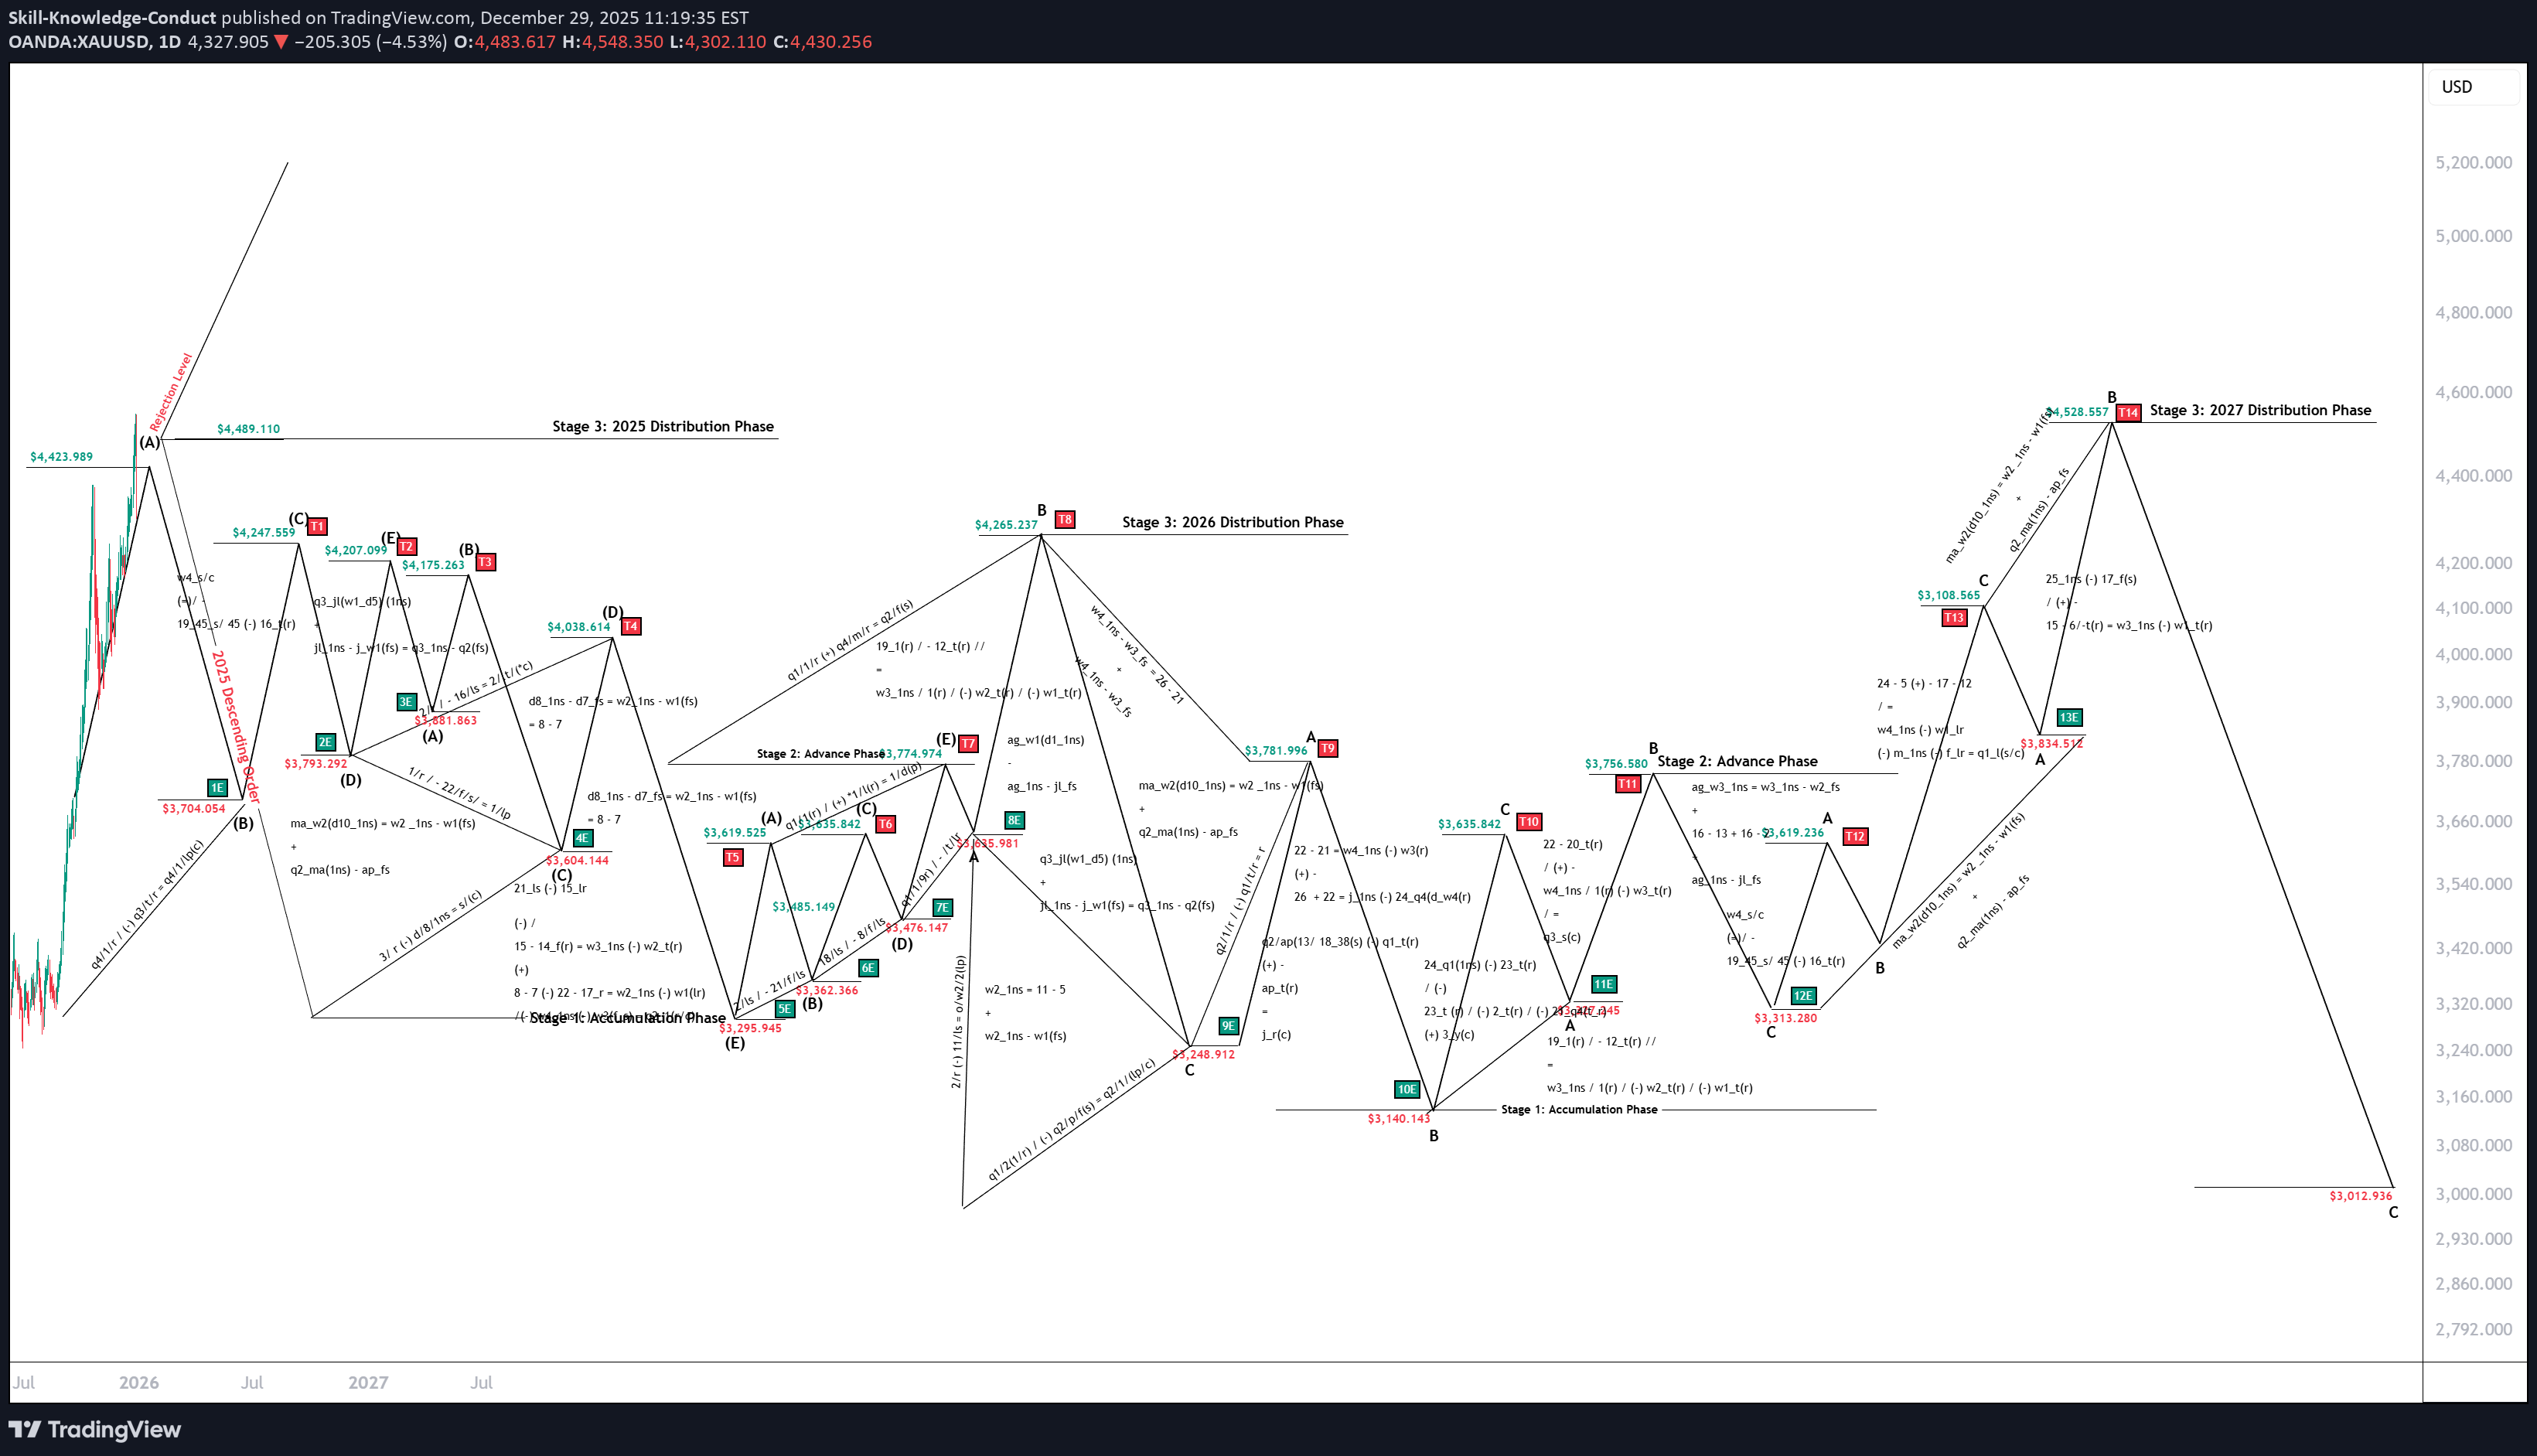
Confirmation of Rejection. Updated version:
Skill-Knowledge-Conduct
تحلیل و پیشبینی دقیق قیمت کاردانو (ADA) در فصل چهارم: فرصتها و ریسکها
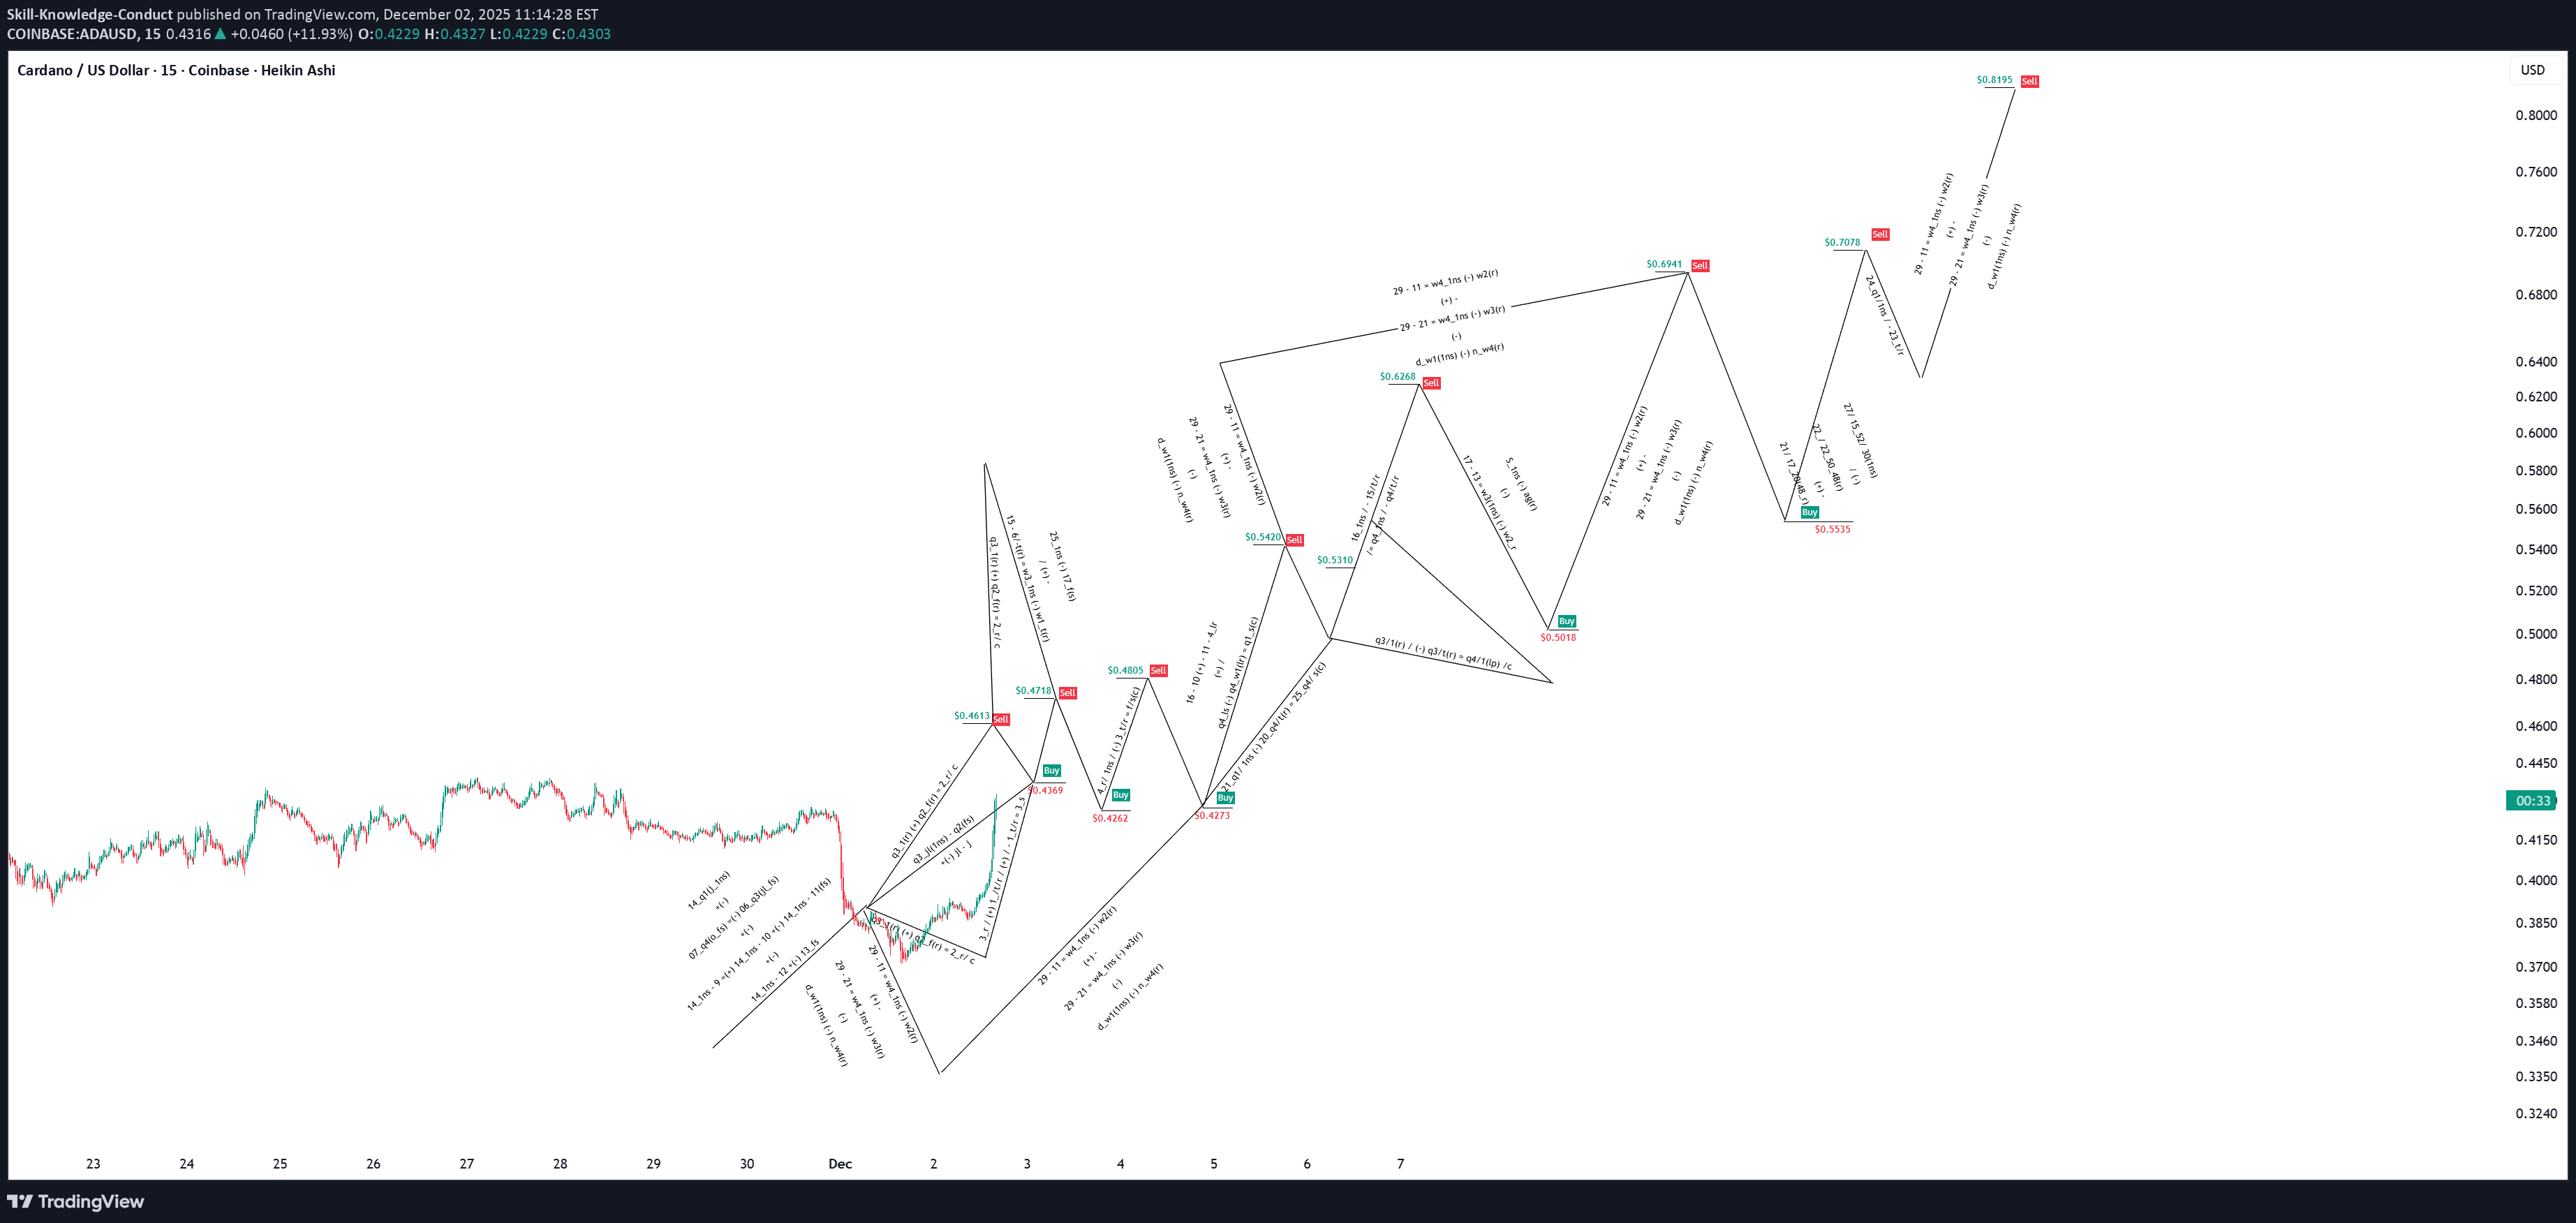
ADA_Q4_Trade
Skill-Knowledge-Conduct
آپدیت طلایی: خبرهای جدیدی که نباید از دست بدهید!

We remain as previous publication.
Skill-Knowledge-Conduct
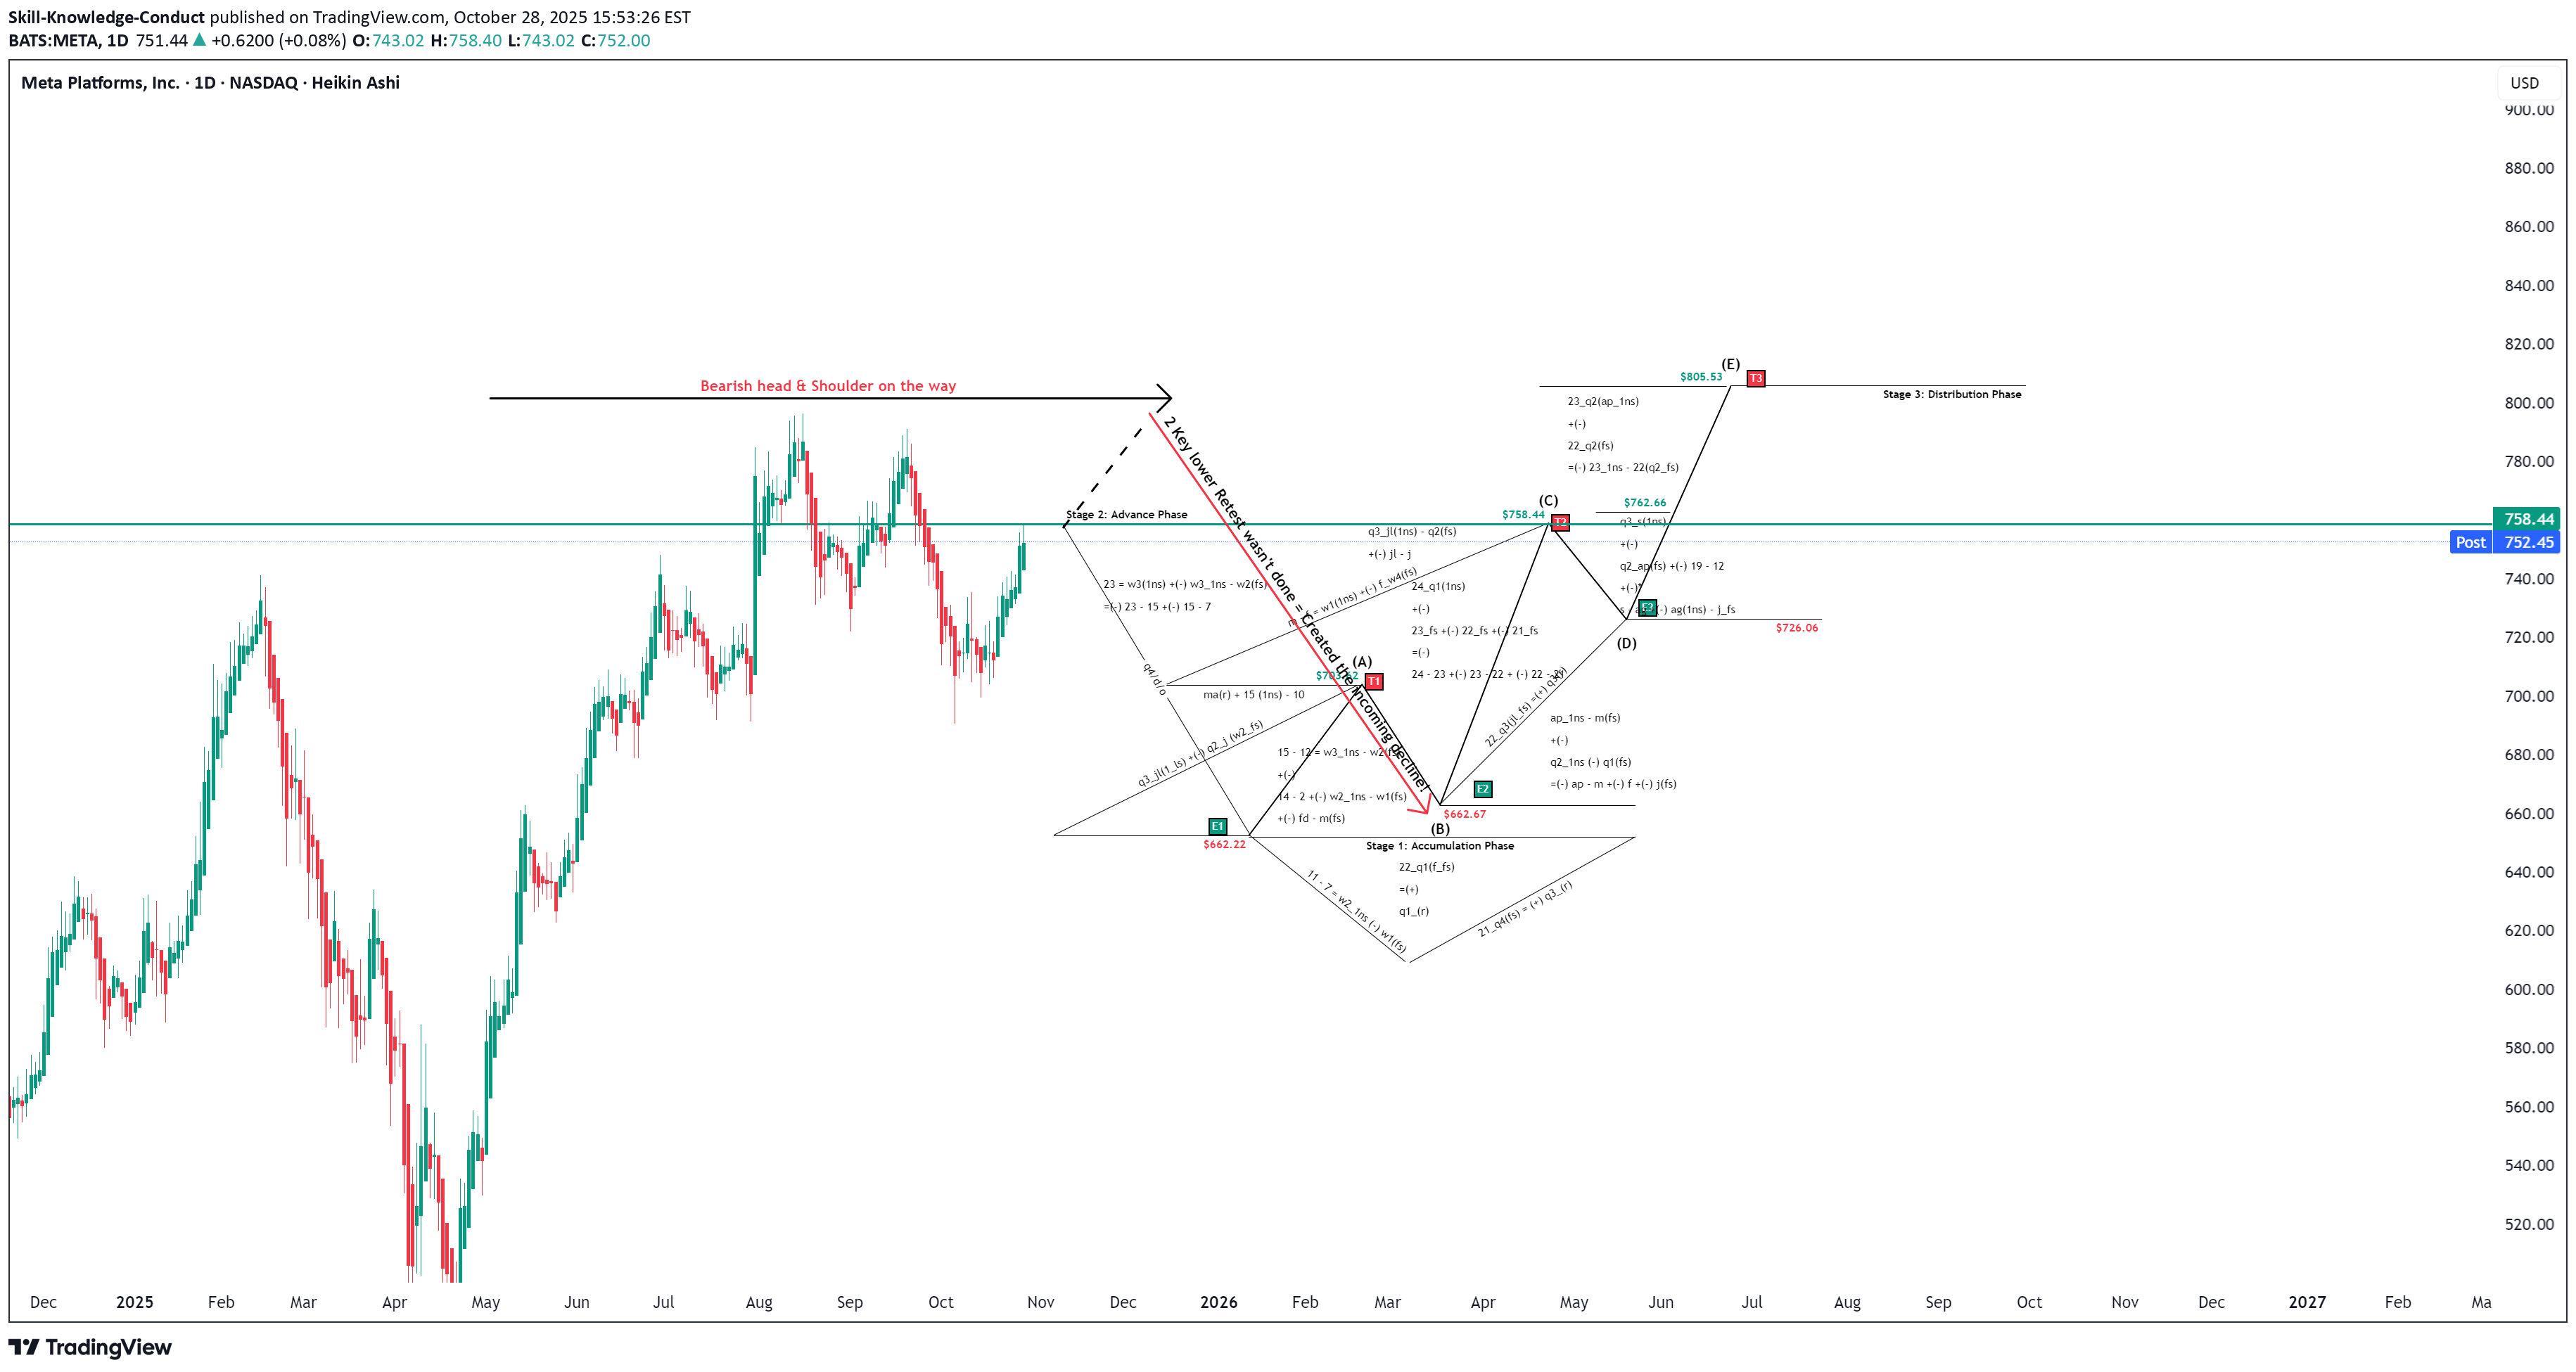
سطح کلیدی متا: ریزش یا جهش؟ تحلیل دقیق قیمتها
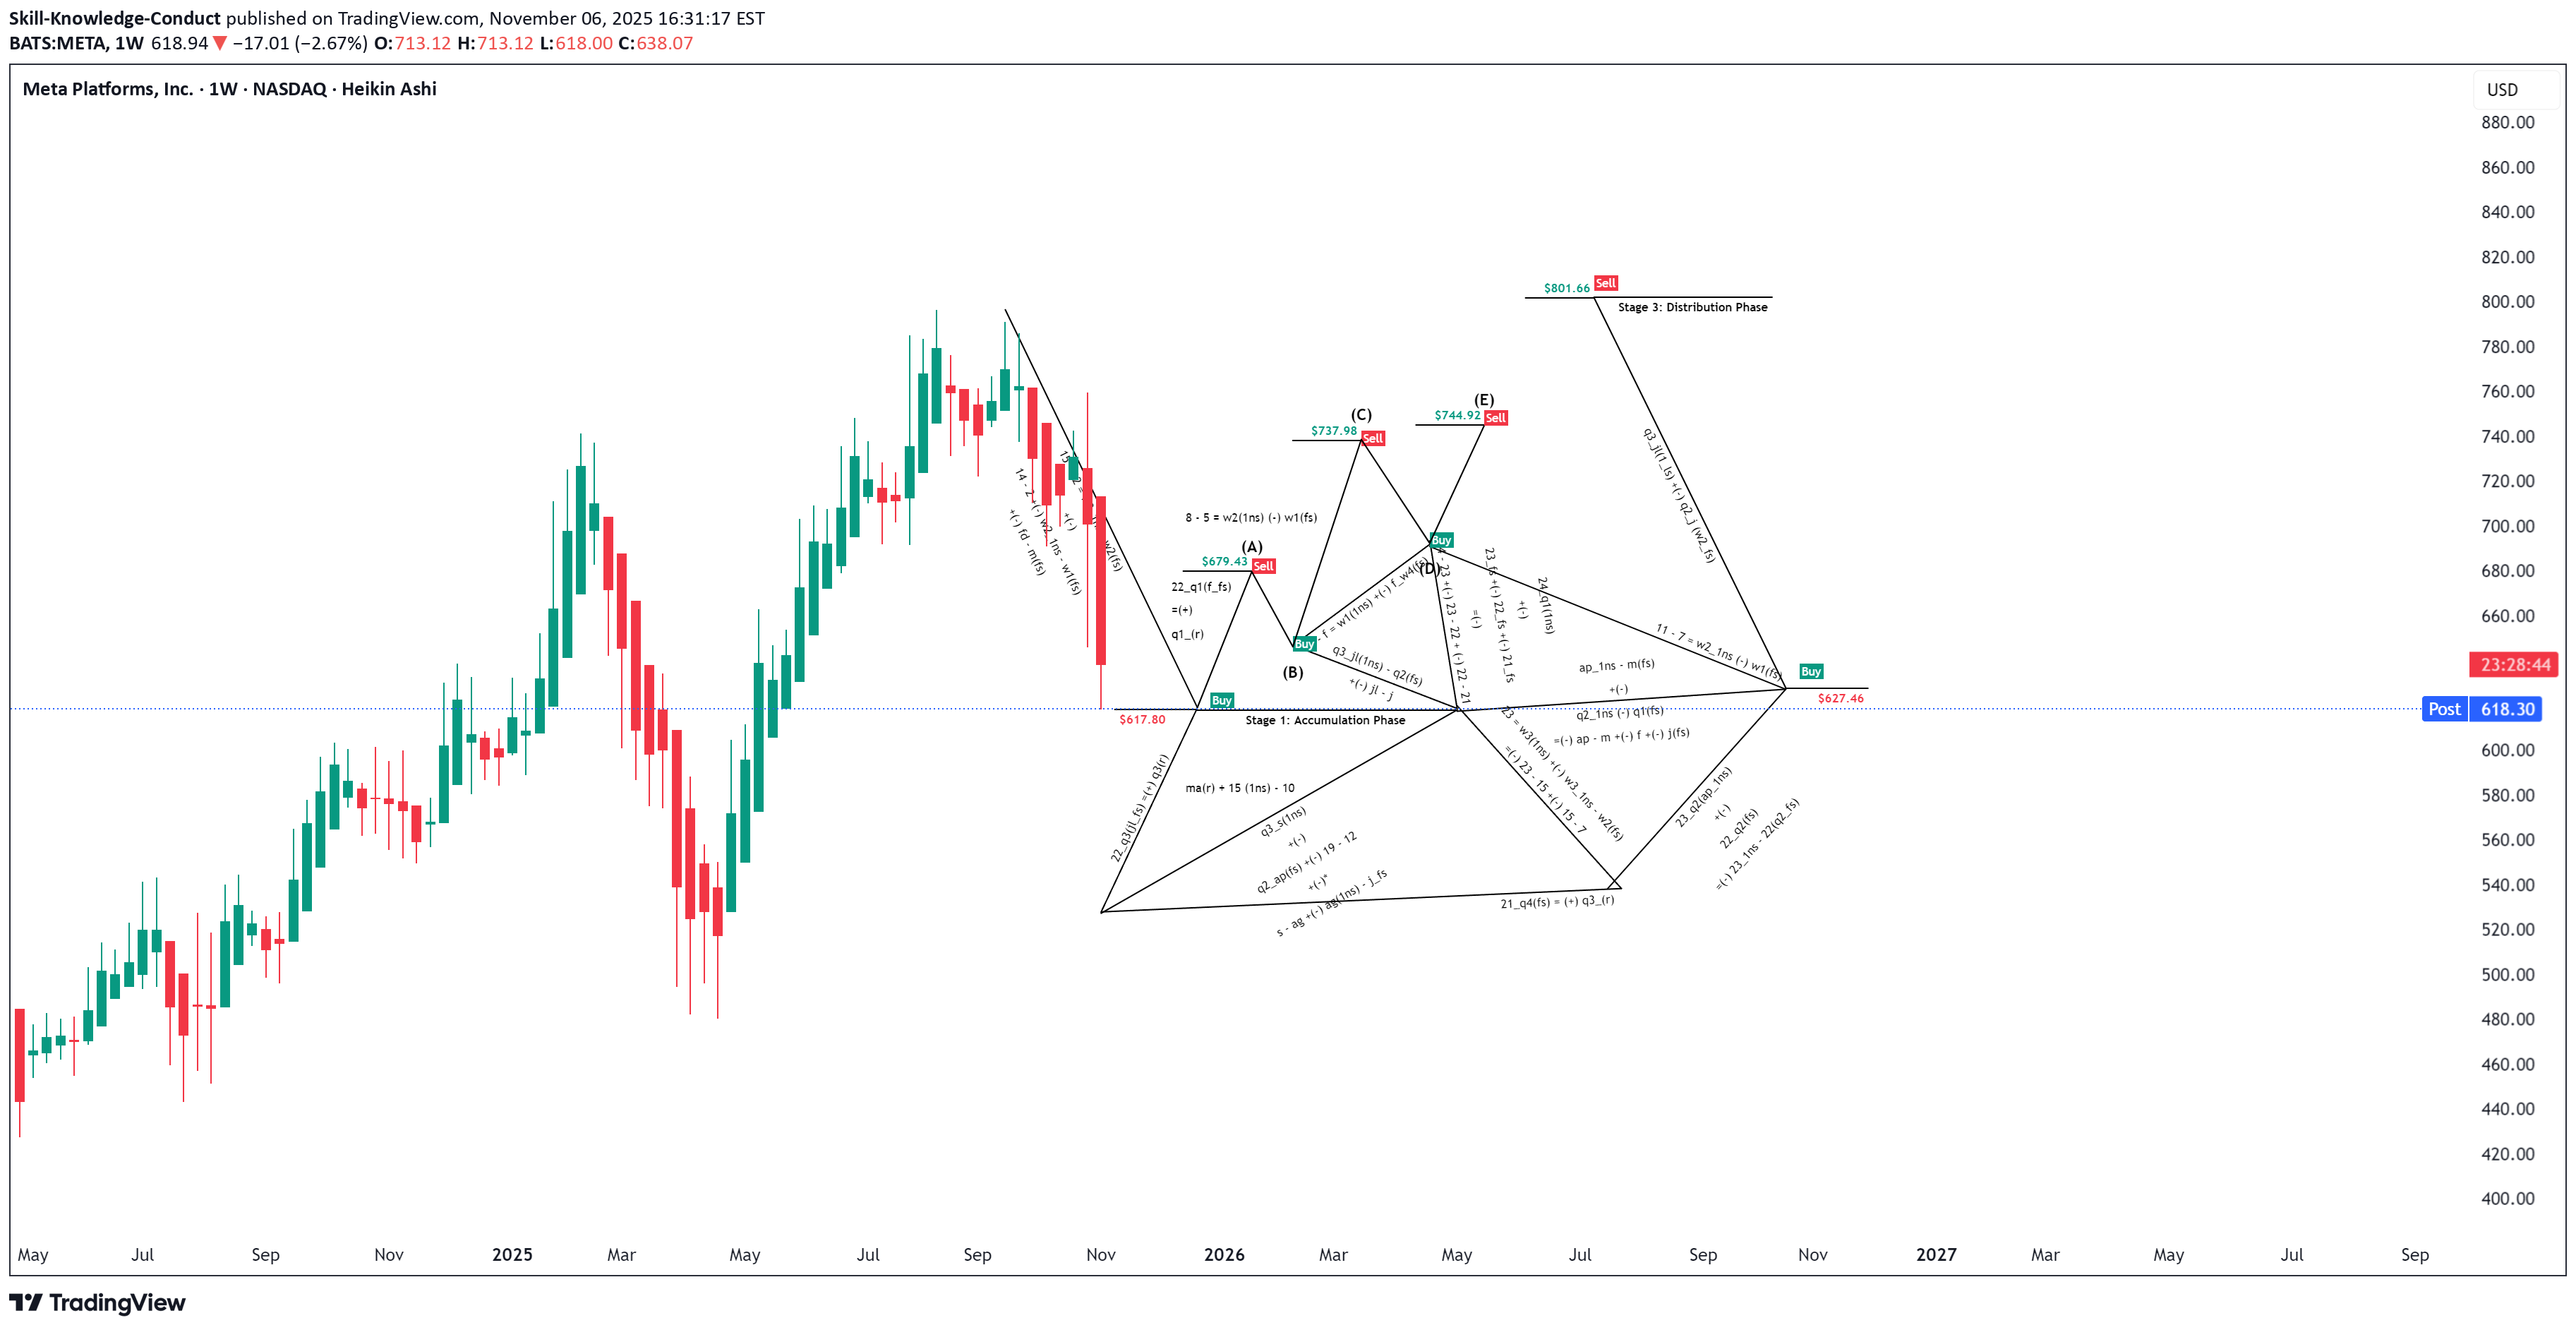
Holding within the key level.
Skill-Knowledge-Conduct
تأیید شد: ریزش سطح متا (Meta Drop Level Confirmed)
Rejection confirmed.
Skill-Knowledge-Conduct
افت سهام آمازون تا پایان ۲۰۲۶؛ چه دادههایی بازار را تغییر میدهد؟
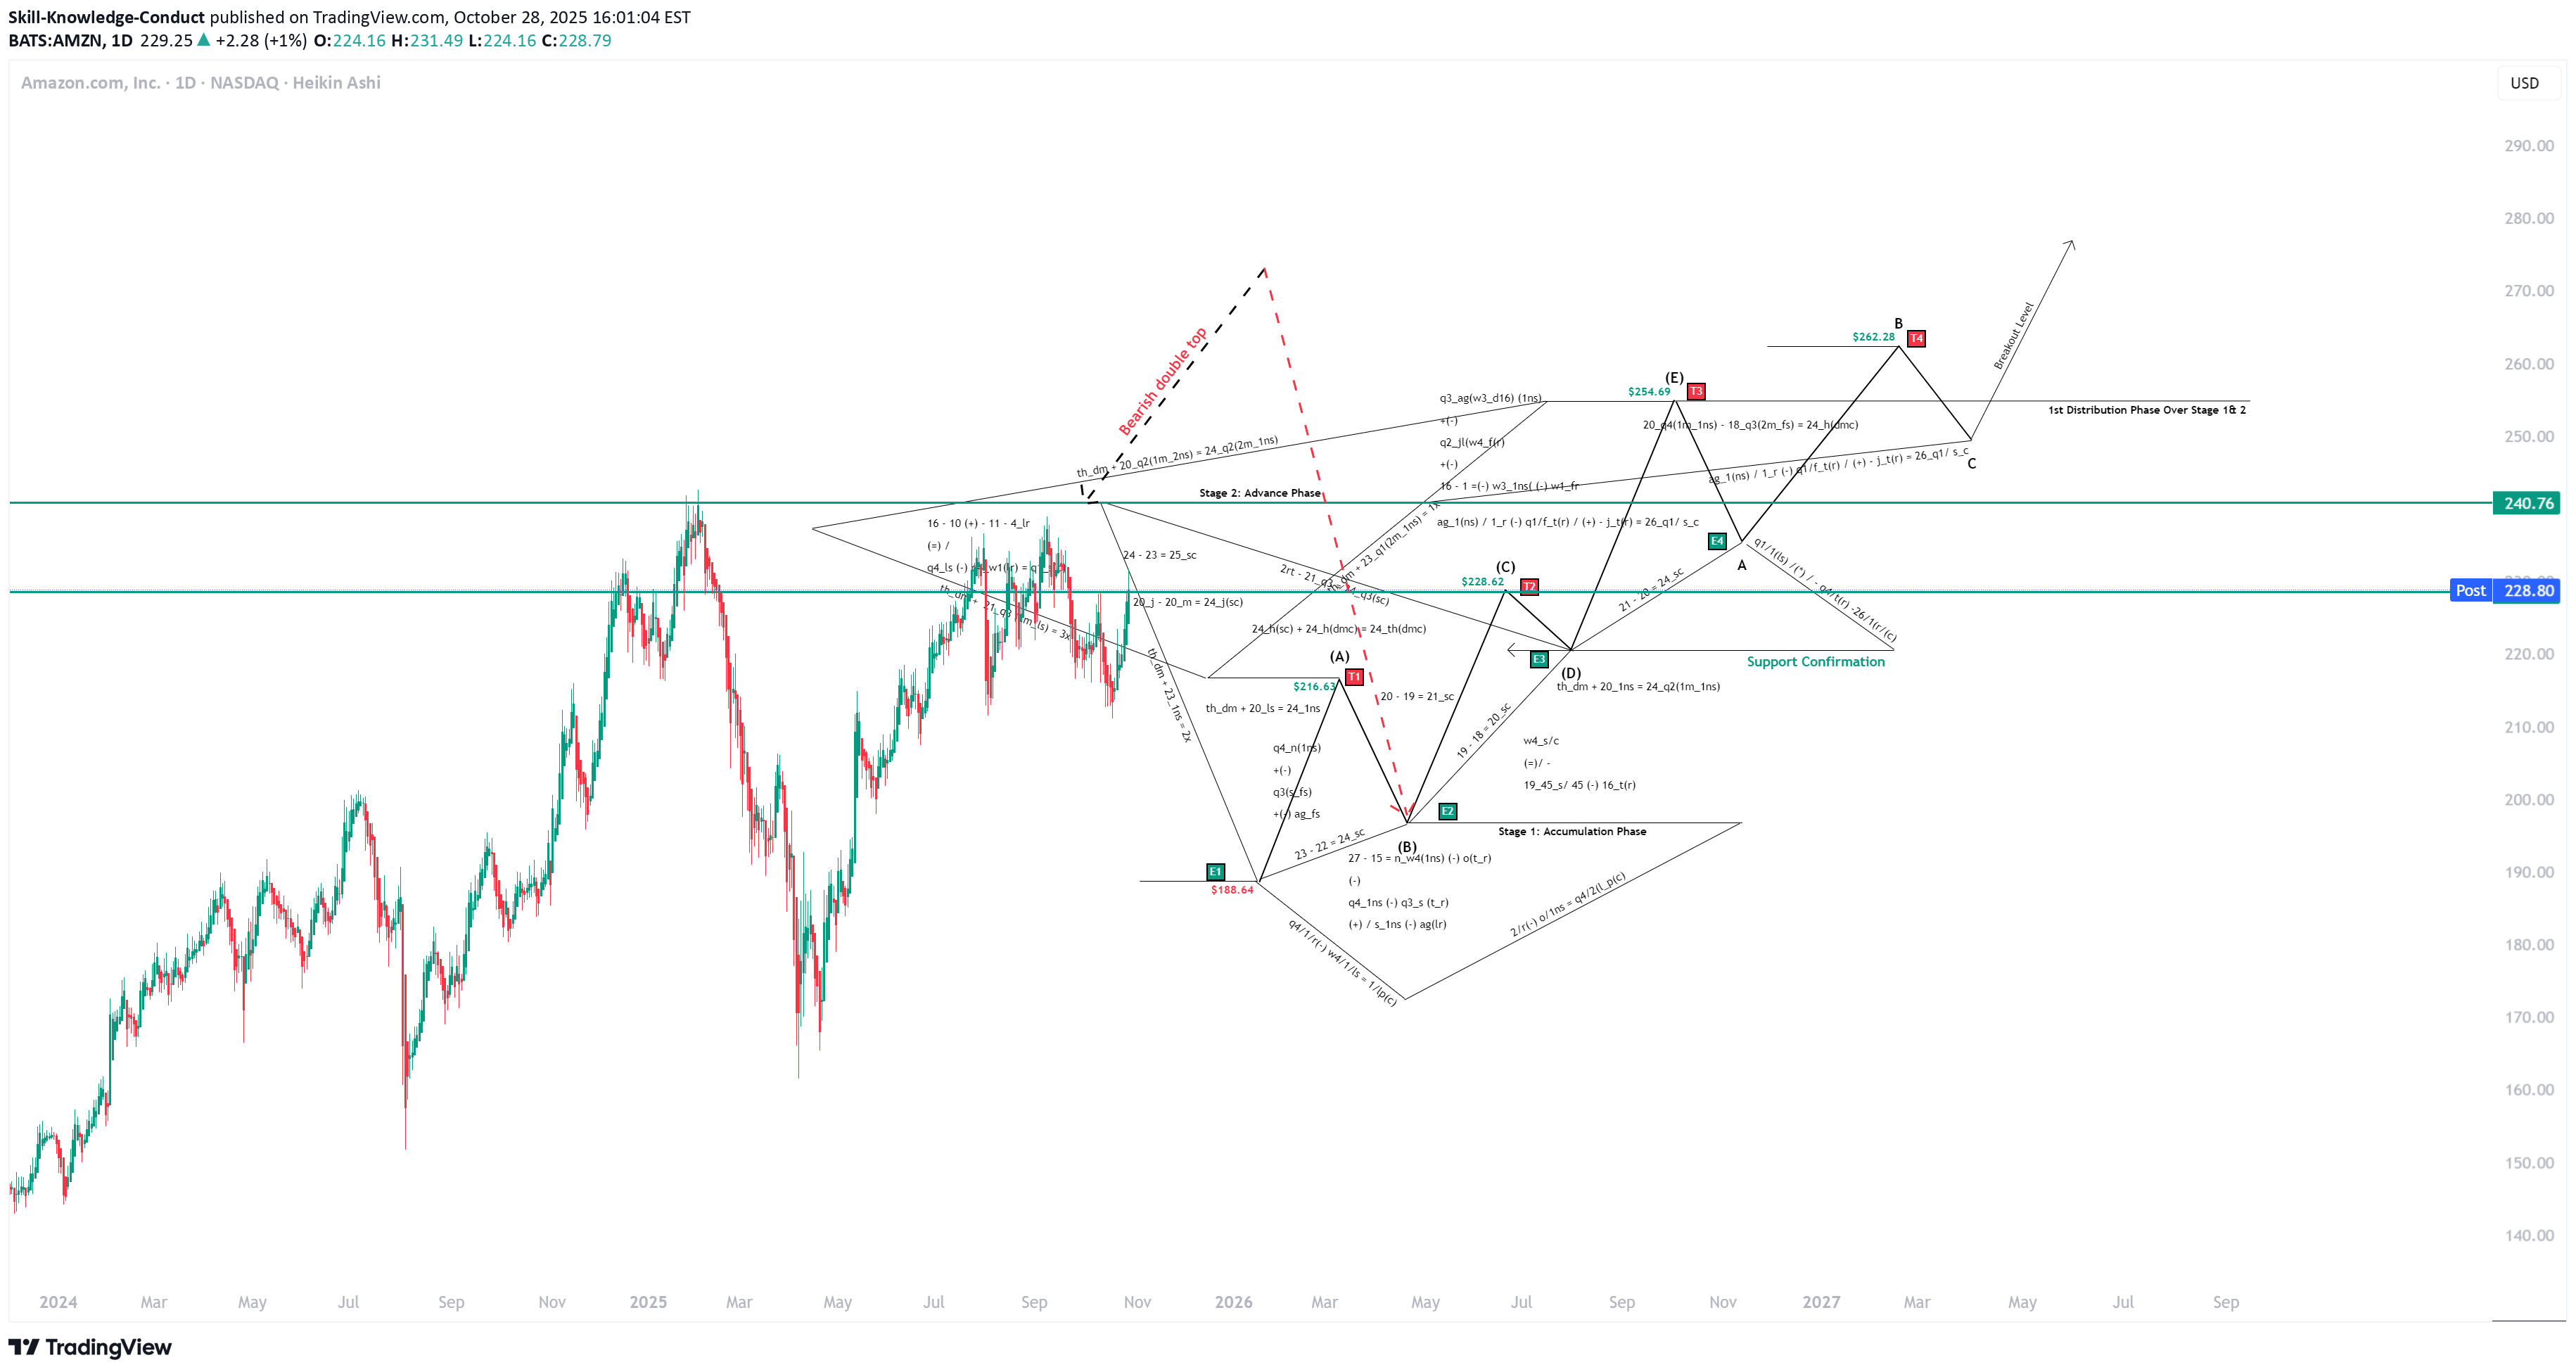
Most of Share will start descending as we are approaching mid Q4 and market require a new rest data for 2026.
Skill-Knowledge-Conduct
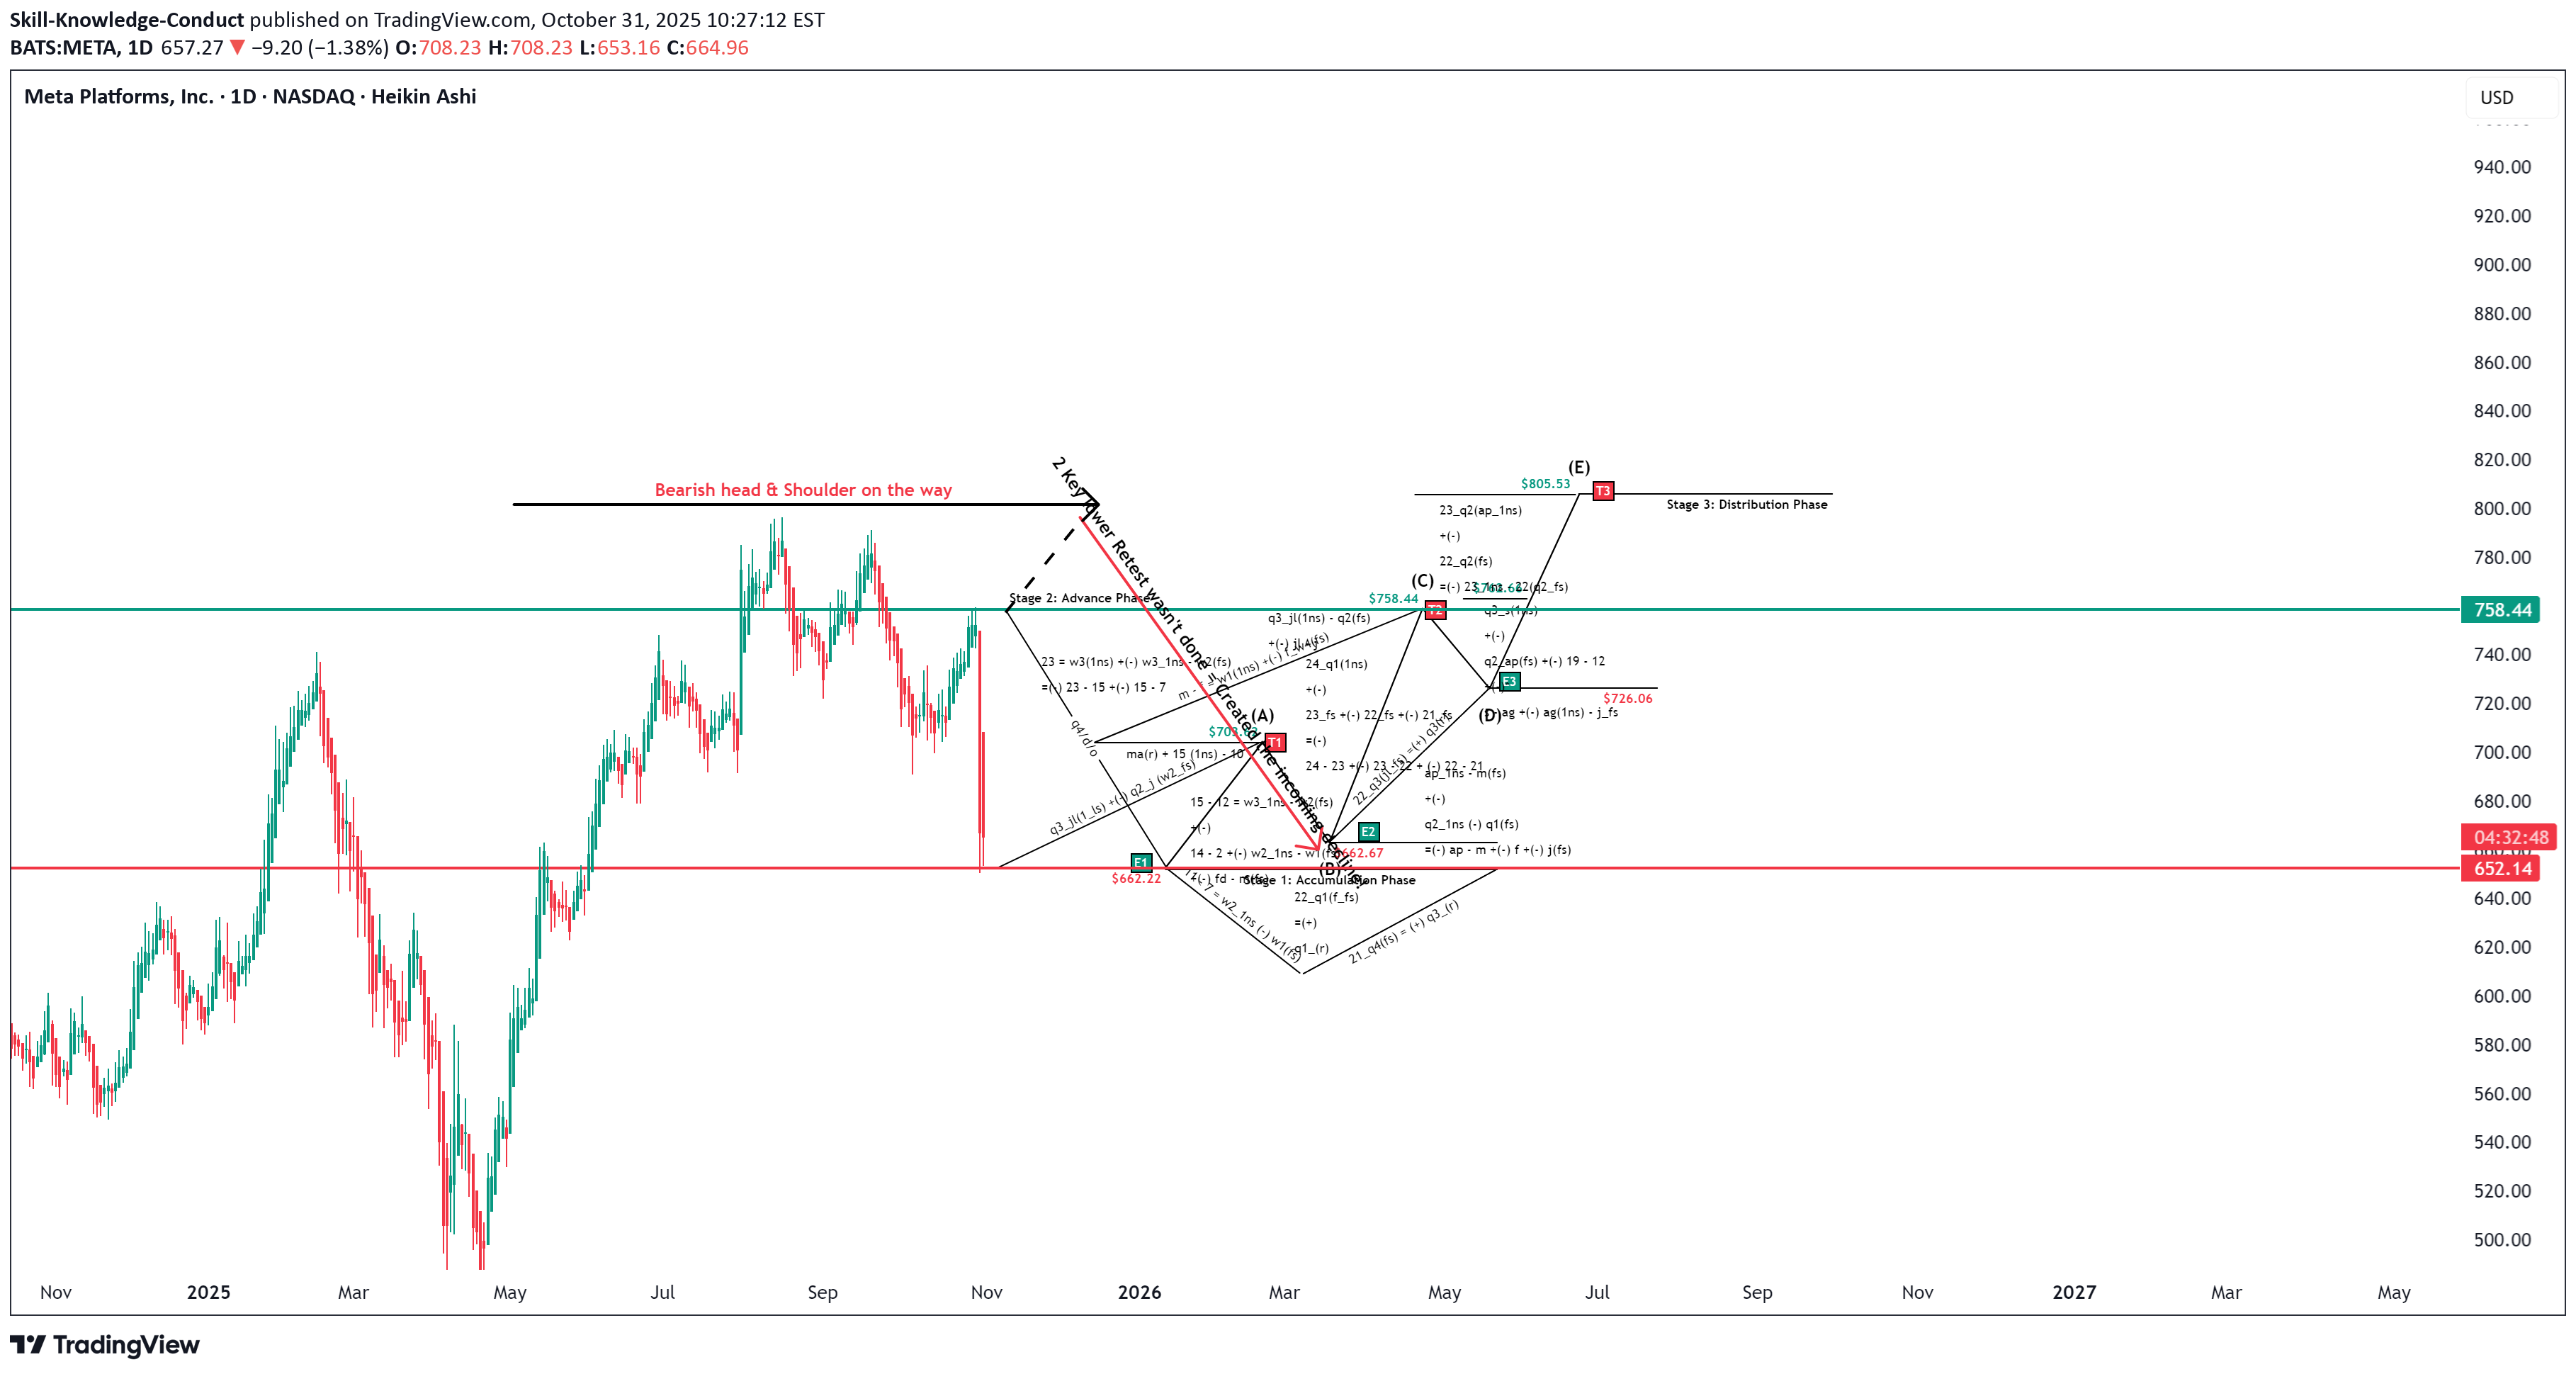
افت شدید در راه است: آپدیت جدید متا چه بلایی سر ما میآورد؟
Expecting a major decline!
Skill-Knowledge-Conduct
دقت پیشبینیهای انویدیا: توزیع موفق و آینده بازار
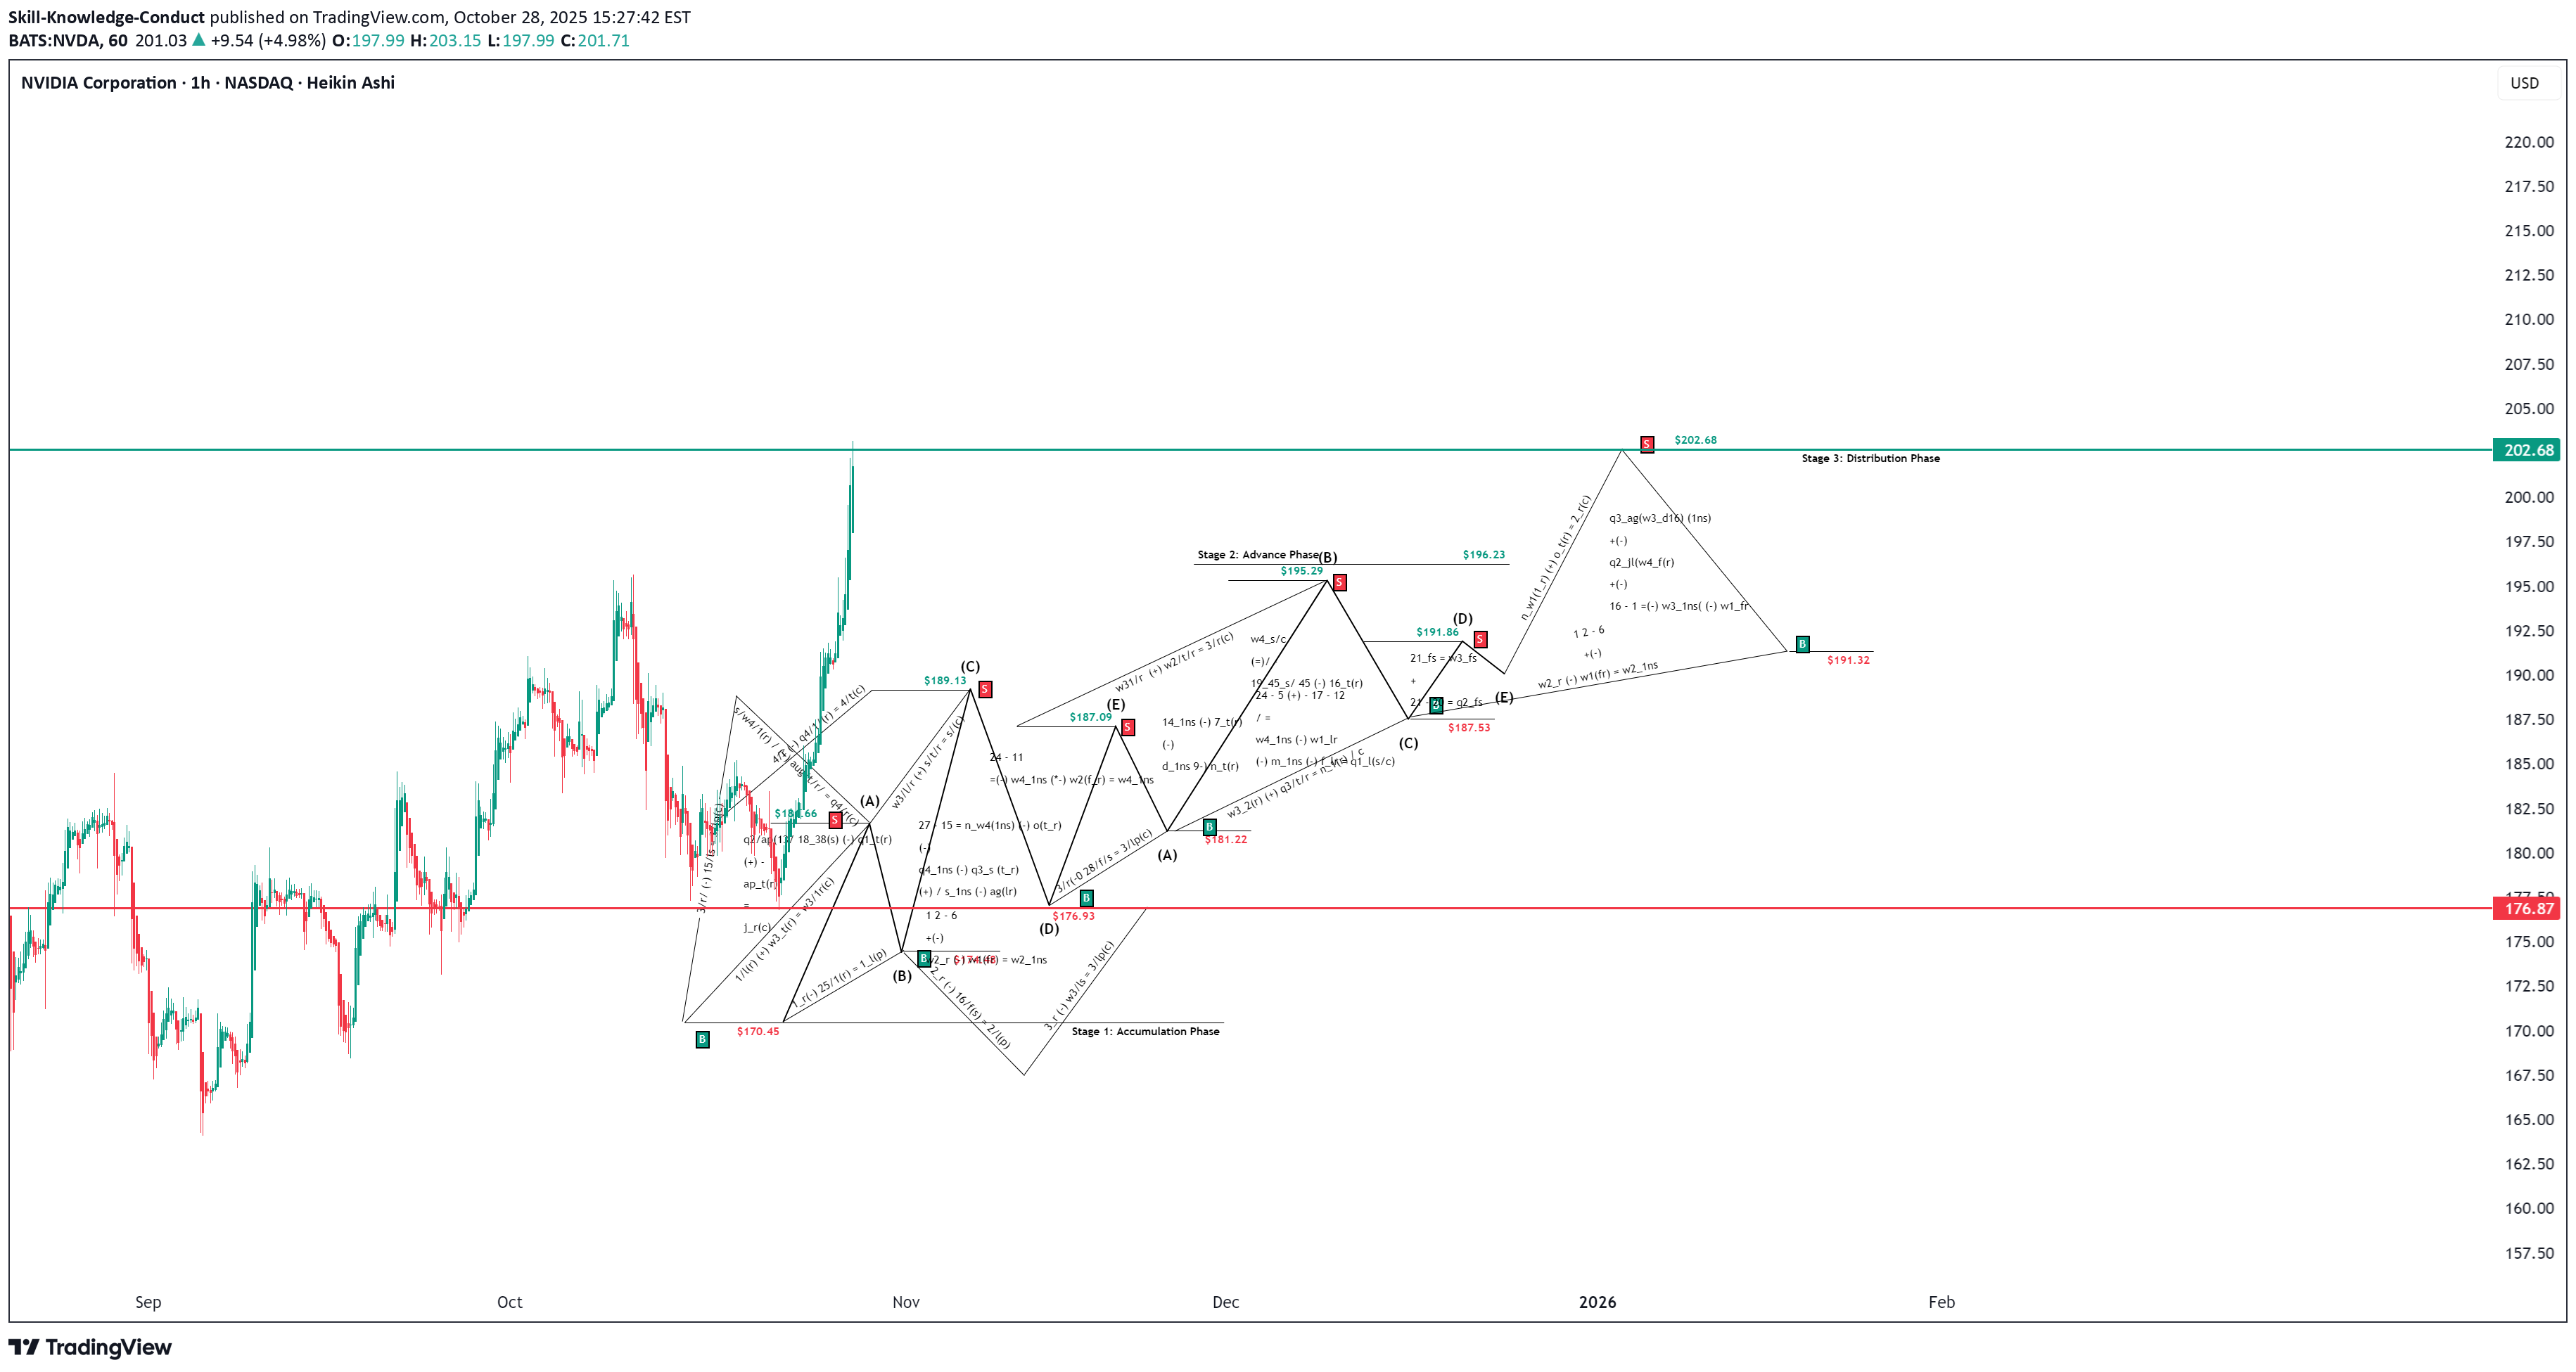
Distribution Phase Achieved.
Disclaimer
Any content and materials included in Sahmeto's website and official communication channels are a compilation of personal opinions and analyses and are not binding. They do not constitute any recommendation for buying, selling, entering or exiting the stock market and cryptocurrency market. Also, all news and analyses included in the website and channels are merely republished information from official and unofficial domestic and foreign sources, and it is obvious that users of the said content are responsible for following up and ensuring the authenticity and accuracy of the materials. Therefore, while disclaiming responsibility, it is declared that the responsibility for any decision-making, action, and potential profit and loss in the capital market and cryptocurrency market lies with the trader.