
LUMIA
Lumia
| تریدر | نوع سیگنال | حد سود/ضرر | زمان انتشار | مشاهده پیام |
|---|---|---|---|---|
 Captain-MAORank: 127 | خرید | حد سود: تعیین نشده حد ضرر: تعیین نشده | 9/5/2025 |
Price Chart of Lumia and Lumia Signal Trend
سود 3 Months :
Who made the most profit from Lumia?
Captain-MAO

سیگنال آلفا کریپتو
سیگنالهای Lumia
Filter
Signal Type
Trader Type
Time Frame
Captain-MAO
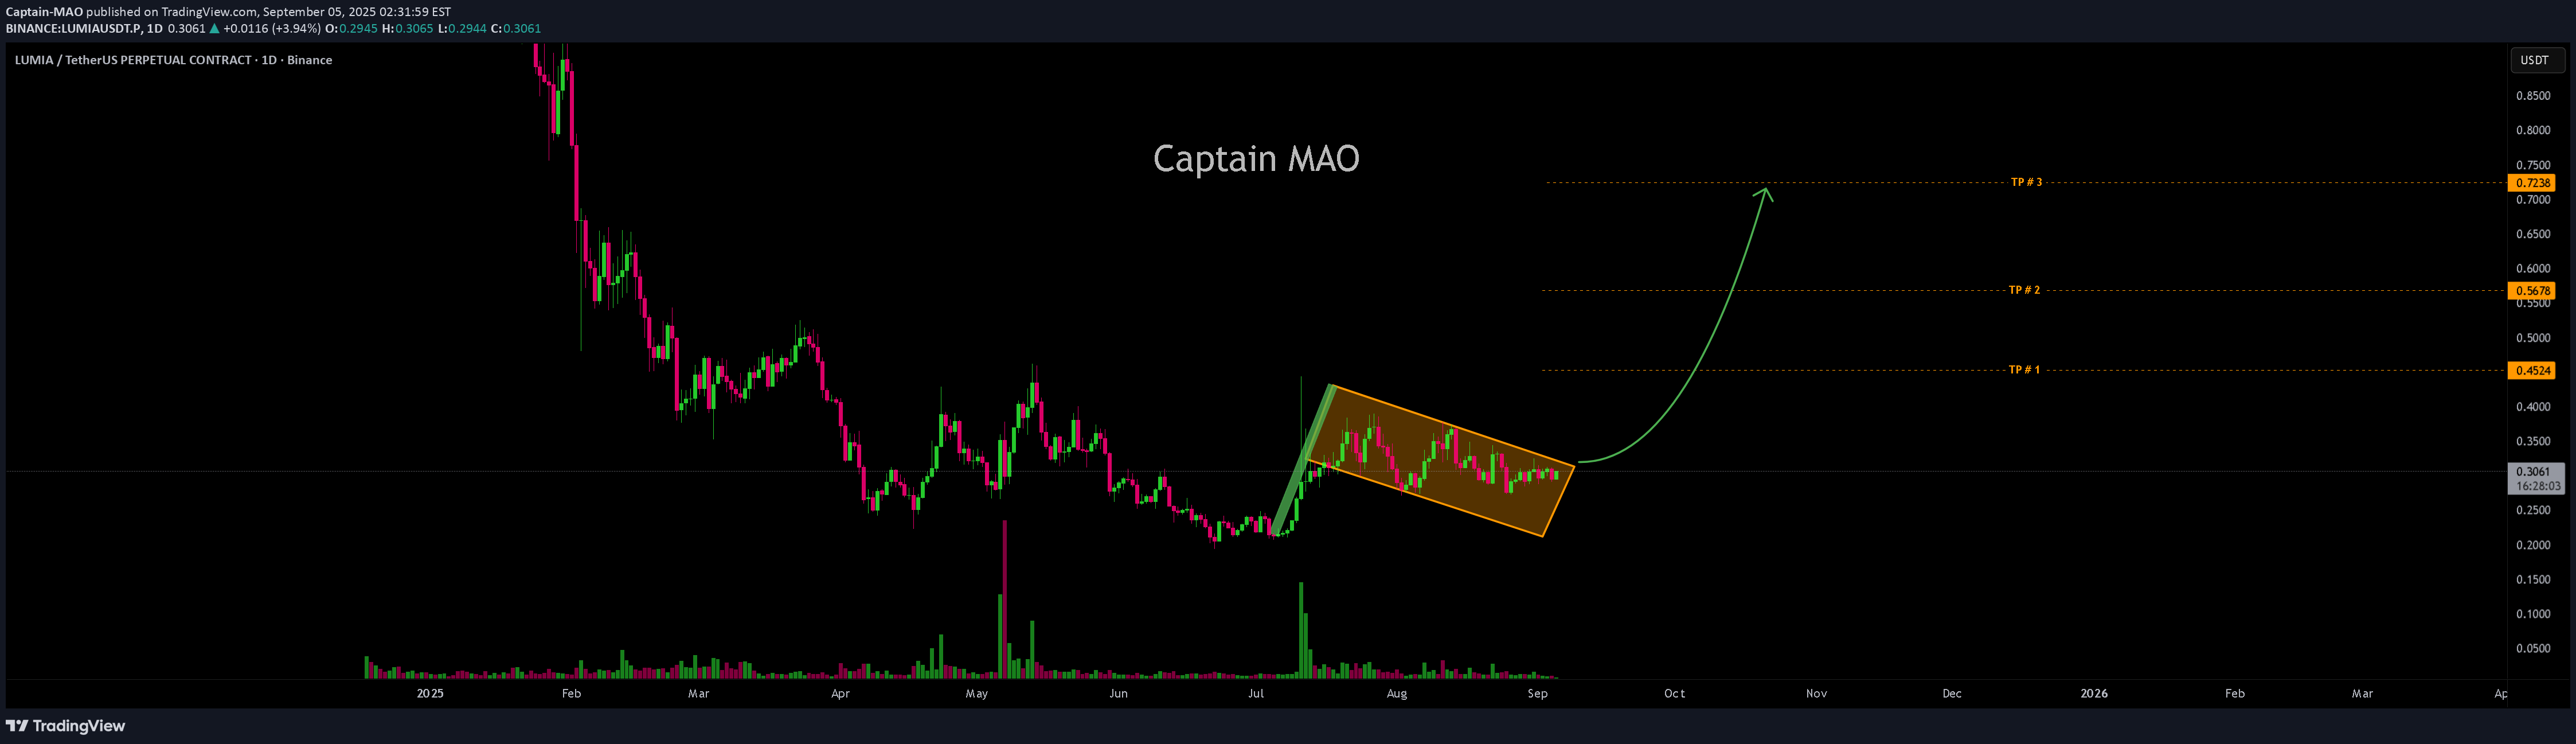
For the past 50 days, LUMIA/USDT has been developing a bullish flag pattern one of the most powerful continuation structures in technical analysis. This setup often signals the market is preparing for its next major upward move. Price action continues to protect the pattern and stabilize within the flag, showing that buyers remain in control and are absorbing supply. Once a breakout confirms, LUMIA could unleash significant upside momentum. This is a textbook bullish continuation setup, making it difficult to ignore for traders anticipating the next expansion leg.


Kap_Waves
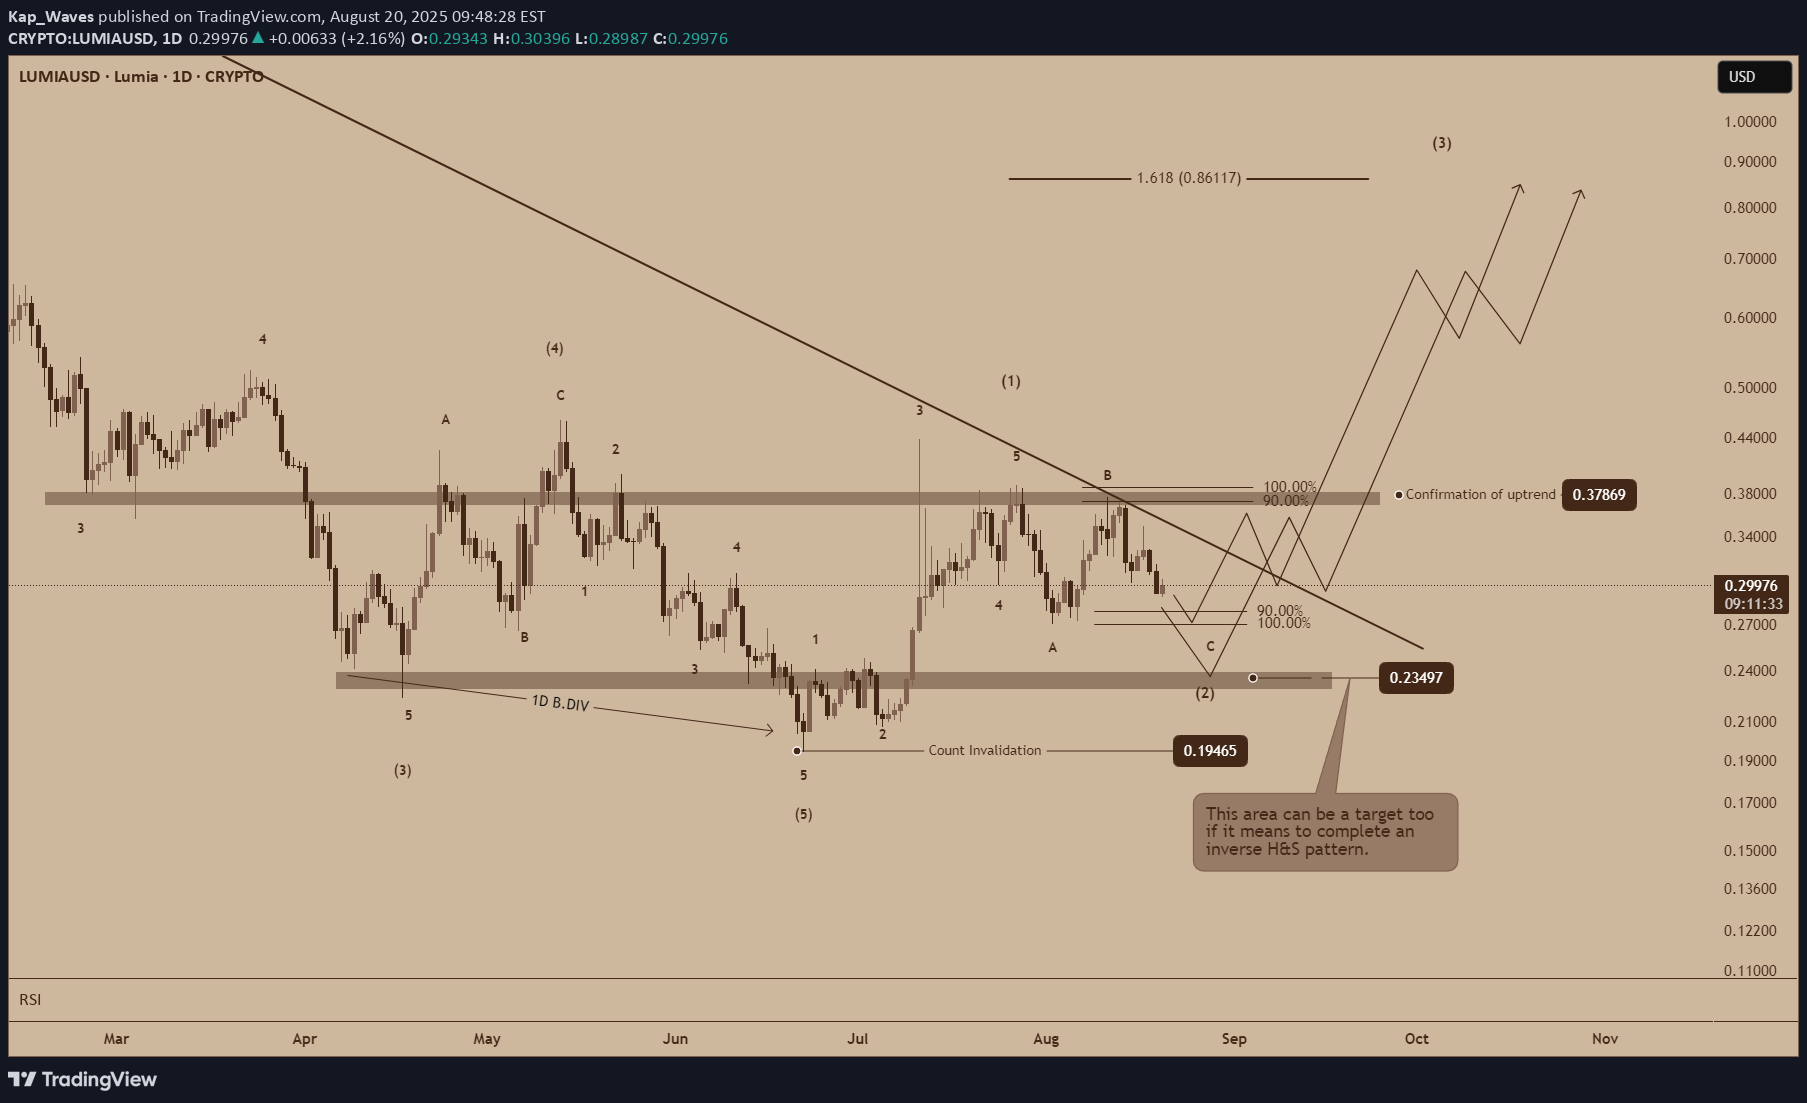
Following a request to do an analysis of LUMIAUSD , here are my thoughts: This chart is looking good for now. It is currently completing wave C of (2), a regular flat corrective variation. To confirm this idea, there should be a break a major trendline. To strengthen it more, a break of resistance will mean an uptrend with potential targets reaching 0.86. If it doesn't turn out to be a regular flat variation, there is a target below to hit the resistance at around 0.234. This case would mean a potential completion of an inverse H&S pattern potentially hitting targets slightly lower than the plotted target (0.86). Once this count gets invalidated (break the low of 0.194), there would be a need to reassess this outlook. For now, these are the cases for me.Note: For proper plotting of waves, in the line chart, my wave 3 of (1) should be at high where wave 4 of (1) begins. :))

SatochiTrader

Lumia shows strong potential for new volume. Real-time data will confirm this. Once confirmation is in place, the coin is likely to rise — and we’ll provide follow-up updates This coin can have risk, and it's not a high-quality choice.$0,40 can become an important first target in the coming time
Captain-MAO
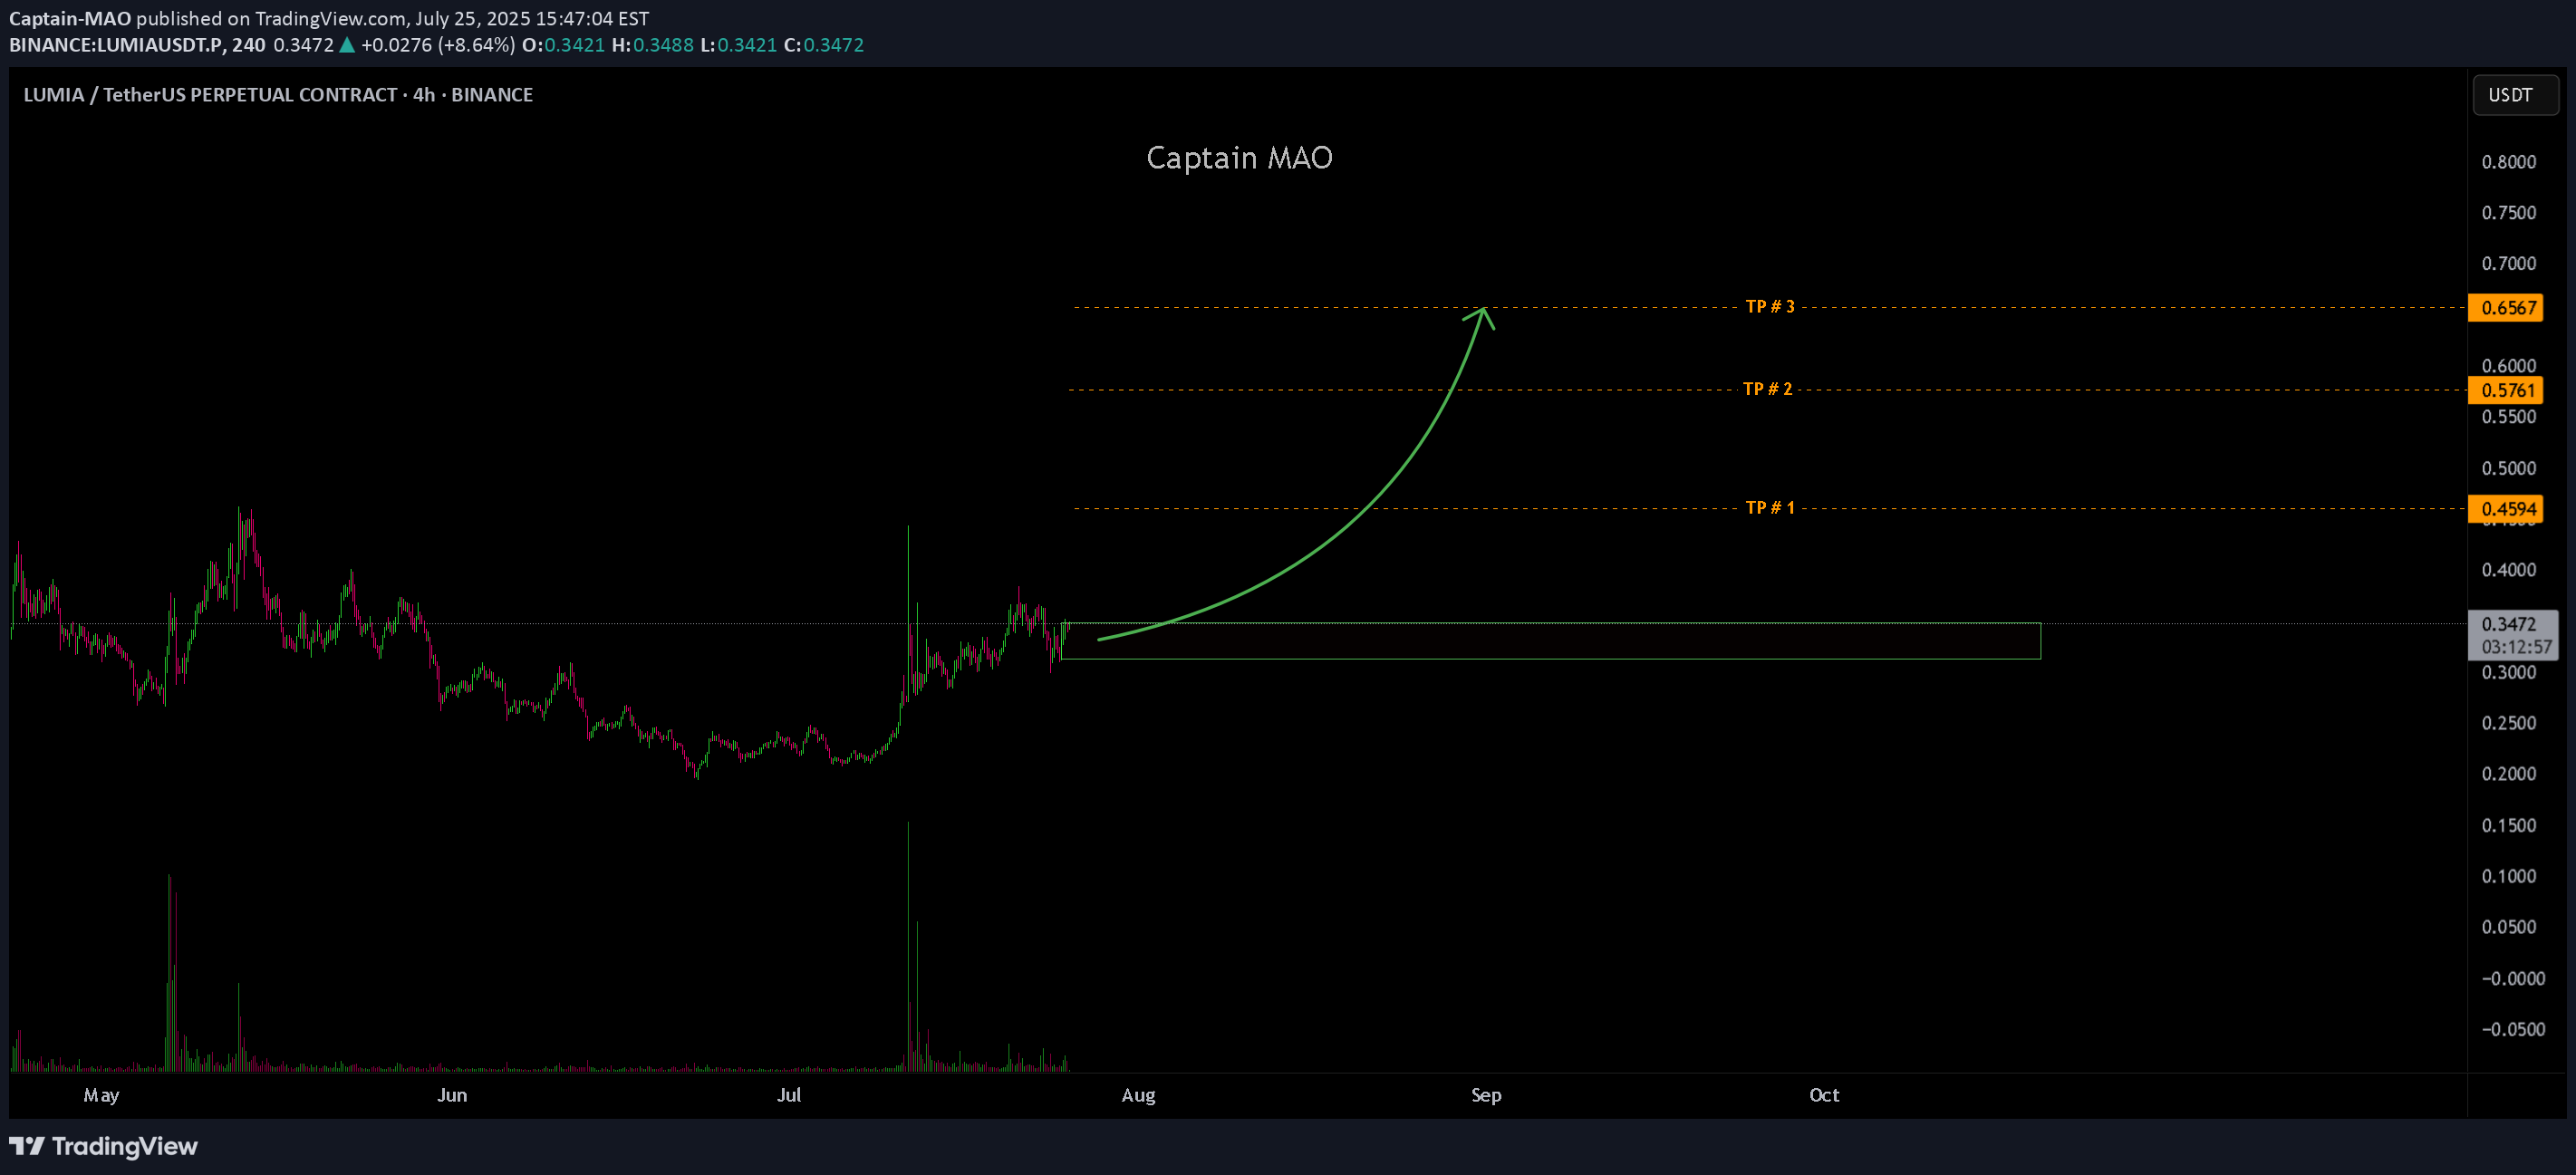
LUMIA/USDT has shown strong bullish momentum, with the first leg printing over +100% gain—signaling early strength and buyer dominance. Over the past two weeks, price action has been consolidating in a tight re-accumulation phase, forming a healthy base just above previous resistance . This phase appears to be nearly complete, and the chart structure suggests it's gearing up for the next impulsive leg upward. A break above the short-term range high with strong volume will likely confirm the continuation. We’ve marked the green box as the ideal entry zone, aligning with recent demand and structural support.
سیگنال آلفا کریپتو
⚜$LUMIA/USDT 🛒 ناحیه خرید: 0.30 - 0.34 ⚡️اهداف قیمت: 🎯T1: 0.37 🎯T2: 0.40 🎯T3: 0.46 🎯T4: 0.53 🎯T5: 0.63 🎯T6: 0.76 🔺️ حد ضرر: 0.26 💵 میزان پیشنهادی سرمایه گذاری: ۵ درصد از سرمایه 🔥 @Signal_Alpha 🔥


SpartaBTC

Logarithm. Time frame 3 days. Fresh cryptocurrency. This main trend of this cryptocurrency itself (the entire history of trades) acts as a secondary trend in meaning. The legend of the utility-imitation of this cryptocurrency is the tokenization of assets. A very good idea for the future hype of this kind, especially if they will continue to hype the "American" HBAR. The chart shows the zones (support/resistance horizontal and dynamic) of maximums and minimums for work. Now, after breaking the logic of the descending wedge (all the price drop), the price went into sideways consolidation. The channel step and local levels are shown. If they draw an inverted head and shoulders with the price in the channel canvas (part is already there), then there will be an exit to % of its base up, just to one of the following designated resistance zones. If the market as a whole is negative, then from this consolidation there may be another wave of decline. The zones are shown in the idea. The asset itself was dumped after a local listing pump by -91%, these are not the minimum values for assets of such liquidity. But, sometimes if the market as a whole looks bullish, then the trend of the wrapper is reversed, this is an acceptable decline, but not minimal. Consider this in your money management and work tactics.26 06 2025 the price was lowered again to the support of the horizontal channel on this "fresh cryptocurrency". A -91% decrease for cryptocurrencies of such liquidity is very little. 94-96%, as a rule, is where the price comes to on most similar cryptocurrencies, with rare exceptions. Although, if the wedge breaks through, there will be a movement back to the resistance of the horizontal channel and the median of the descending channel (red dotted line). But, this will still be a summer consolidation zone. The biggest trump card in this cryptocurrency is a successful imitation legend - tokenization of assets. It is rational for traders to work from zones and on a breakthrough. If you do not have a trader's approach, then collect in parts with free money, but from a smaller amount to a larger one.14 09 2025 the first local target +90% after breaking through the wedge in the horizontal channel is reached, exactly to the level of 0.42. A rollback after this and the price clamping at the specified channel levels of 0.277 and 0.344 (support of the internal channel and the median). The entire logic of further price movement is as before. Work in the range of the horizontal channel, and when leaving it upwards (cup, movements to the previous consolidation zones) or downwards (entry into the capitulation zone and shaking out).
سیگنال آلفا کریپتو
⚜ $ Lumia/USDT 🛒 Purchase range: 0.30 - 0.33 ⚡️Targtes: 🎯t1: 0.36 🎯T2: 0.42 🎯t3: 0.48 🎯T4: 0.56 🎯T5: 0.66 🎯t6: 0.82 🔺️ Loss limit: 0.25 💵 Suggested Balance: 5 % Capital 🔥 @signal_alpha 🔥

fuattceber

Absolutely not investment advice. When we examine the parity of LUMIA usdt Trend Bottom Locations, the support zones are in the graph. For the middle term, it should be collected from these regions and then sold in a fragmented way from the areas specified with the yellow line above. It does not express clarity, let's mention again

Ertugrul27

Hello, We can see a clear CUP & HANDLE pattern formed and completed for Lumia. We are now ready to head up to 2/3$ in Q1 2025. NFA Cheers

growmoreumc

LumiaUsdt 30% Up Target. FIBONACCI Bearish Retracement, Trendline + Fair value gaps.
Disclaimer
Any content and materials included in Sahmeto's website and official communication channels are a compilation of personal opinions and analyses and are not binding. They do not constitute any recommendation for buying, selling, entering or exiting the stock market and cryptocurrency market. Also, all news and analyses included in the website and channels are merely republished information from official and unofficial domestic and foreign sources, and it is obvious that users of the said content are responsible for following up and ensuring the authenticity and accuracy of the materials. Therefore, while disclaiming responsibility, it is declared that the responsibility for any decision-making, action, and potential profit and loss in the capital market and cryptocurrency market lies with the trader.