
LRC
Loopring
| تریدر | نوع سیگنال | حد سود/ضرر | زمان انتشار | مشاهده پیام |
|---|---|---|---|---|
 qw12basedRank: 865 | خرید | حد سود: تعیین نشده حد ضرر: تعیین نشده | 12/18/2025 | |
 Alpha-GoldFXRank: 32441 | خرید | حد سود: تعیین نشده حد ضرر: تعیین نشده | 12/13/2025 |
Price Chart of Loopring
سود 3 Months :
سیگنالهای Loopring
Filter
Sort messages by
Trader Type
Time Frame

mastercrypto2020
RLCUSDT LONG SIGNAL

📢 Trade Setup – LRC/USDT 📈 Position: LONG 💰 Entry Zone: 0.04957 – 0.05050 (Reclaim & retest of broken descending trendline) 🛑 Stop-Loss: 0.04750 (Invalidation below recent higher low) 🎯 Take-Profit Targets: • TP1: 0.05184 • TP2: 0.05361 • TP3: 0.05584 TP4, 05828 📊 Timeframe: 1H ⚖️ Risk/Reward: Favorable ⚙️ Leverage: Spot or low leverage (max 3×)5 🧠 Technical Context: Price has broken above the descending trendline after a prolonged downtrend. A higher low is formed, indicating short-term bullish structure. Current price action shows a successful retest of the breakout zone. Targets are aligned with key resistance and liquidity levels marked on the chart. 📌 Trade Management: ✔️ Take partial profit at TP1 ✔️ Move SL to Break Even after TP1 ✔️ Trail SL below higher lows ✔️ Risk max 1–2% per trade #LRCUSDT #Crypto #Altcoins #TradingView #TechnicalAnalysis

CryptoAnalystSignal
آماده پرواز LRC/USDT: سطوح کلیدی حمایت و اهداف صعودی پیش رو!

#LRC The price is moving in a descending channel on the 1-hour timeframe. It has reached the lower boundary and is heading towards breaking above it, with a retest of the upper boundary expected. We have a downtrend on the RSI indicator, which has reached near the lower boundary, and an upward rebound is expected. There is a key support zone in green at 0.0514. The price has bounced from this level multiple times and is expected to bounce again. We have a trend towards stability above the 100-period moving average, as we are moving close to it, which supports the upward movement. Entry price: 0.0517 First target: 0.0536 Second target: 0.0546 Third target: 0.0561 Stop loss: Below the support zone in green. Don't forget a simple thing: capital management. For inquiries, please leave a comment. Thank you.#LRC First target: 0.0536 Reached Second target: 0.0546 Reached#LRC First target: 0.0536 Reached Second target: 0.0546 Reached Third target: 0.0561 Reached

iMoneyTeam
LRC Buy/Long Signal (4H)

We have a liquidity pool on the chart that, if swept, could allow the price to rebound strongly upwards. There are two lows, with buyer stop-losses placed just below them. We have two entry points, which can be entered using a DCA (Dollar-Cost Averaging) approach. Targets are marked on the chart. If you would like us to analyze a coin or altcoin for you, first like this post, then comment the name of your altcoin below.After reaching the entry zones, it pumped over 8% and hit the first target
qw12based
LRCUSDT
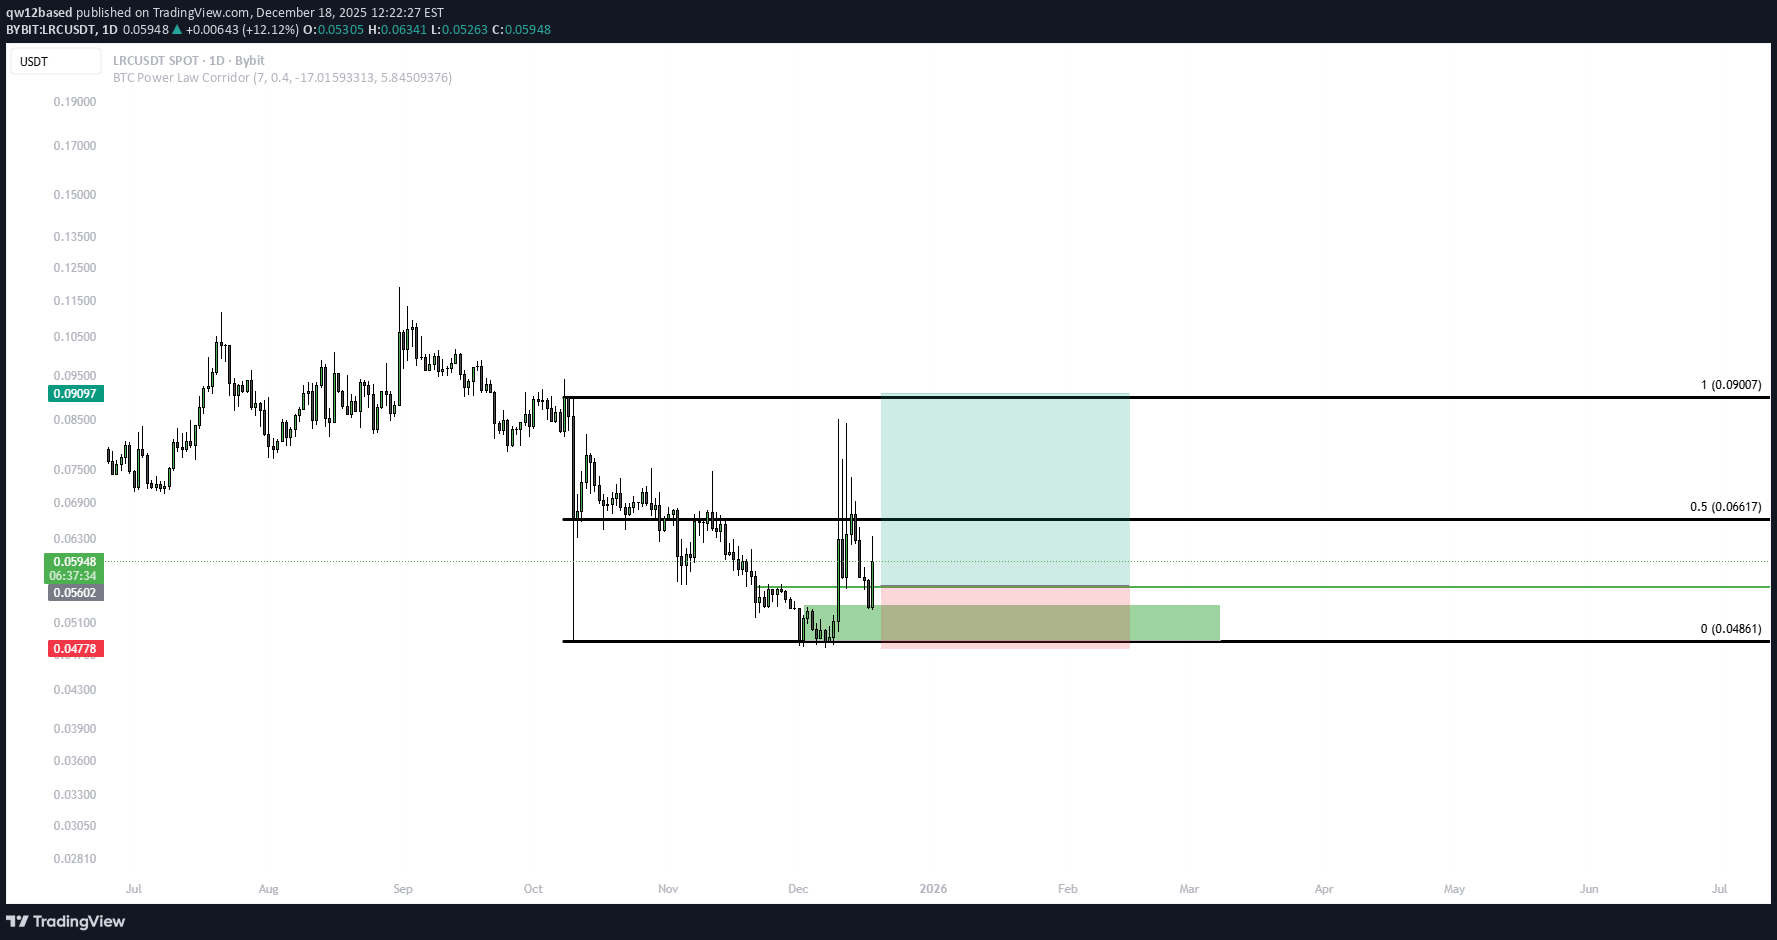
LRCUSDT It's just an idea please don't take it serious. late entry

asilturk
LRC Pozitif Ayrisabilir
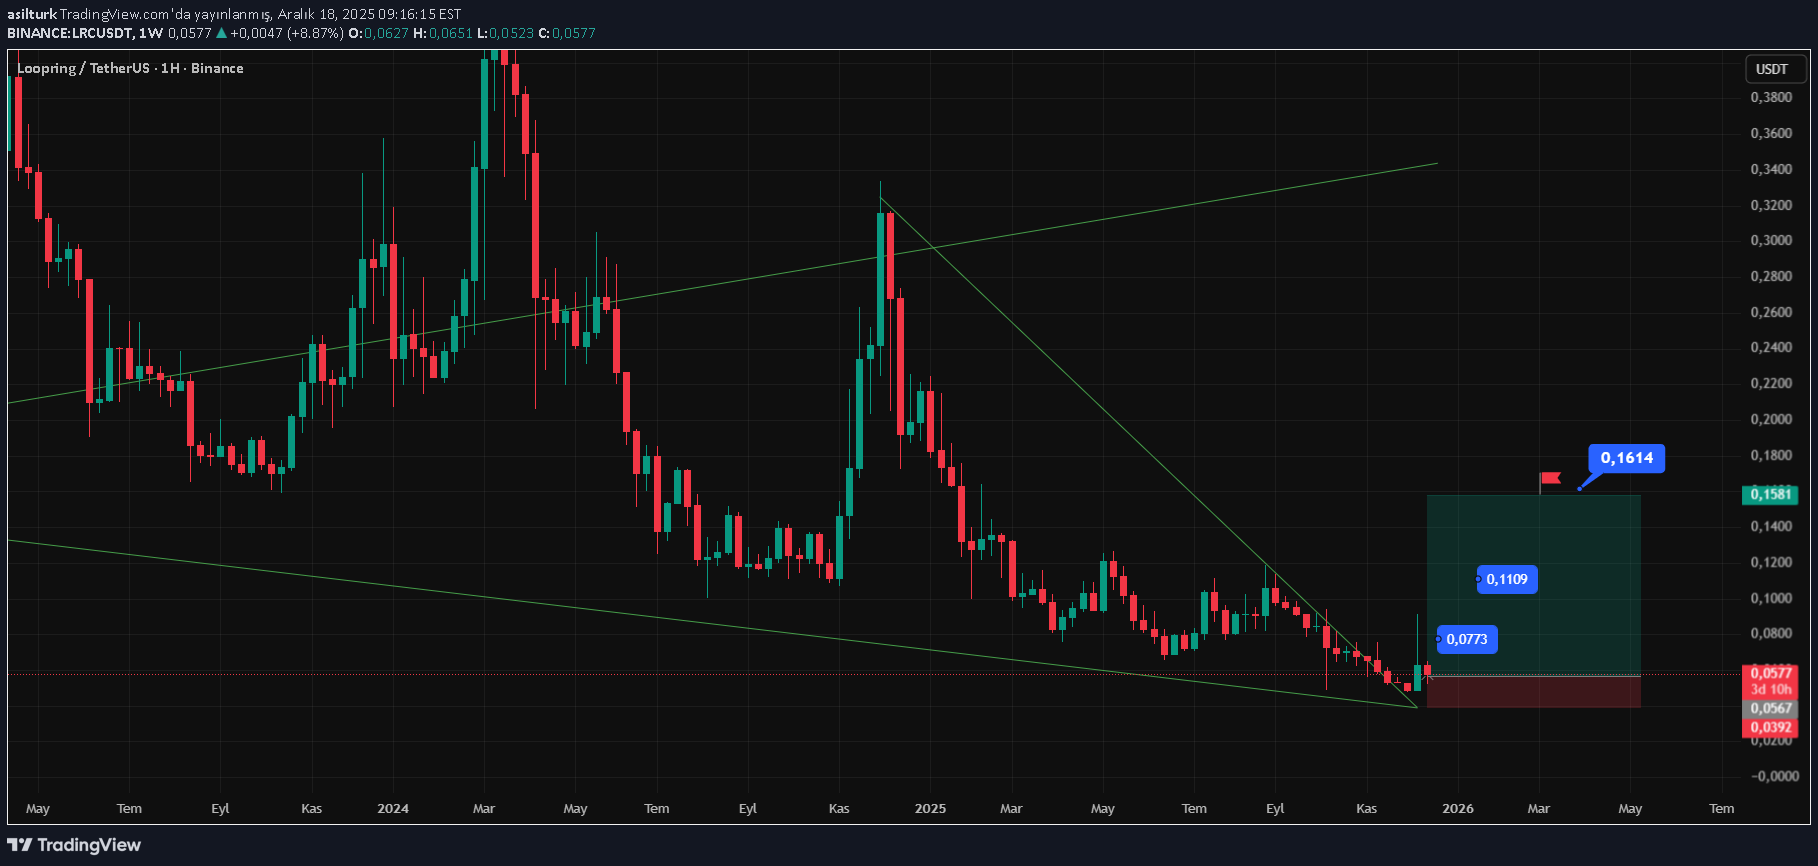
Loopring (LRC) is one of the most established and technically advanced Layer-2 scaling solutions on the Ethereum blockchain. Its main goal is to speed up decentralized exchanges (DEX) and reduce transaction costs (gas fees) to almost zero. As of now, its price is 0.057 cents, it has 1.37 billion shares in circulation, the volume is over 20 million dollars, the formation DUK needs to be worked on, we can partially say that the recovery and correction has been completed in technical terms, serial movements above 2% may occur in the platform concentration value.
Alpha-GoldFX
سقوط LRCUSDT به پایان میرسد؟ این الگوی قدرتمند نوید صعود ۹۰ درصدی!
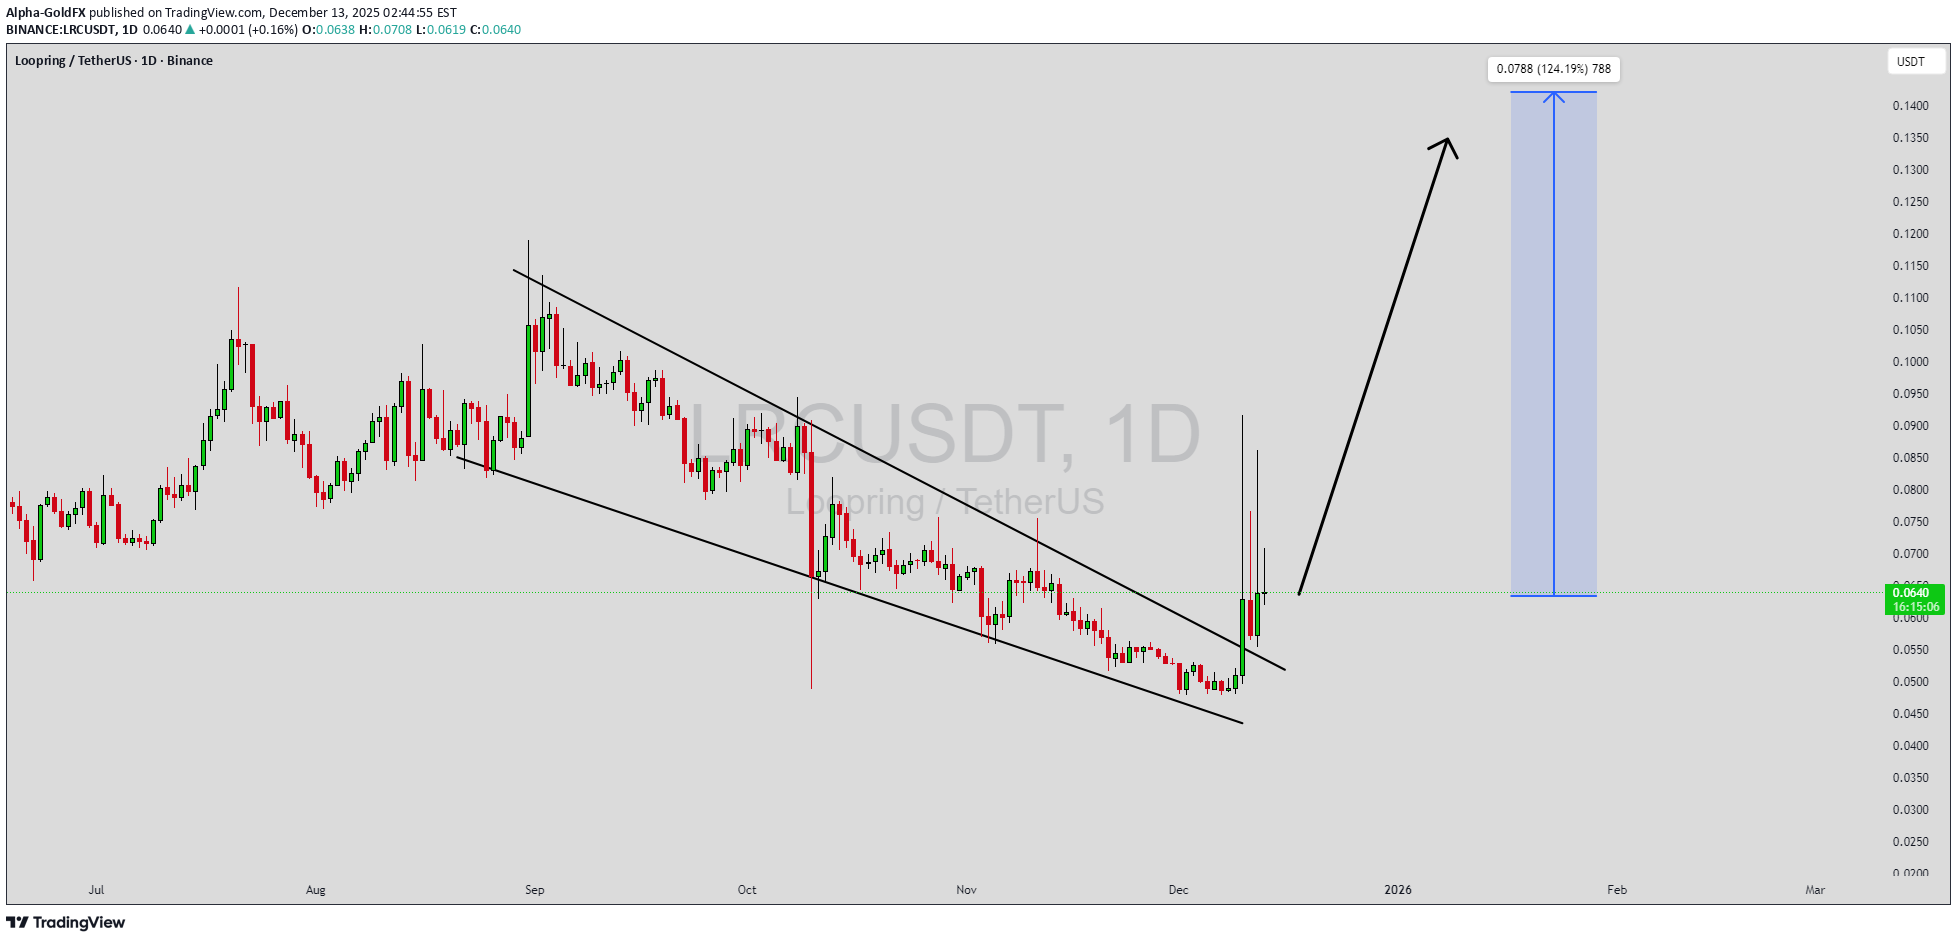
LRCUSDT is forming a clear falling wedge pattern, a classic bullish reversal signal that often indicates an upcoming breakout. The price has been consolidating within a narrowing range, suggesting that selling pressure is weakening while buyers are beginning to regain control. With consistent volume confirming accumulation at lower levels, the setup hints at a potential bullish breakout soon. The projected move could lead to an impressive gain of around 90% to 100% once the price breaks above the wedge resistance. This falling wedge pattern is typically seen at the end of downtrends or corrective phases, and it represents a potential shift in market sentiment from bearish to bullish. Traders closely watching LRCUSDT are noting the strengthening momentum as it nears a breakout zone. The good trading volume adds confidence to this pattern, showing that market participants are positioning early in anticipation of a reversal. Investors’ growing interest in LRCUSDT reflects rising confidence in the project’s long-term fundamentals and current technical strength. If the breakout confirms with sustained volume, this could mark the start of a fresh bullish leg. Traders might find this a valuable setup for medium-term gains, especially as the wedge pattern completes and buying momentum accelerates. ✅ Show your support by hitting the like button and ✅ Leaving a comment below! (What is your opinion about this Coin?) Your feedback and engagement keep me inspired to share more insightful market analysis with you!

c_views
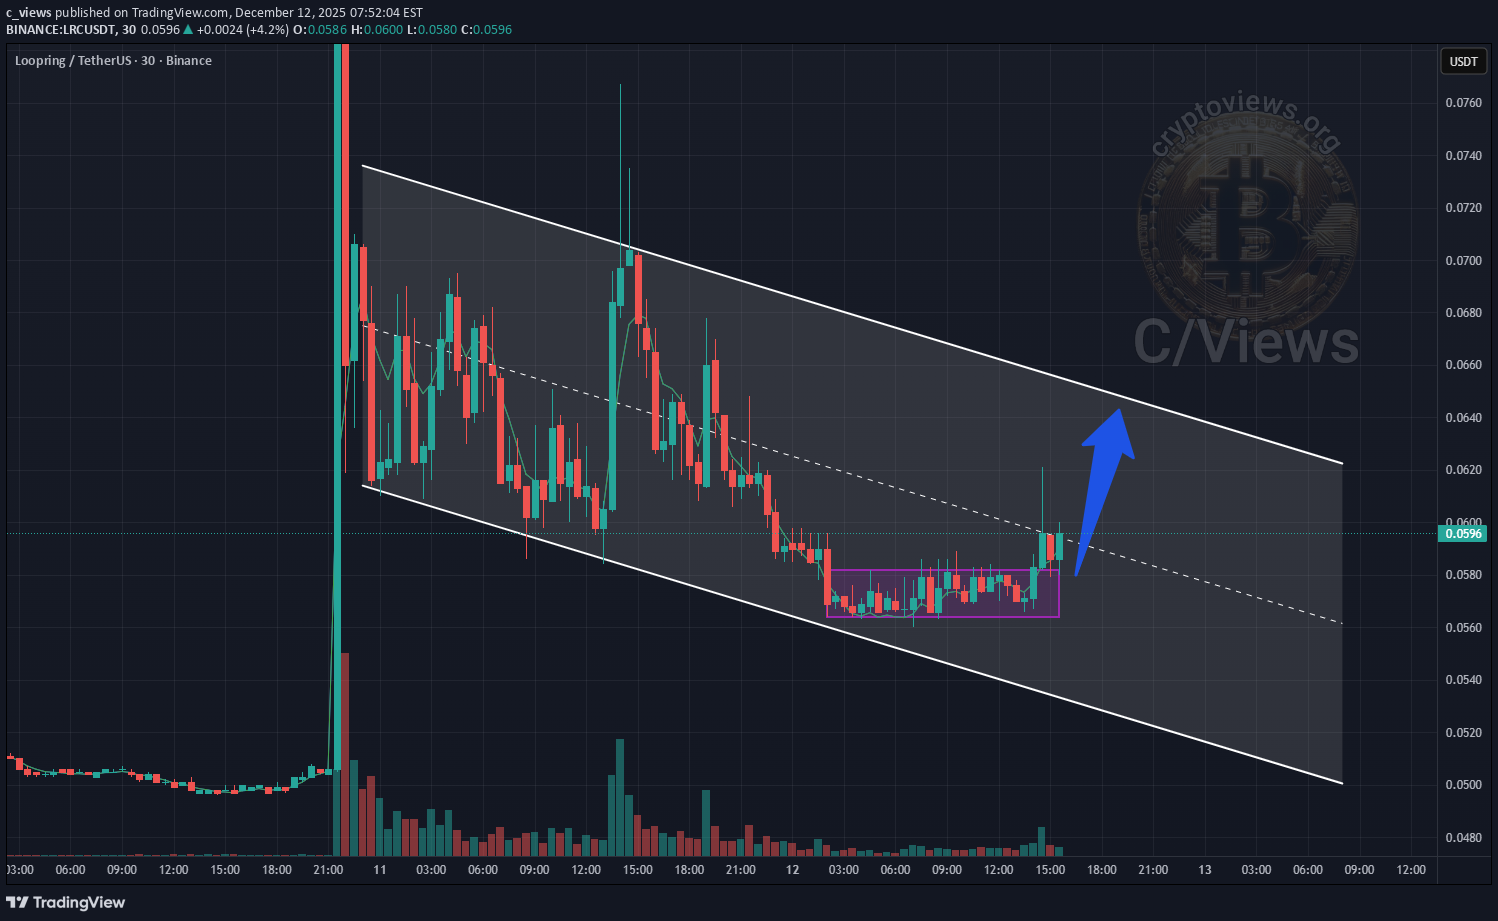
SIGNOLL
تحلیل تکنیکال LRC: فرصت خرید بزرگ در محدوده فیبوناچی!
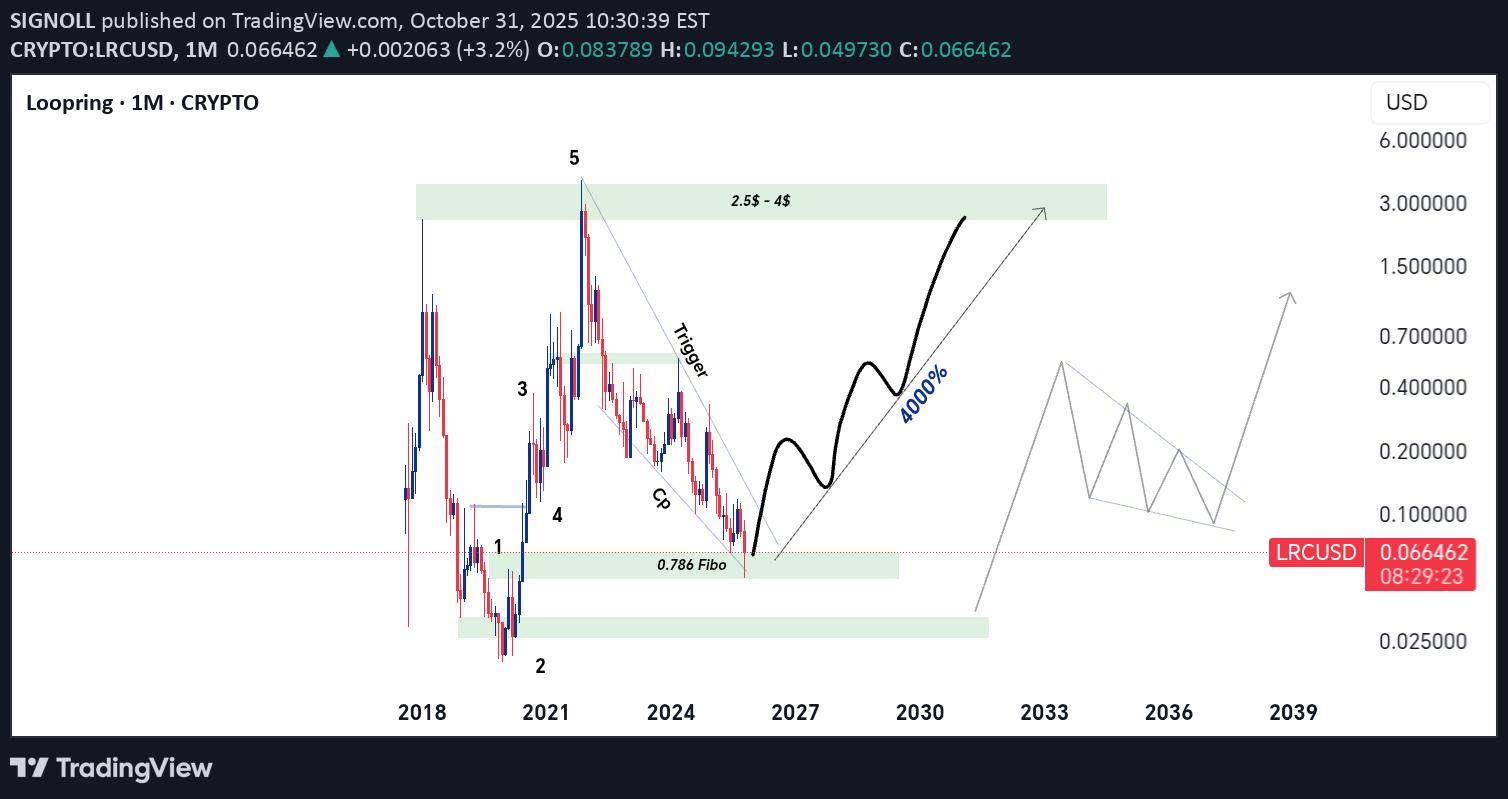
According to its chart and technical analysis, this currency has a very good growth condition, and is currently in the support and valid range of Fibo

Me1132
شکست مقاومت چند ساله لیرپرینگ (LRC): آیا رشد چند صد درصدی در راه است؟

Loopring managed to break its multi-year resistance a few hours ago and we are expecting a growth of several hundred percent, just keep an eye on it.

mahesh56a
LRC/USDT

LRC is moving inside the channel pattern in weekly , Now it is at support zone from where it can give amazing move (140% nearly) if the altcoins gain volume in market-cap . and at the same time Bitcoin dominance is decreasing and altcoins dominance is started increasing , so look on all the altcoins and follow proper risk management , it has very good chances to move UP side but first we have to protect the down side , where risk management comes into game .
Disclaimer
Any content and materials included in Sahmeto's website and official communication channels are a compilation of personal opinions and analyses and are not binding. They do not constitute any recommendation for buying, selling, entering or exiting the stock market and cryptocurrency market. Also, all news and analyses included in the website and channels are merely republished information from official and unofficial domestic and foreign sources, and it is obvious that users of the said content are responsible for following up and ensuring the authenticity and accuracy of the materials. Therefore, while disclaiming responsibility, it is declared that the responsibility for any decision-making, action, and potential profit and loss in the capital market and cryptocurrency market lies with the trader.