
LQTY
Liquity
| تریدر | نوع سیگنال | حد سود/ضرر | زمان انتشار | مشاهده پیام |
|---|---|---|---|---|
No results found. | ||||
Price Chart of Liquity
سود 3 Months :
سیگنالهای Liquity
Filter
Sort messages by
Trader Type
Time Frame
شکست مثلث نزولی LQTY/USDT: آماده سقوط به سطوح پایینتر شوید!

The weekly chart shows a clear descending triangle formation, characterized by a series of lower highs pressing toward a flat horizontal support zone. This type of structure is typically considered a bearish continuation pattern, reflecting consistent selling pressure. Recently, price has broken below the horizontal support , confirming the triangle breakdown and signaling potential continuation to the downside. The market failed to reclaim the support area, which now acts as resistance. Key technical points: Well-defined descending triangle with lower highs and horizontal base. Support has been broken, indicating seller dominance. Retest/rejection from the former support zone strengthens the bearish outlook. Downside Targets: $0.31–$0.27 $0.20–$0.17 As long as the price remains below the broken support zone, the bearish continuation scenario remains the dominant expectation.1 target reach. DONE.

VIPCryptoVault
شکست روند نزولی 4 ماهه LQTY در بازار نزولی: آیا زمان صعود فرا رسیده است؟
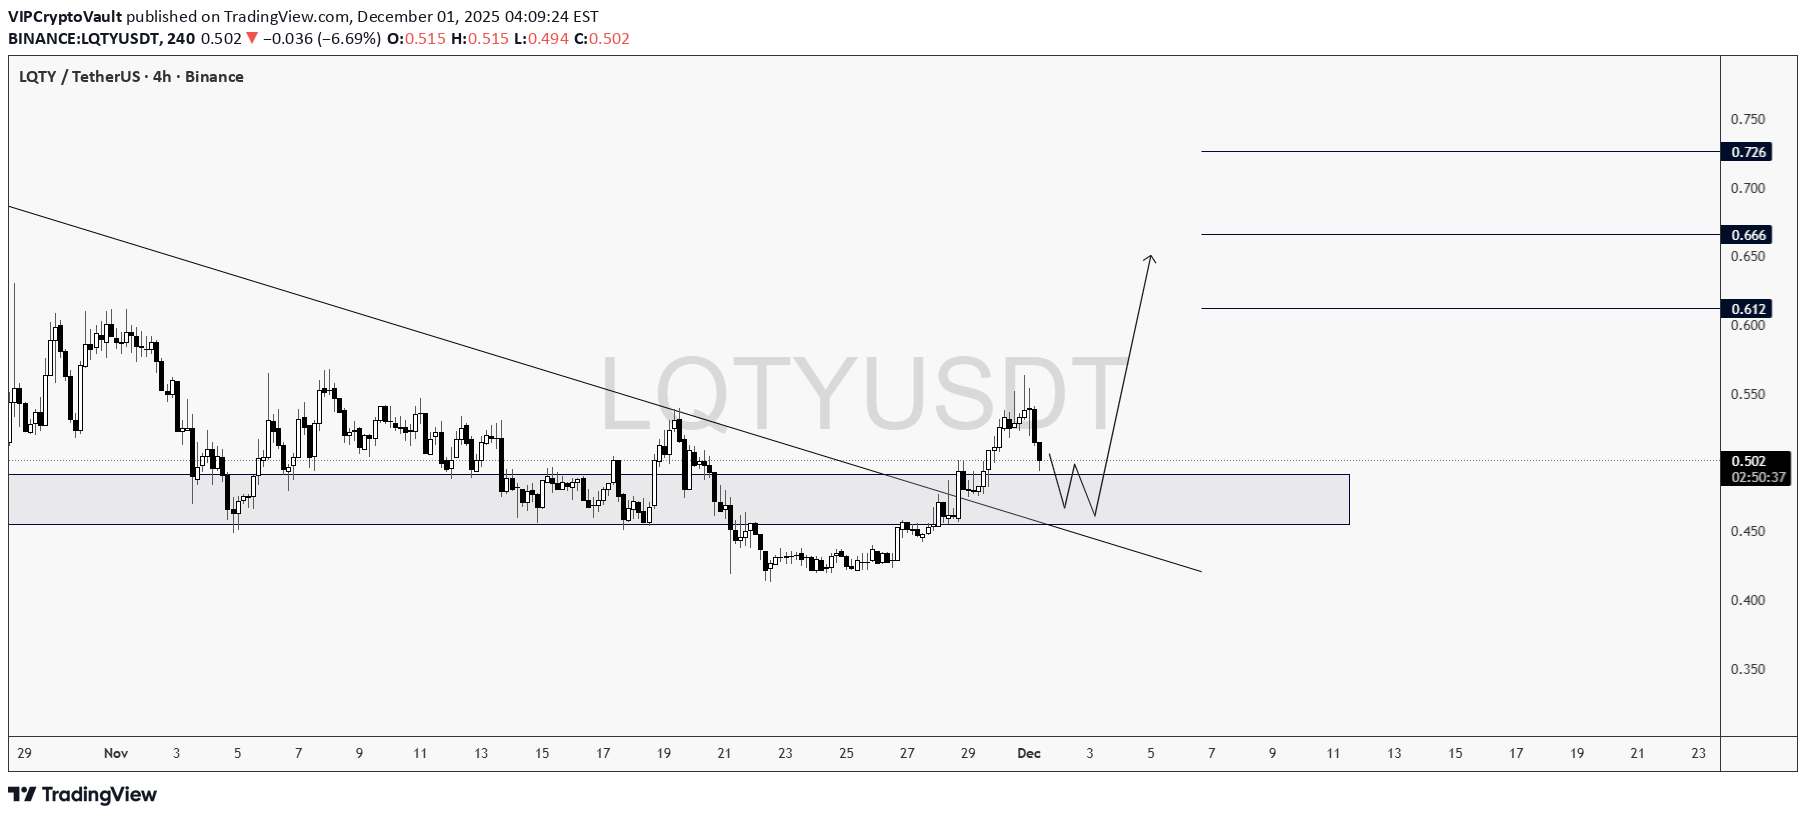
So LQTY just broke a 4 months downtrend in a bear market where almost all other USDT pairs are bleeding. That tells there is very good momentum that could drive the price higher to the marked targets. Good Luck!

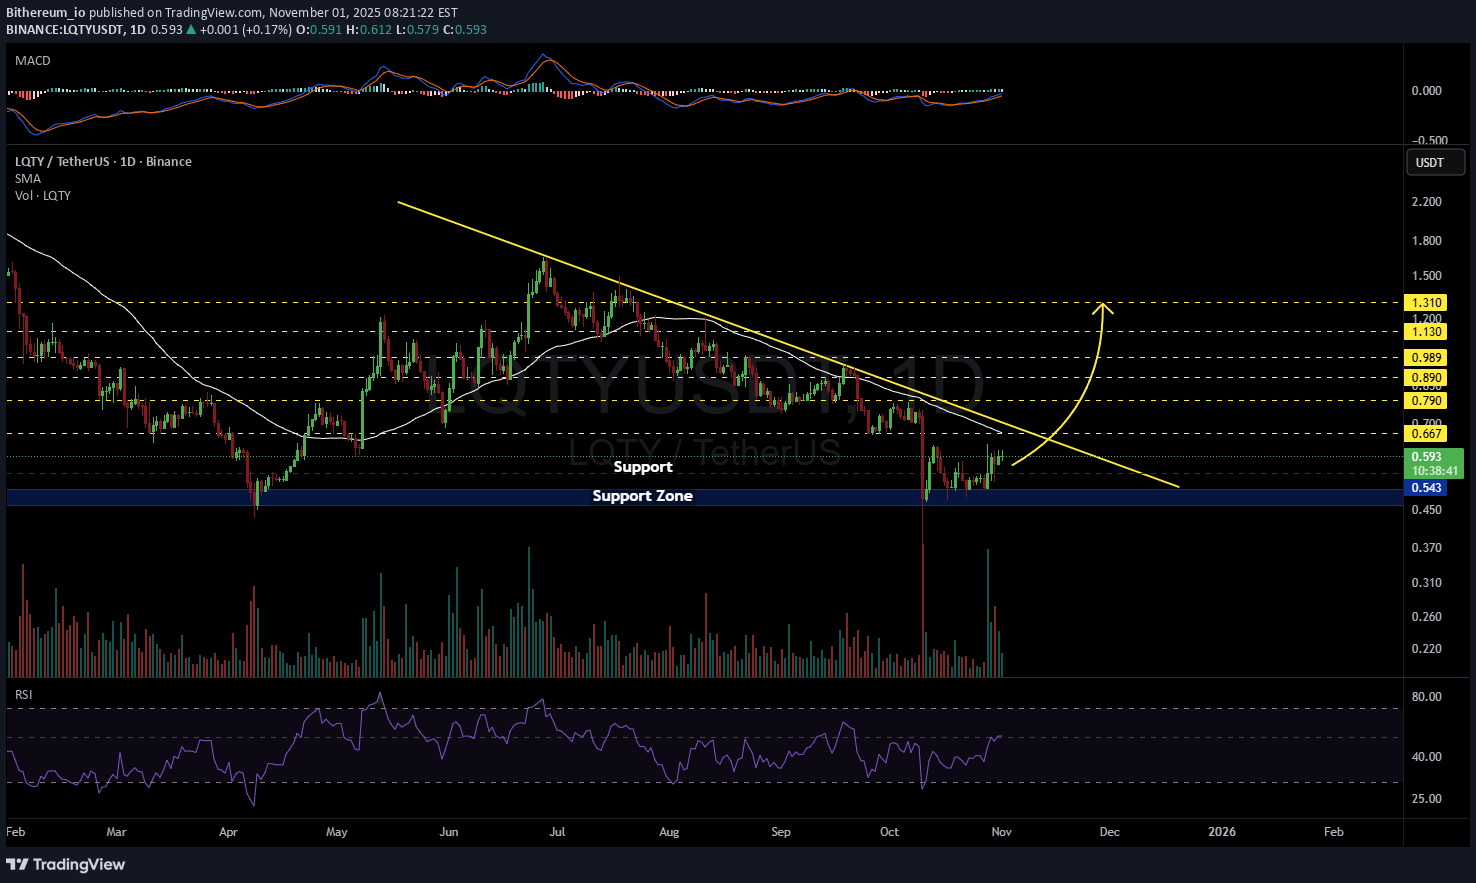
Bithereum_io
تحلیل روزانه LQTY: نشانههای صعود قوی و اهداف جذاب قیمت (آیا زمان خرید است؟)
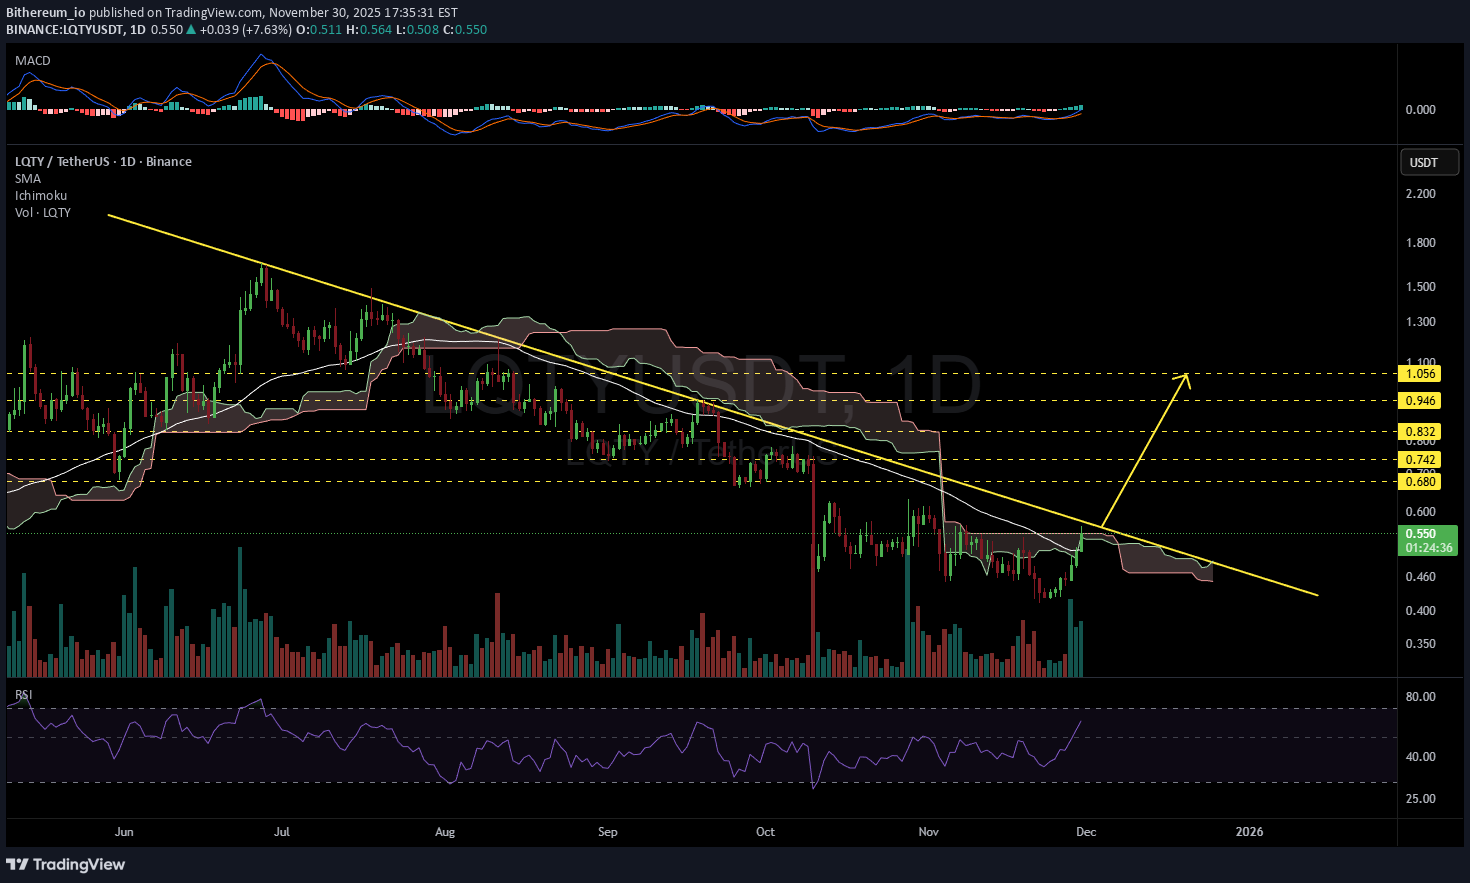
#LQTY daily chart looks promising. RSI and MACD are showing potential bullish momentum. Price has broken above the daily SMA50 and the Ichimoku cloud, but the daily candle hasn’t closed yet. Volume has increased and price has reached the descending resistance. The structure is bullish. In case of a breakout above the descending resistance, the potential targets are: 🎯 $0.680 🎯 $0.742 🎯 $0.832 🎯 $0.946 🎯 $1.056 ⚠️ Always remember to protect your capital with a proper stop-loss and disciplined risk management.
TraderNoki
برنامه بلندمدت خرید $LQTY: ورود در ۰.۵۰ و حد ضرر ۰.۴۴۳
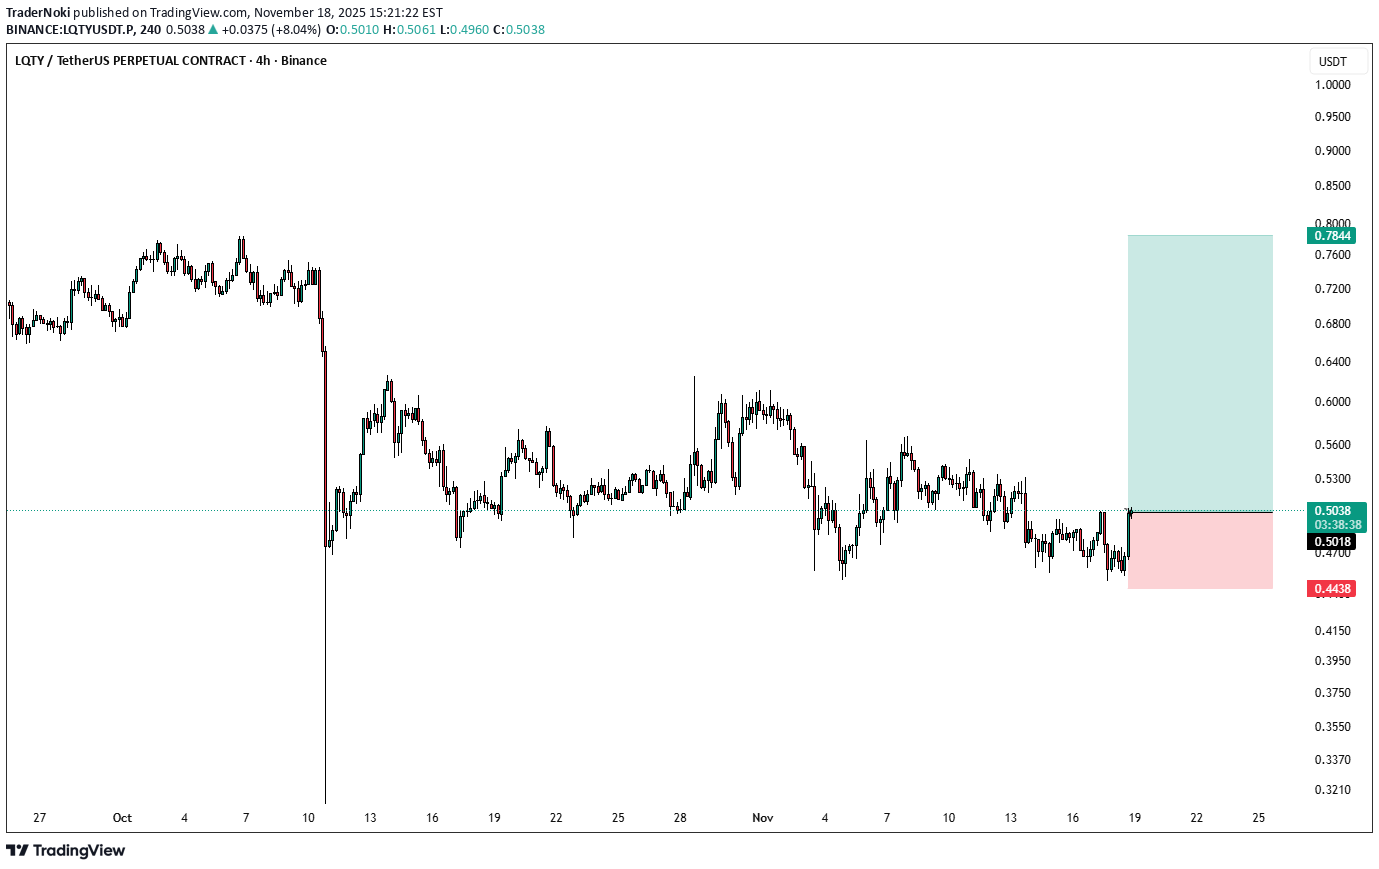
$LTQY going long. Entry $0.50 and SL 0.443. Like the 4h close on this coin.Up 4.4%. With the current state of the market I advice to take profits aggresively. I took 40% tp and moved my SL breakevenClosed after 7% move

incawarrior13
پیشبینی انفجار قیمت LQTY: زمان خرید (لانگ) فرا رسید!
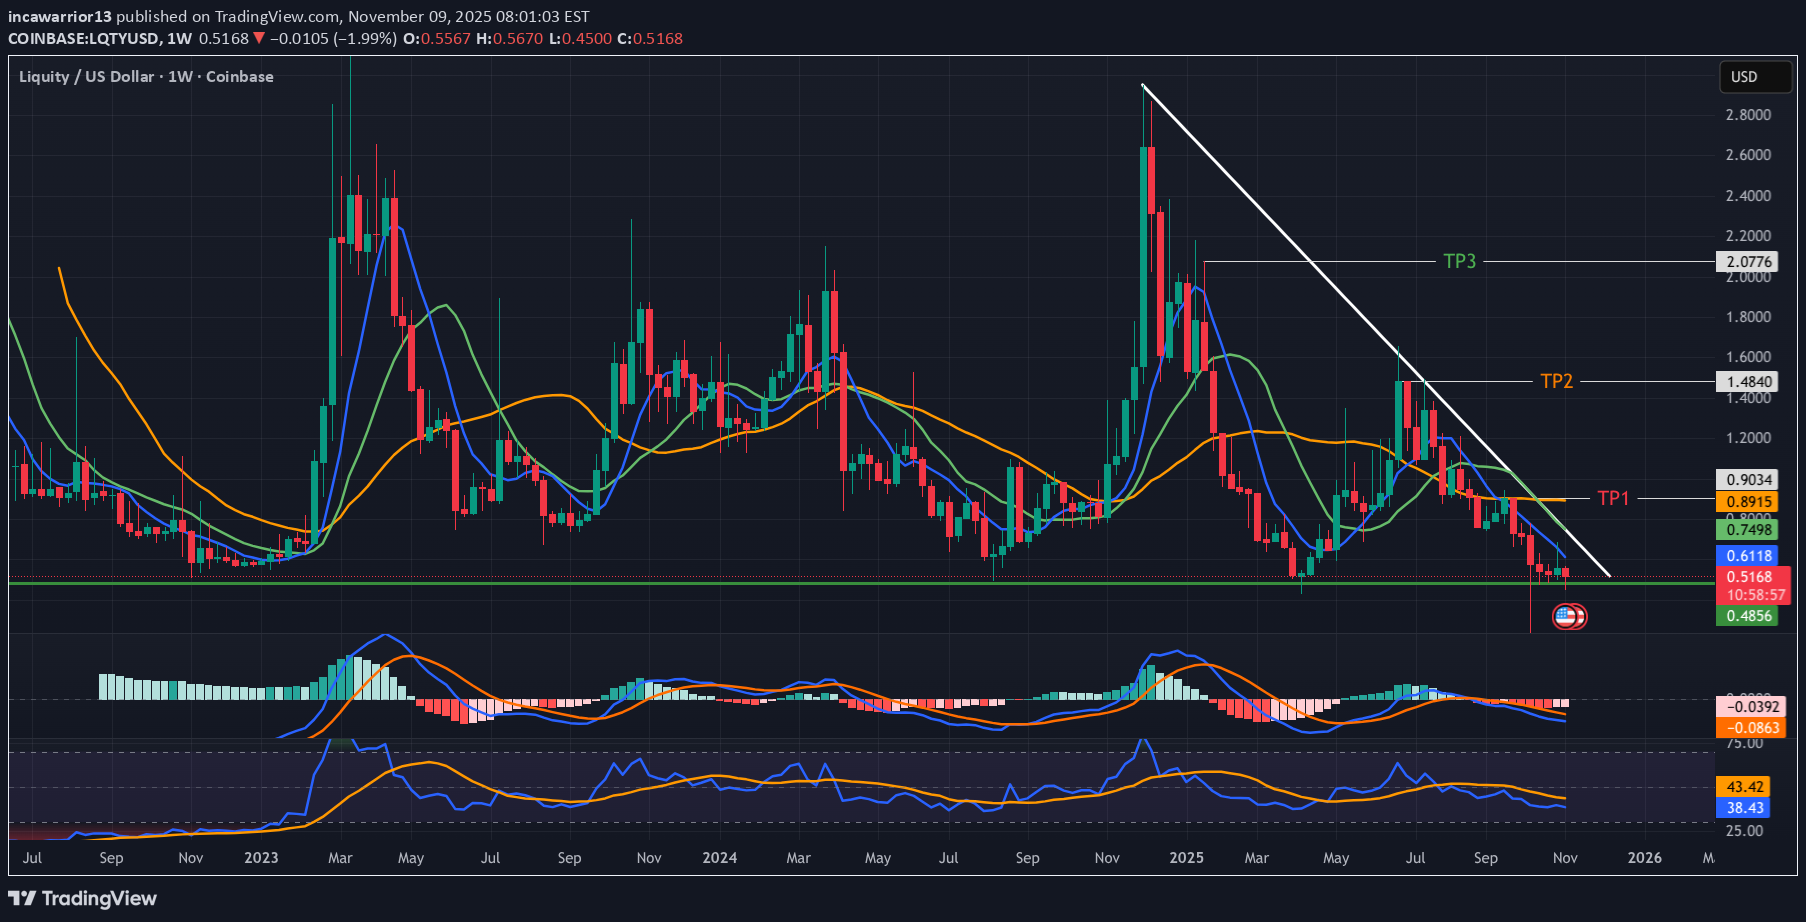
rsi nearing bottom . wait for weekly closing candle.wait for macd cross. wont be a quick rise but rise it will. another confluence would be break of trendline.have the 50 100 200 MA.prime for good gains .not much loss as I see it will not go down much further.
Bithereum_io
تحلیل روزانه LQTY: آیا شکست مقاومت، قیمت را به مرز ۱.۳۱ دلار میرساند؟
#LQTY is moving toward the descending resistance on the daily chart, with a noticeable increase in trading volume. In case of a breakout above the daily SMA50 and the descending resistance, the potential upside targets are: 🎯 $0.667 🎯 $0.790 🎯 $0.890 🎯 $0.989 🎯 $1.130 🎯 $1.310 ⚠️ Always remember to use a tight stop-loss and maintain proper risk management.

CryptoWithJames
تحلیل شگفتانگیز LQTY: احتمال جهش ۱۰۰ درصدی تا ۱.۱۱ دلار!
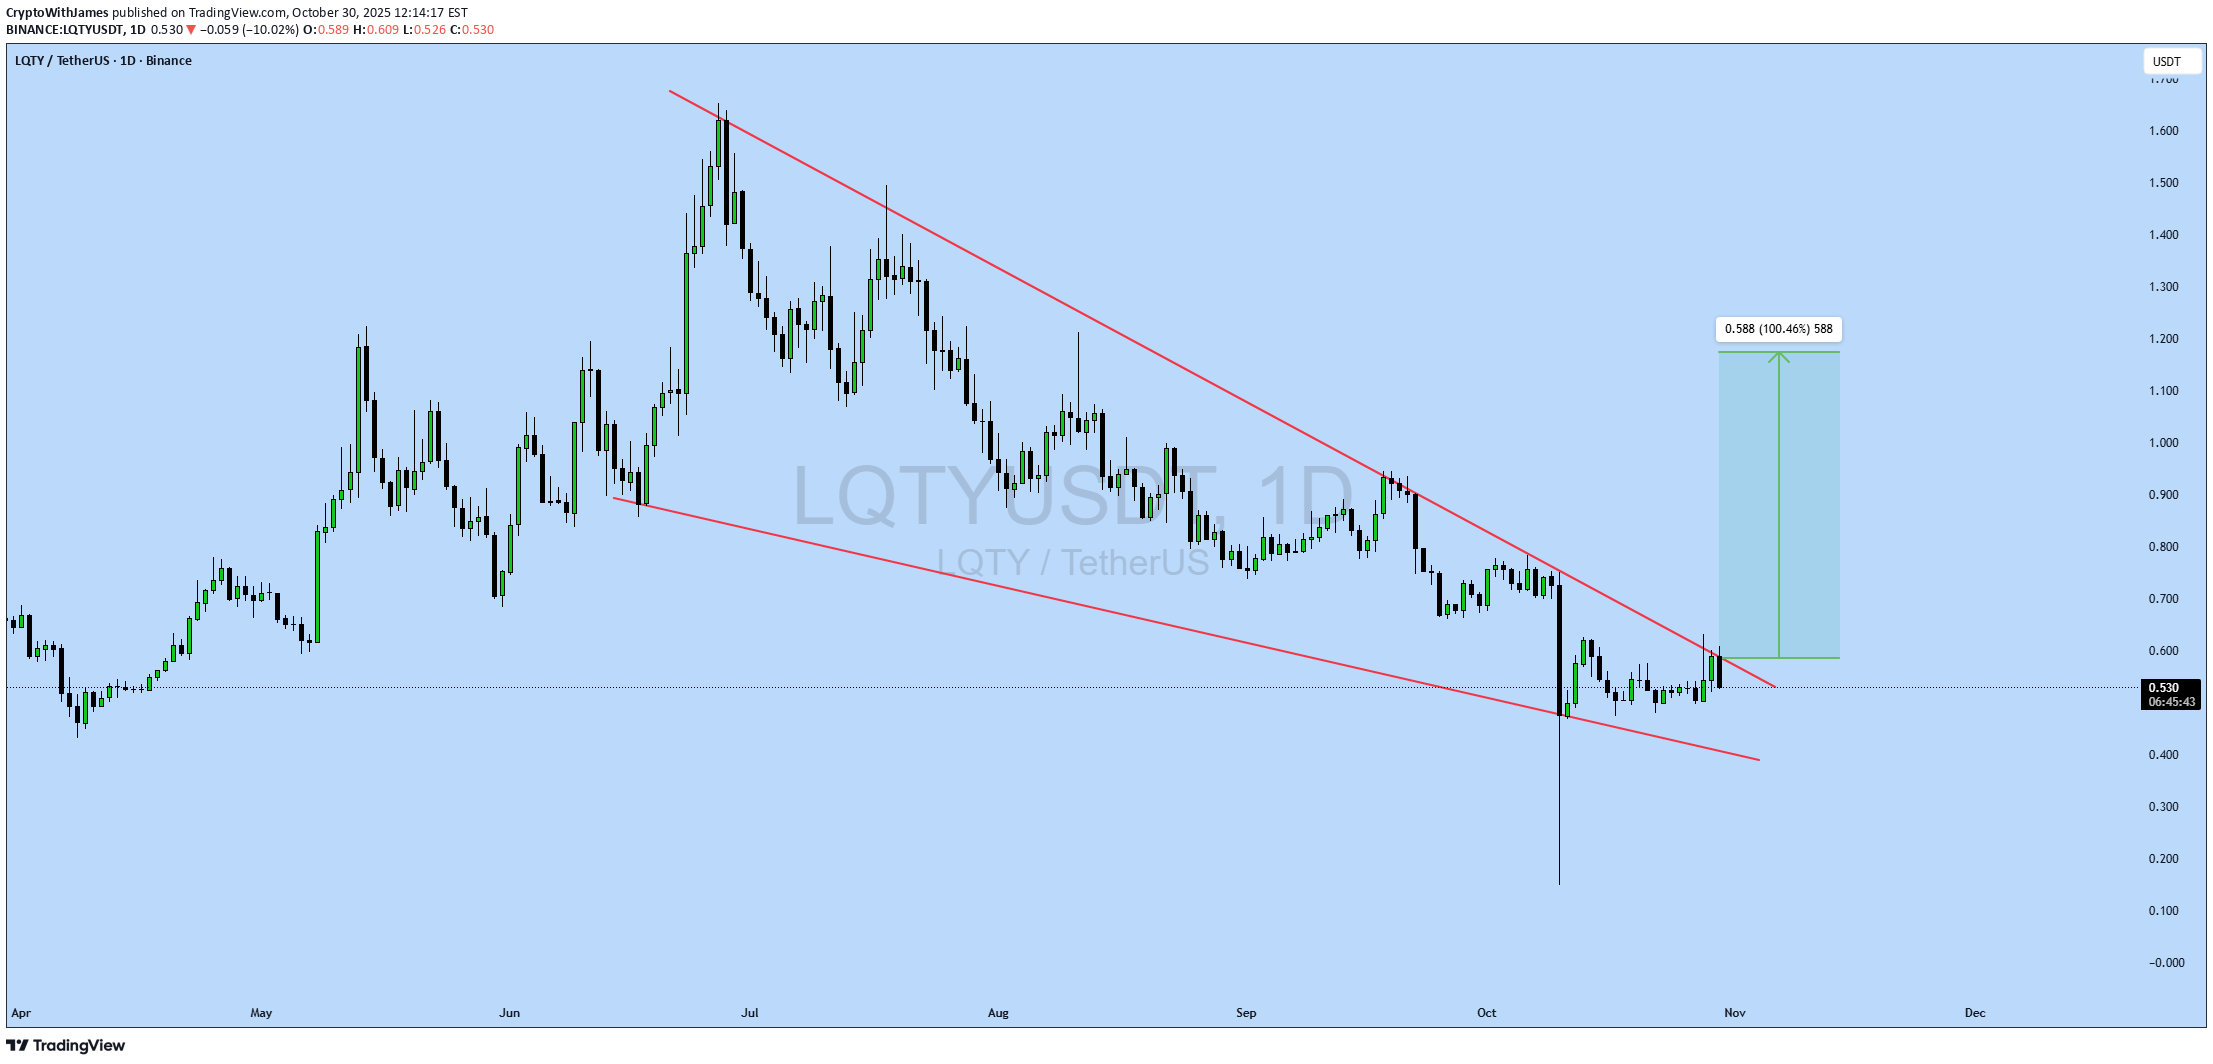
#LQTY UPDATE LQTY Technical Setup Pattern: Bullish Falling Wedge Current Price: $0.530 Target Price: $1.118 Target % Gain: 100.46% $LQTY is breaking out of a bullish falling wedge pattern on the 1D timeframe. The current price is $0.530 with a projected target near $1.118, offering around 100% potential upside. The breakout suggests growing bullish momentum and potential for further continuation. Time Frame: 1D Risk Management Tip: Always use proper risk management.

BandForBands
پیشبینی انفجاری LQTY: آیا فرصت سود 400 درصدی در راه است؟
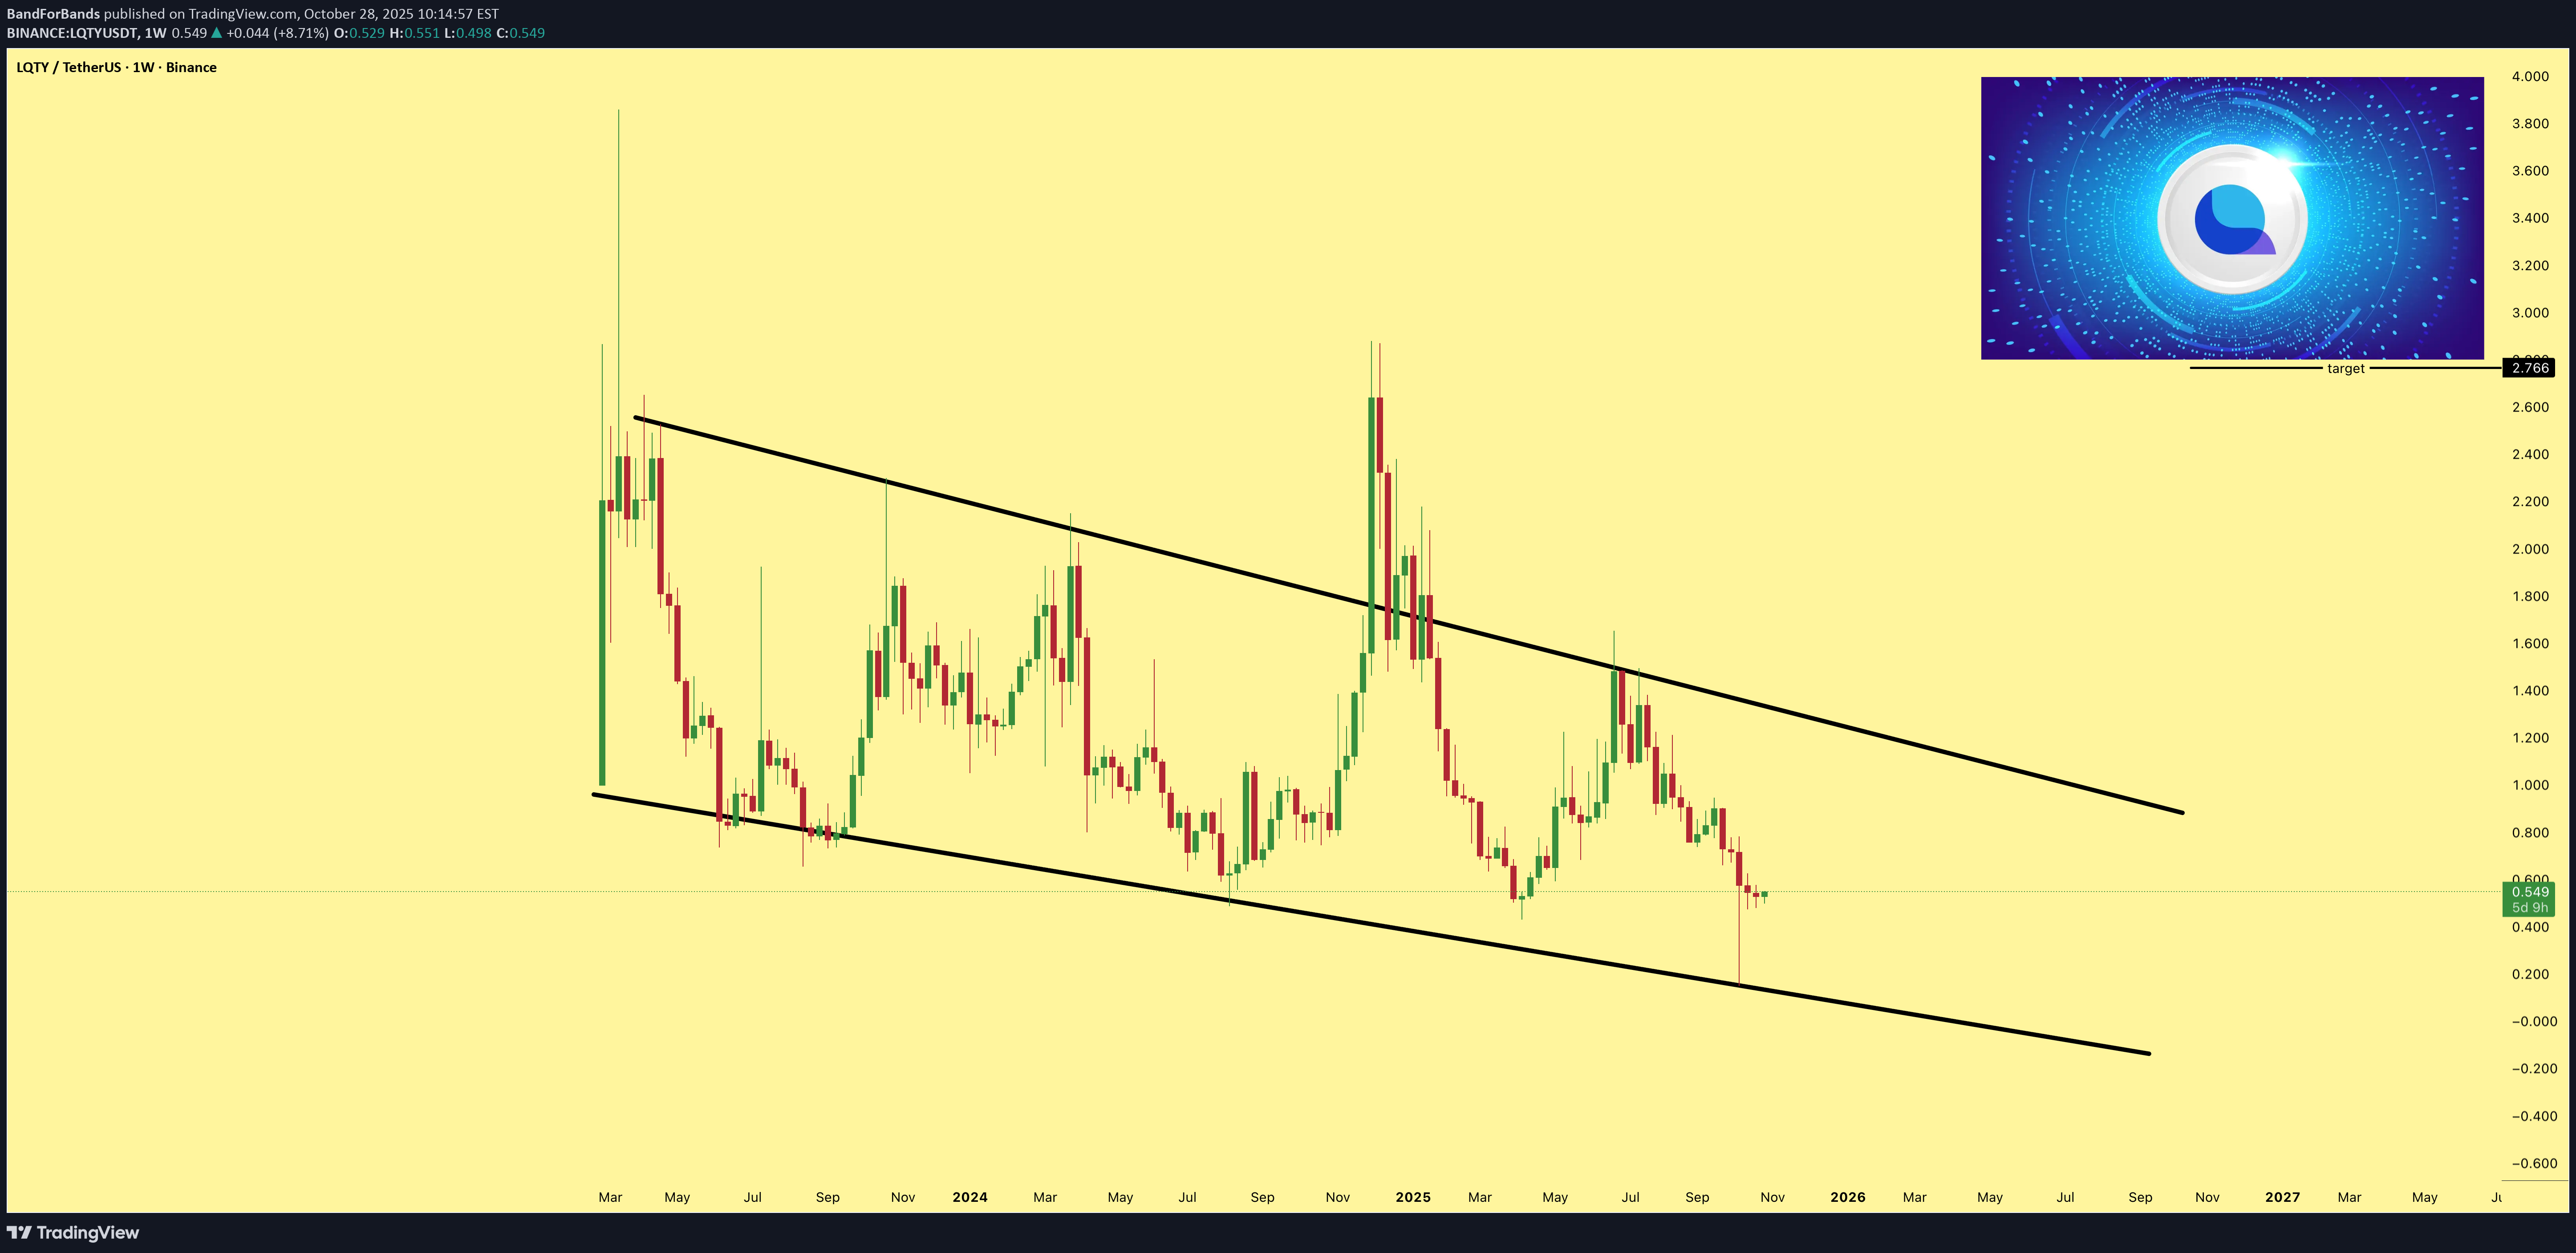
$LQTY is trading within a descending channel pattern, showing strong potential for a bullish reversal. A confirmed breakout from the upper trendline could lead to an estimated 400% upside from the current price, supported by improving momentum indicators.

Cryptojobs
$LQTY - price keep consolidating above main support & trend test
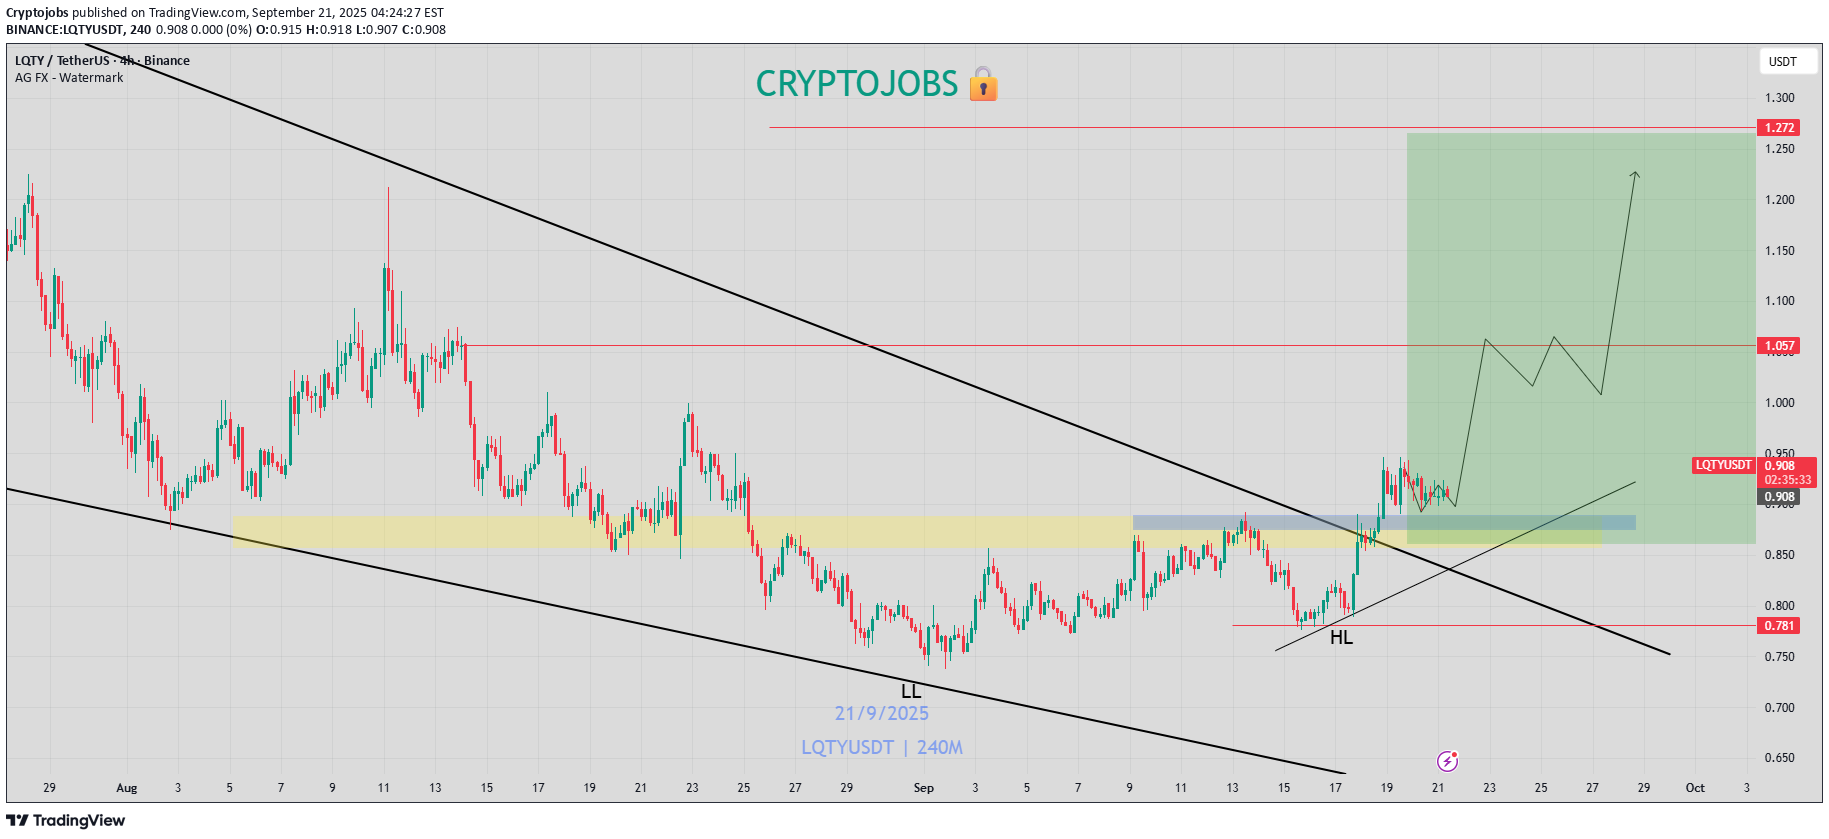
$LQTY - price keep consolidating above main support & trend test HTF 📈 Looks good!📈
Cryptojobs
$LQTY - 90-Day Falling Wedge Breakout!
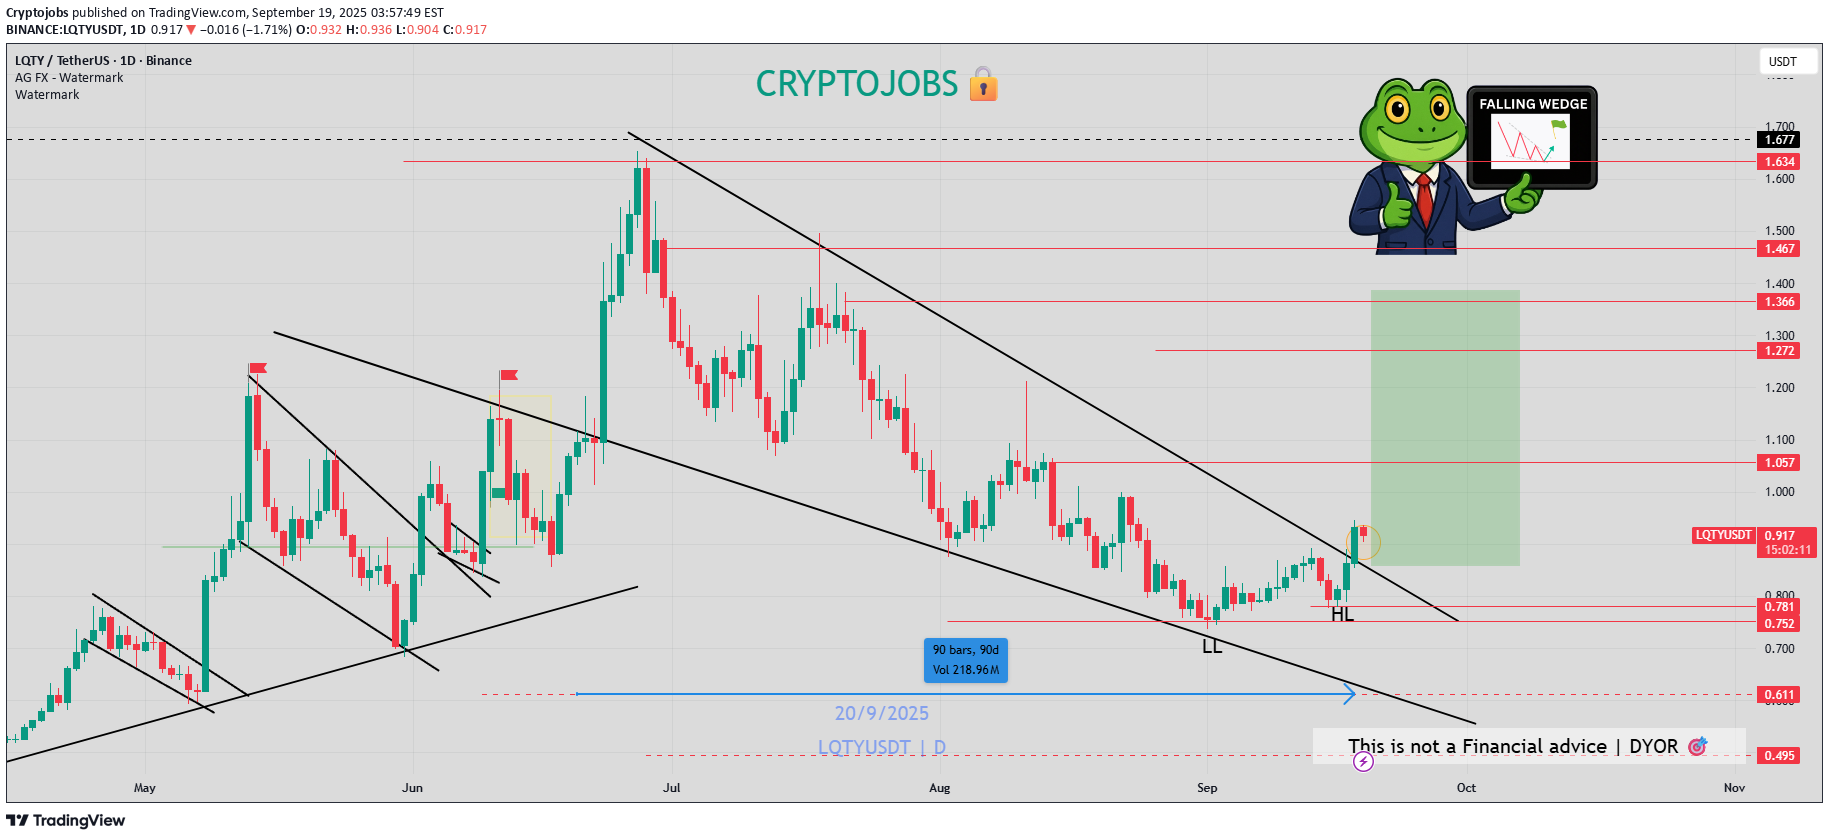
$LQTY - 90-Day Falling Wedge Breakout! ✅ After 90 days trapped in a falling wedge, we finally got the breakout! 💥 Bullish vibes kicking in for next week? 📈 Follow for more 🐸
Disclaimer
Any content and materials included in Sahmeto's website and official communication channels are a compilation of personal opinions and analyses and are not binding. They do not constitute any recommendation for buying, selling, entering or exiting the stock market and cryptocurrency market. Also, all news and analyses included in the website and channels are merely republished information from official and unofficial domestic and foreign sources, and it is obvious that users of the said content are responsible for following up and ensuring the authenticity and accuracy of the materials. Therefore, while disclaiming responsibility, it is declared that the responsibility for any decision-making, action, and potential profit and loss in the capital market and cryptocurrency market lies with the trader.