
KSM
Kusama
| تریدر | نوع سیگنال | حد سود/ضرر | زمان انتشار | مشاهده پیام |
|---|---|---|---|---|
No results found. | ||||
Price Chart of Kusama
سود 3 Months :
سیگنالهای Kusama
Filter
Sort messages by
Trader Type
Time Frame

mastercrypto2020
KSM LONG SIGNAL

--- 📢 Official Trade Signal – KSM/USDT 📈 Position Type: LONG 💰 Entry Price: 6.893 (Limit Order) --- 🎯 Take-Profit Targets (Partial Exits) • TP1: 7.164 • TP2: 7.350 • TP3: 7.514 • TP4: 7.680 • TP5: 7.887 • TP6: — --- 🛑 Stop-Loss: 6.720 📊 Timeframe: 15m ⚖️ Risk/Reward Ratio: — 💥 Suggested Leverage: 5× – 10× --- 🧠 Technical Analysis Summary KSM is trading near a strong intraday demand zone on the 15-minute timeframe. Price action shows signs of bullish continuation after consolidation, with volume support building at current levels. Holding above 6.893 confirms bullish bias. A clean breakout above TP1 (7.164) can open the path toward higher liquidity levels: 7.350 → 7.514 → 7.680 → 7.887 --- ⚙️ Trade Management Rules ✔ Take partial profit at TP1 ✔ Move Stop-Loss to Break-Even once TP1 is hit ✔ Trail SL toward higher targets ✔ No re-entry if SL is triggered ✔ Always confirm market structure before entry --- ⚠️ Risk Management Is Mandatory --- --- 📌 TradingView Hashtags #KSMUSDT #KSM #CryptoSignal #LongSetup #TradingView #FuturesTrading #TechnicalAnalysis

Crypto_alphabit
پیشبینی سود انفجاری KSM: نقطه ورود طلایی و اهداف هیجانانگیز!
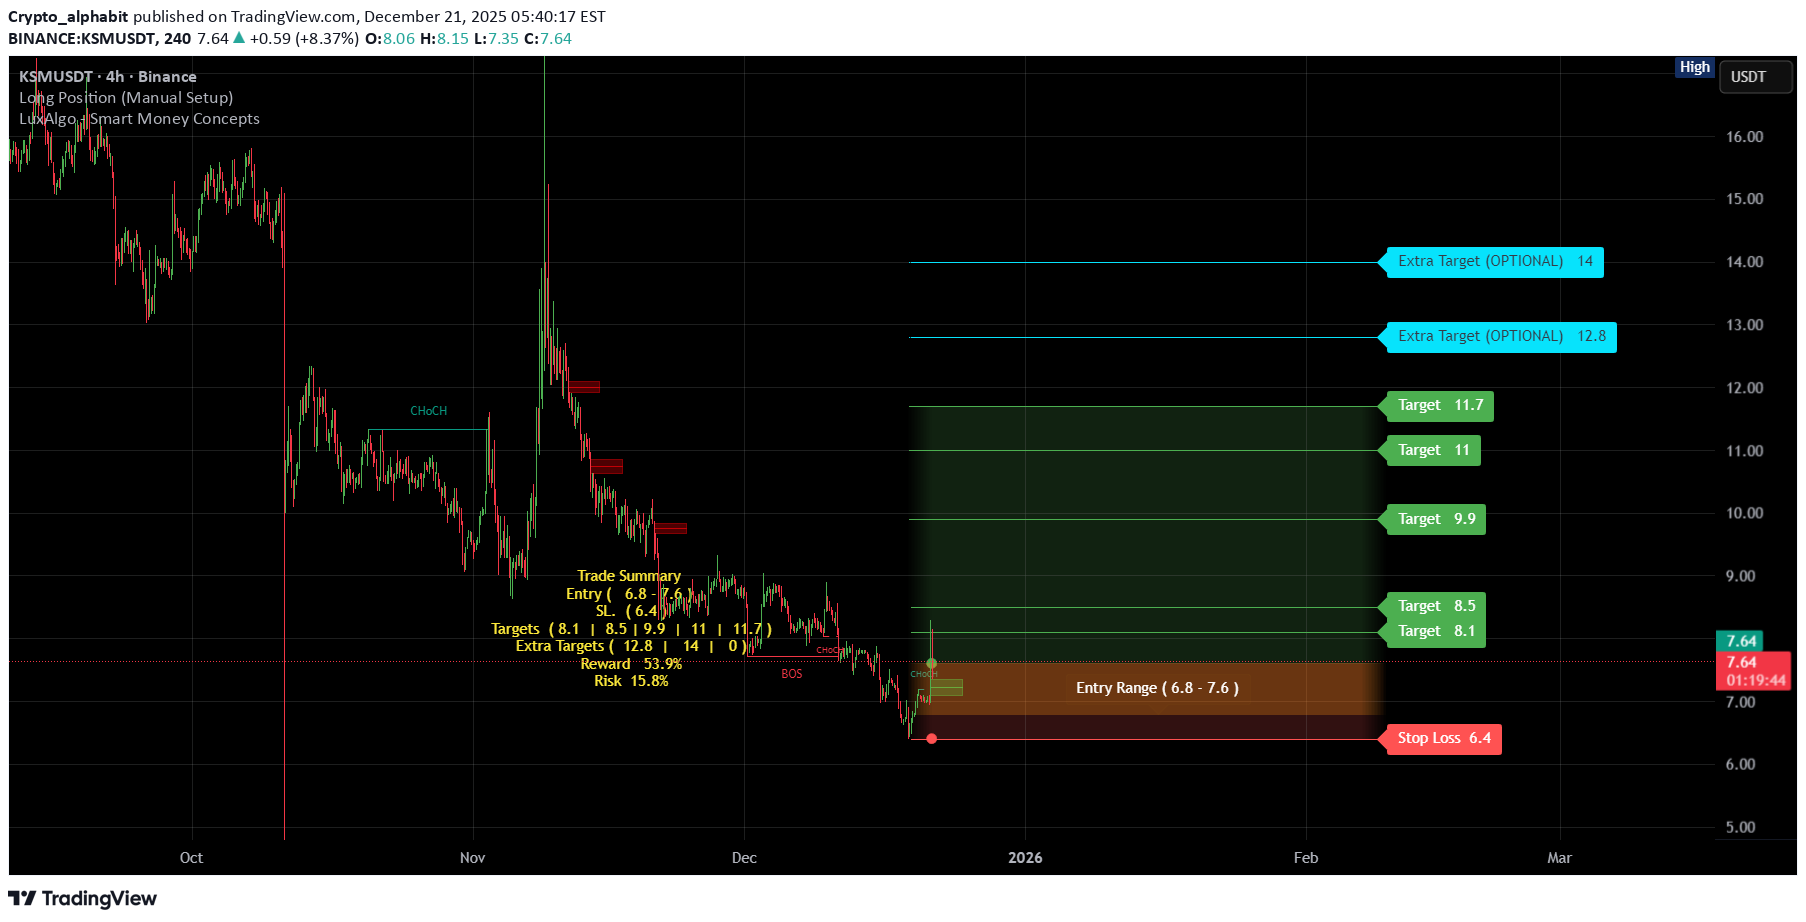
KSMUSDT #KSM/ USDT Entry range (6.8- 7.6) SL 4H close below 6.4 T1 8.1 T2 8.5 T3 9.9 T4 11.0 T5 11.7 2 Extra Target are optional 12.8 ,14 _______________________________________________________ Golden Advices. ******************** * collect the coin slowly in the entry range. * Please calculate your losses before the entry. * Do not enter any trade you find it not suitable for you. * No FOMO - No Rush , it is a long journey.
mastercrypto2020
KSM USDT LONG SIGNAL
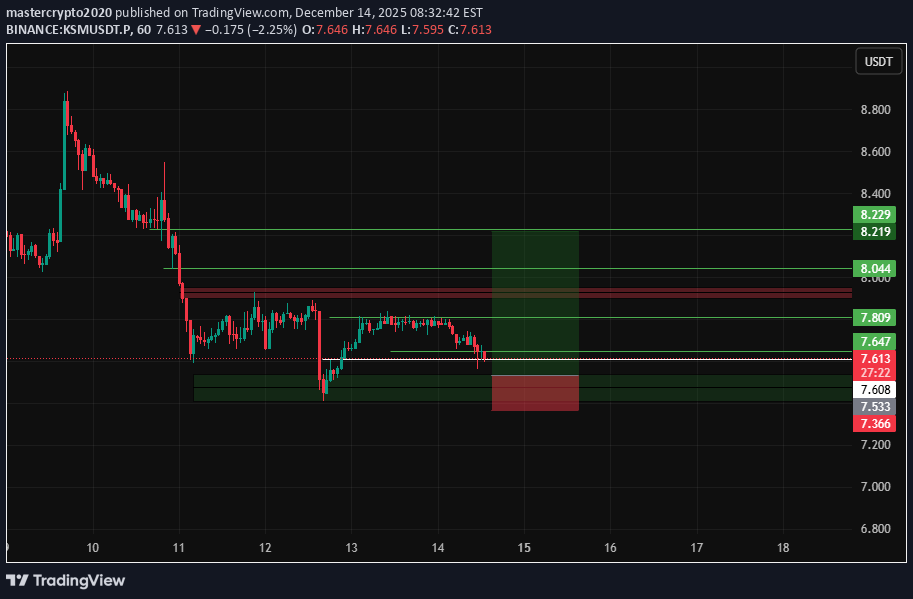
--- 📢 Official Trade Signal – KSM/USDT 📈 Position Type: LONG 💰 Entry Price: 7.533 --- 🎯 Take-Profit Targets (Partial Exits) • TP1: 7.647 • TP2: 7.800 • TP3: 8.040 • TP4: 8.229 • TP5: — • TP6: — --- 🛑 Stop-Loss: 7.360 📊 Timeframe: 15m ⚖️ Risk/Reward Ratio: — 💥 Suggested Leverage: 5× – 10× --- 🧠 Technical Analysis Summary KSM is reacting positively from a strong intraday demand zone, holding above key support at 7.36. Market structure on the 15m timeframe shows bullish continuation with higher lows forming. Liquidity is stacked above current price, making the following levels highly probable: 7.647 → first resistance & liquidity grab 7.800 → intraday breakout level 8.040 → structure expansion 8.229 → higher timeframe resistance As long as price holds above 7.36, bullish momentum remains valid. --- ⚙️ Trade Management Rules ✔ Partial profit at TP1 ✔ Move SL to Break-Even after TP1 ✔ Trail SL as price moves toward TP3–TP4 ✔ No re-entry if SL (7.360) is hit ✔ Always confirm price action before entry --- ⚠️ Risk Management Is Mandatory Trade smart. Protect capital first. --- 🔗 VIP Signals Channel: 👉 [ t.me/CryptoMasterr_signl_bot --- 📌 TradingView Hashtags #KSMUSDT #KSM #CryptoSignal #LongSetup #TradingView #FuturesTrading #PriceAction --

MyCryptoParadise
Is #KSM Ready to Recover or will Bears Drag it Further Down?
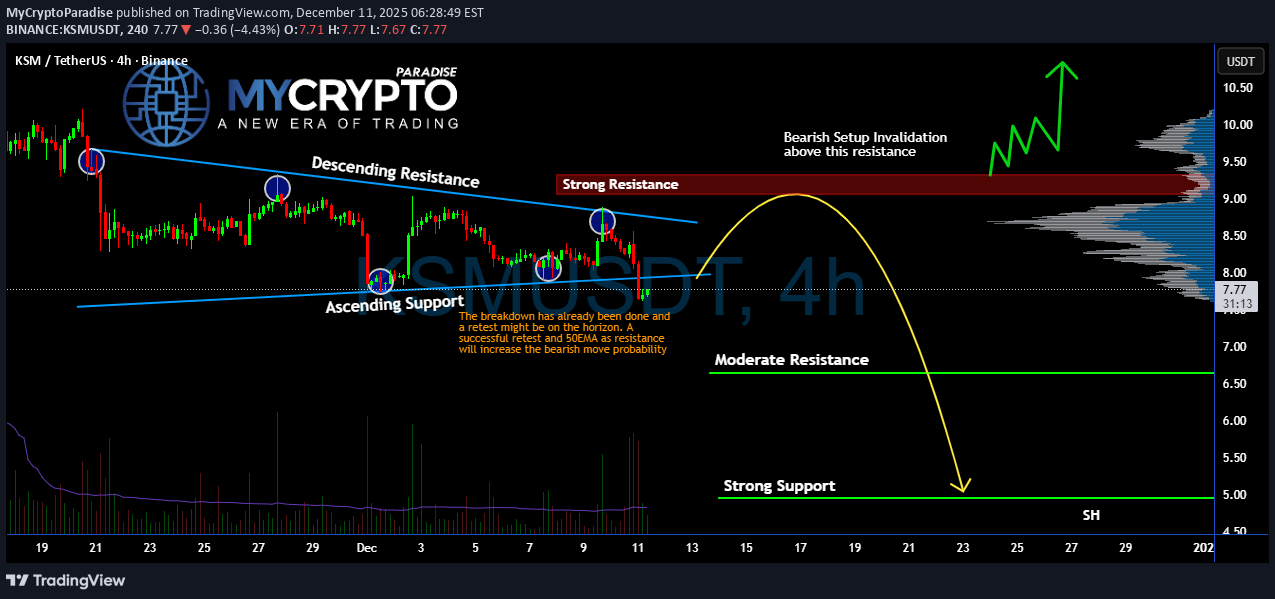
Yello Paradisers! Is #KSM setting up for a nasty flush toward new lows, or are we about to witness a fakeout trap before a bigger move? Here's what the # Kusama chart is showing us: 💎#KSMUSDT is currently trading within a clearly defined symmetrical triangle, with the price consistently being rejected from the descending resistance trendline. This structure has broken down, and as of now, the 50EMA is acting as dynamic resistance, reinforcing the bearish bias. 💎The current price of #KSMUSD is $7.75, sitting right below the strong resistance around the $9.32 zone, where the descending trendline aligns with heavy volume on the visible range. As long as price trades below this $9.32 invalidation level, the bearish setup remains valid. A rejection from this level, combined with a 50EMA retest, would further confirm downside continuation. 💎Next key level to watch is the moderate support zone at $6.65, a potential short-term bounce area. However, the real demand lies lower, with major support at $4.95, where we could see aggressive buyers stepping in. This zone also coincides with the previous swing low and would likely trigger liquidation of late long entries, making it a potential reversal zone if the market reaches there. 💎To flip the structure bullish, #KSM needs to break and hold above $9.32. That would invalidate the descending channel and could spark a rapid move toward the next volume cluster above $10.50. Until then, every retest of resistance remains a potential short opportunity for experienced traders. Trade smart, Paradisers. This setup will reward only the disciplined. MyCryptoParadise iFeel the success🌴💎Nailed it again! #KSMUSDT is down smooth 14.32%, just as predicted! 💎 What’s your take on this development? Could we see another breakout soon? Let us know your thoughts below! 👇

wolffxtrader
خرید در کف قیمت KSM: تریدرها آماده جهش بزرگ بولها باشید!
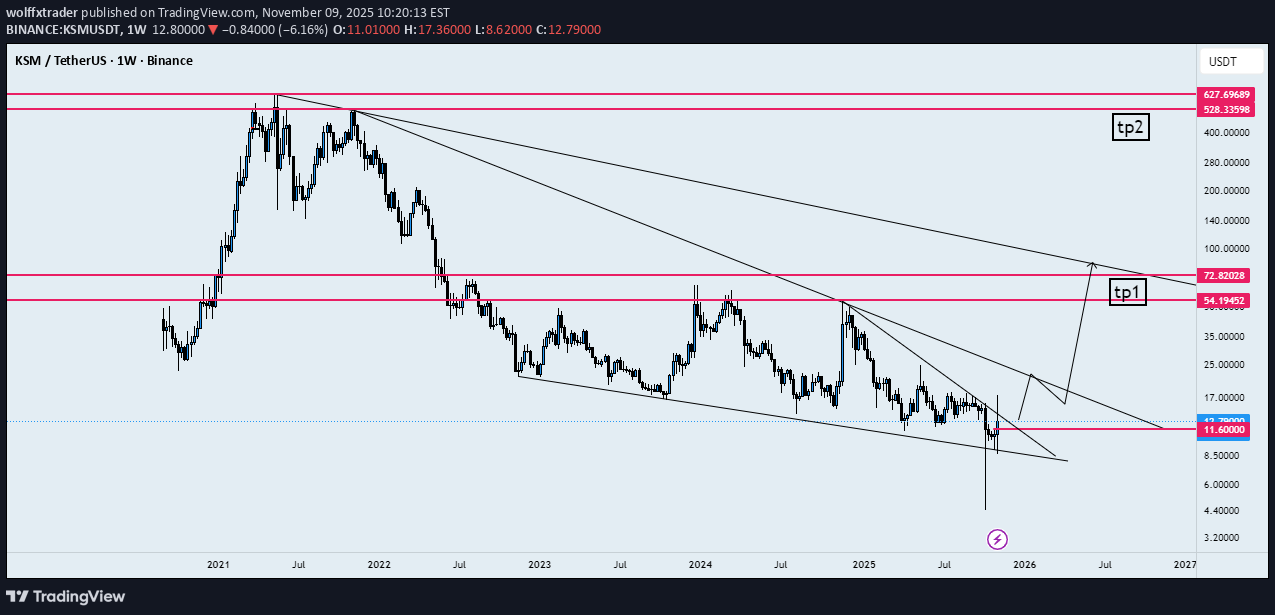
hello traders how are you today? as you can see price started a huge spike and i think bulls are coming back and i want to buy at the bottom. be safe enjoy.

DakuNit
احتمال جهش بزرگ KSM: آیا زمان خرید فرا رسیده است؟
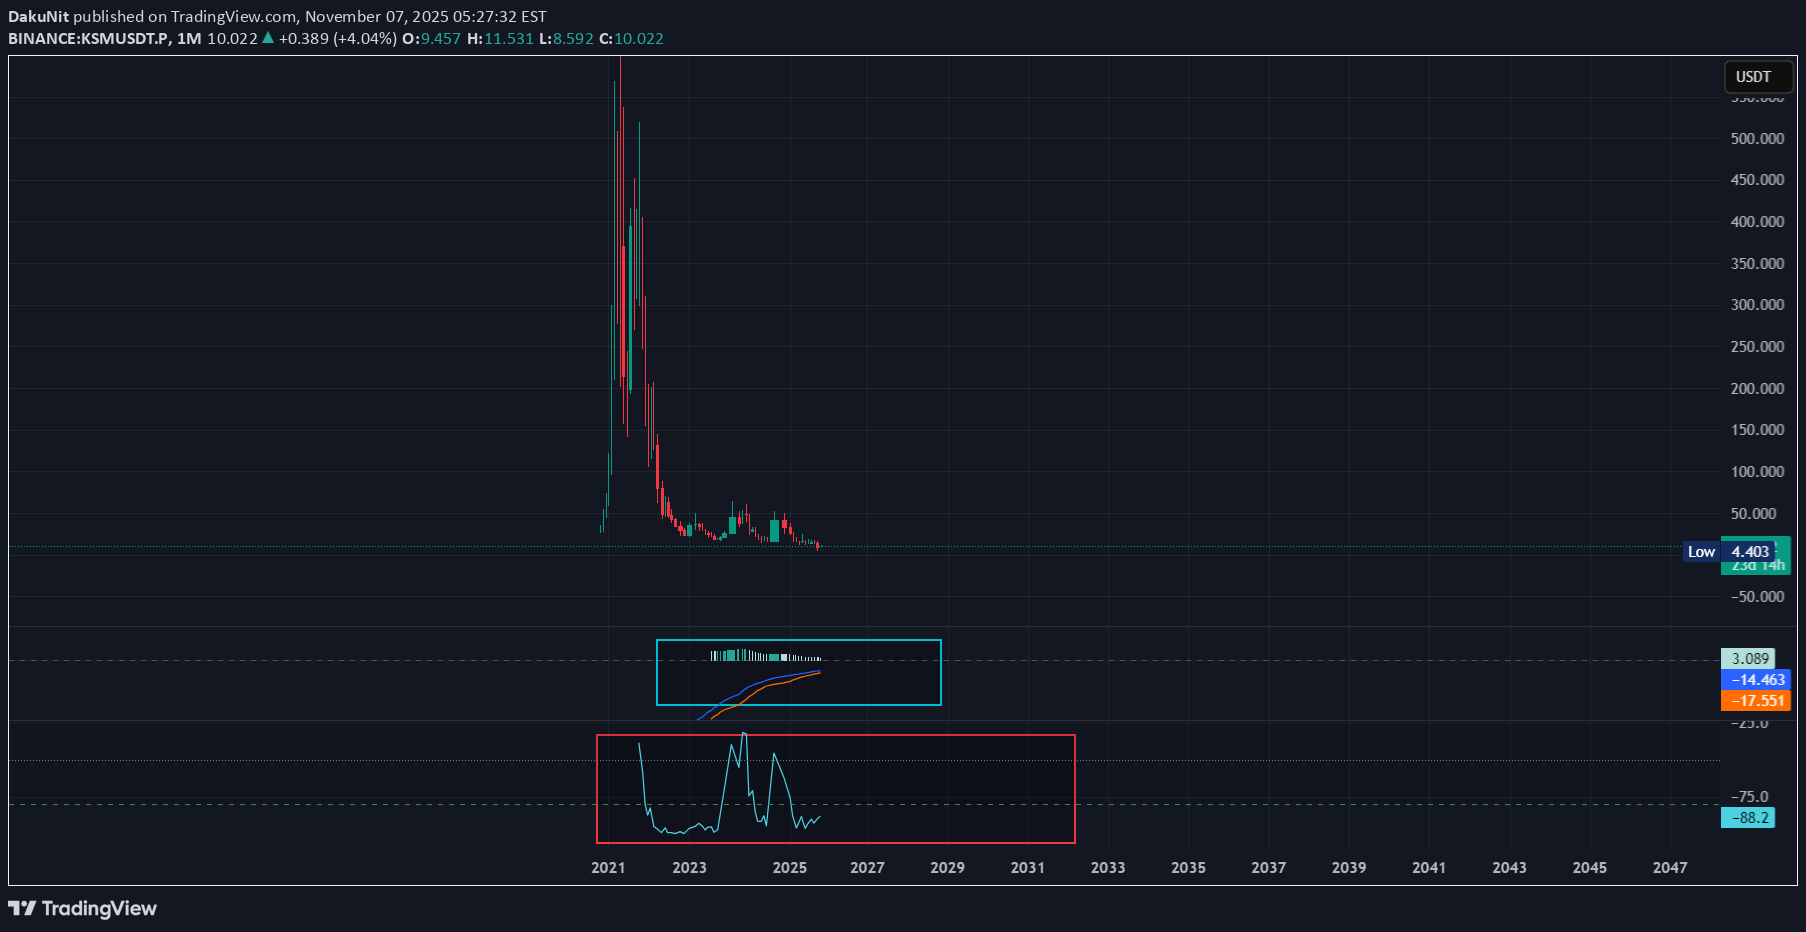
KUSAMA, looks a very very attractive position for KSM, in monthly view as it is visualized KSM it is accumulating and it is in a very oversold position. Will KSM melt some happy faces in the near soon i think yes. keep an eye on it, big money will flow Please i am not a professional trader and i do not give financial advices Do your own research God Bless all

The_Traders_House
فروش کوتاهمدت KSM/USDT: سیگنال ورود از سطح حمایتی 10.115!
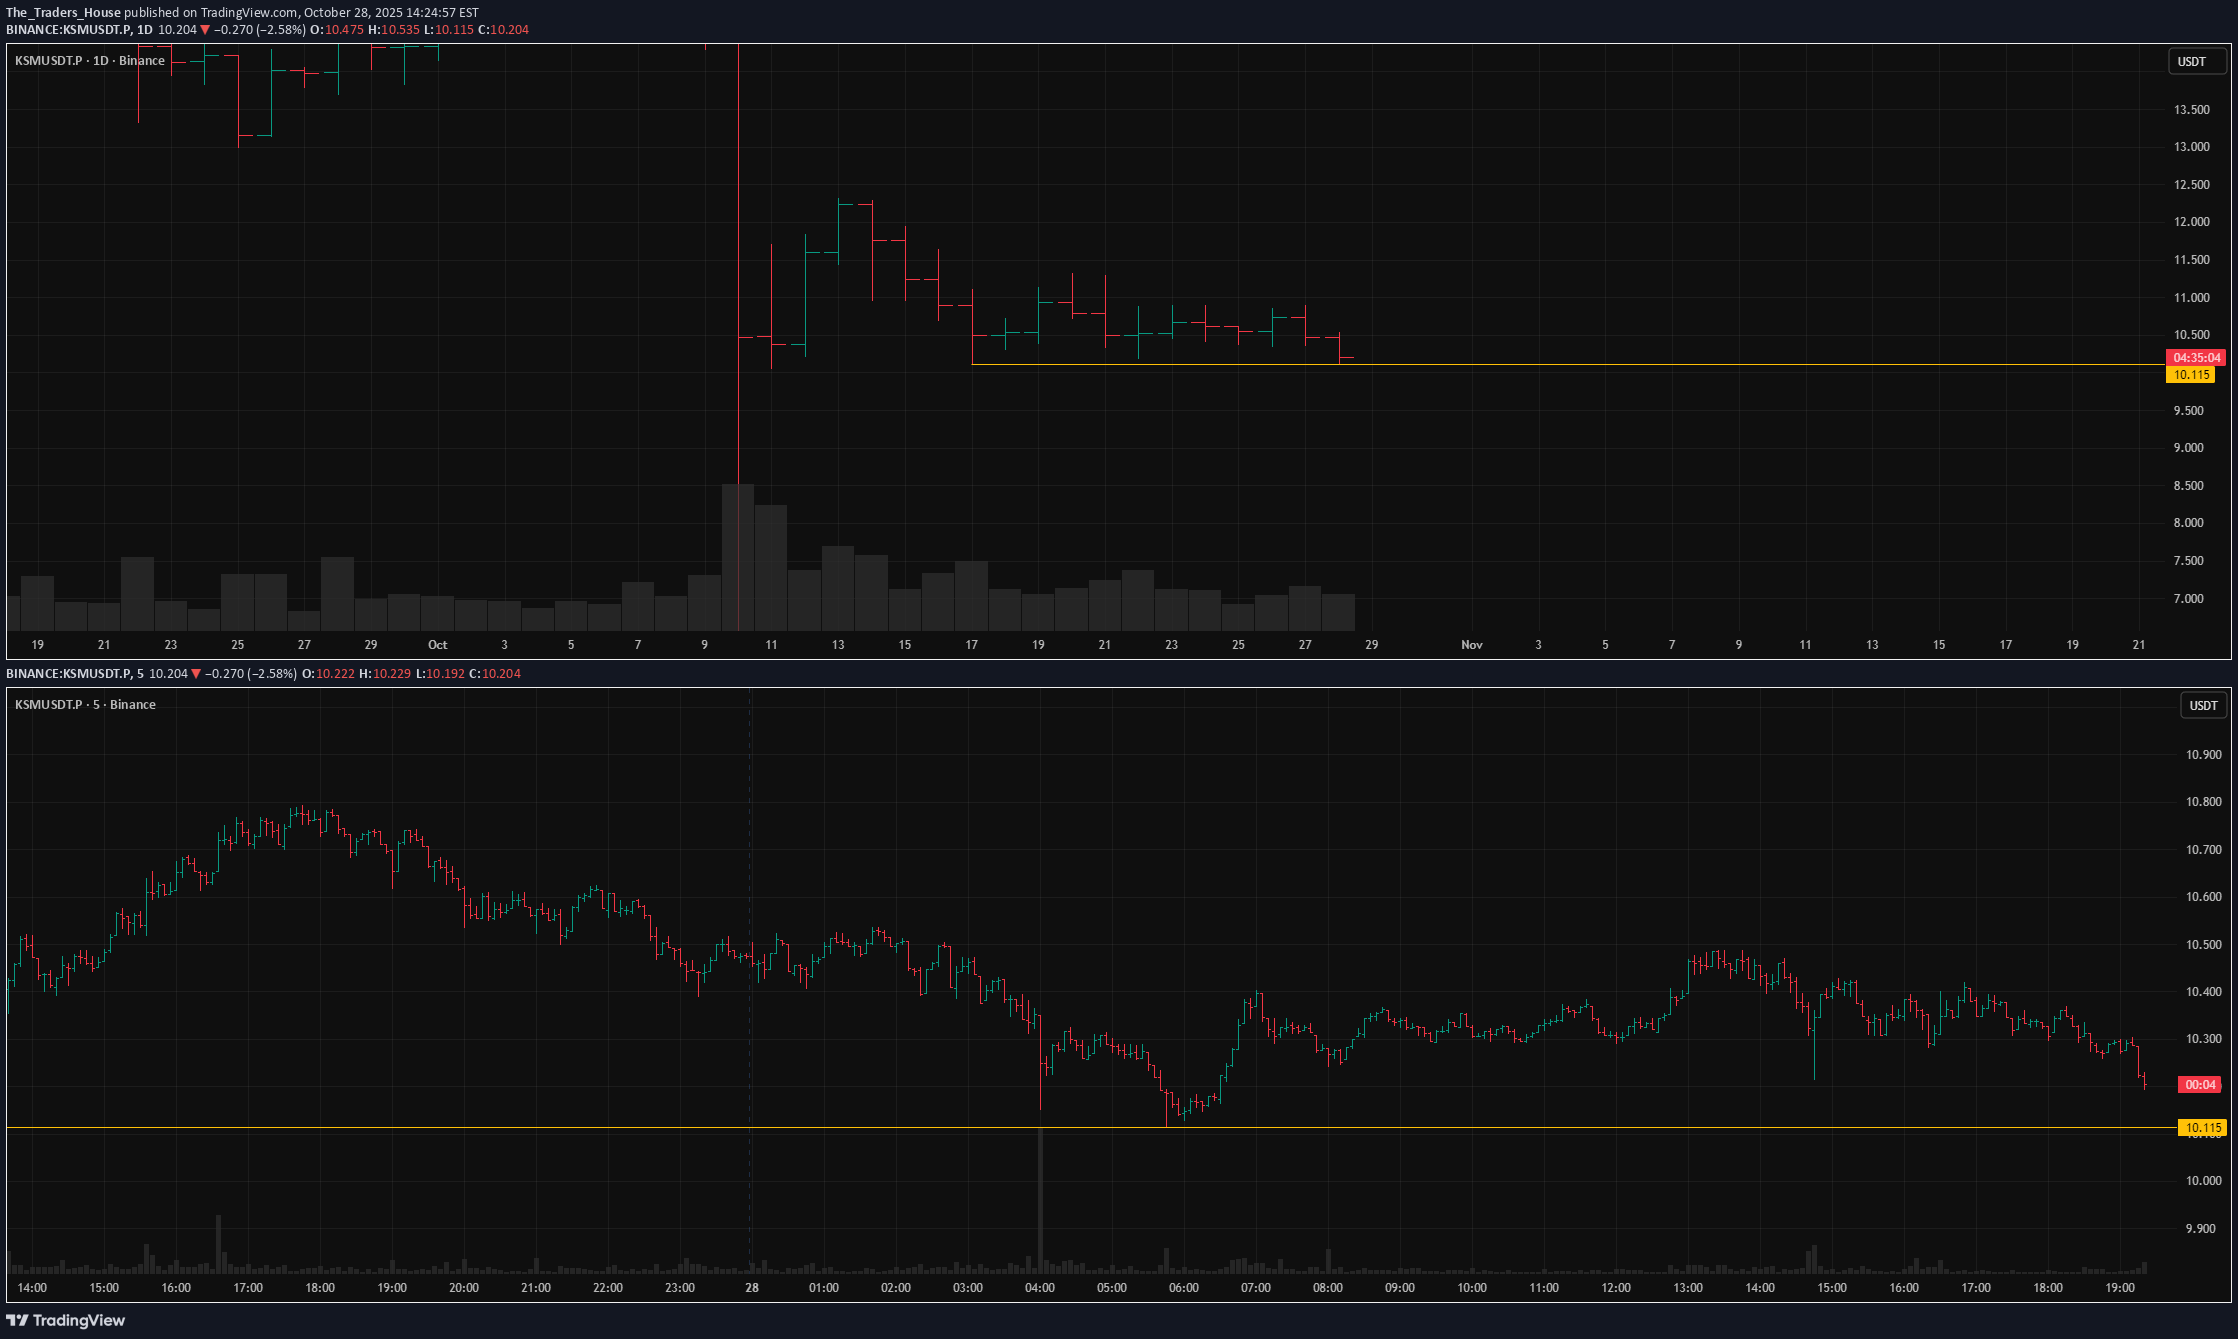
KSMUSDT.P remains in consolidation, clearly confirming the level — no false breakouts or sweeps, just consistent touches and short pullbacks. The asset has held this structure for nearly two weeks and will eventually break out. In my view, the likely scenario is a short below 10.115. Today, the asset has already tested the level once and is gradually approaching it again. Maintaining low volatility during this approach will be important. Key factors for this scenario: Global & local trend alignment Volatility contraction on approach Prolonged consolidation Was this analysis helpful? Leave your thoughts in the comments and follow to see more.Result: 4.52 to 1 My minimum target is 5 to 1. When 3 to 1 is reached, I move the stop to breakeven. Final result: 0R.

weslad
KSM Bullish Outlook Accumulation Zone Holding Strong
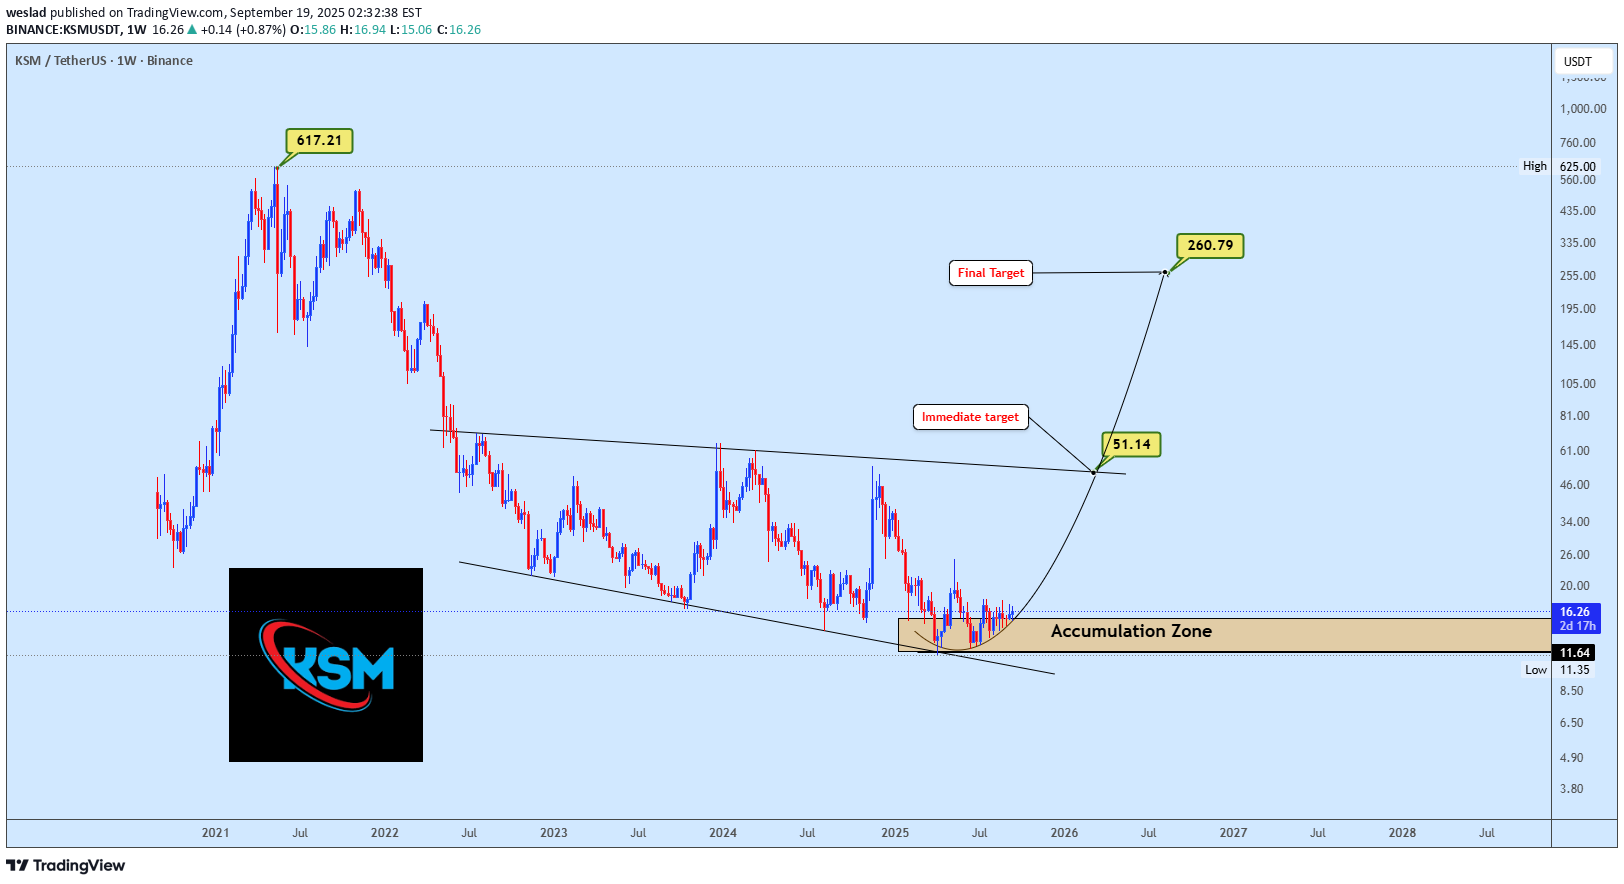
KSM is showing signs of strength after a prolonged downtrend, holding firmly within the accumulation zone around 11–16. A breakout from this base would set the stage for a major recovery, with the immediate target at 51.14 and a broader projection towards 260.79. As long as price sustains above the accumulation area, the bullish outlook remains valid, while only a decisive drop back below the zone would invalidate the setup.Still active, ignore the useless wick

mahesh56a
KSM is Ready for 150% + Up Move
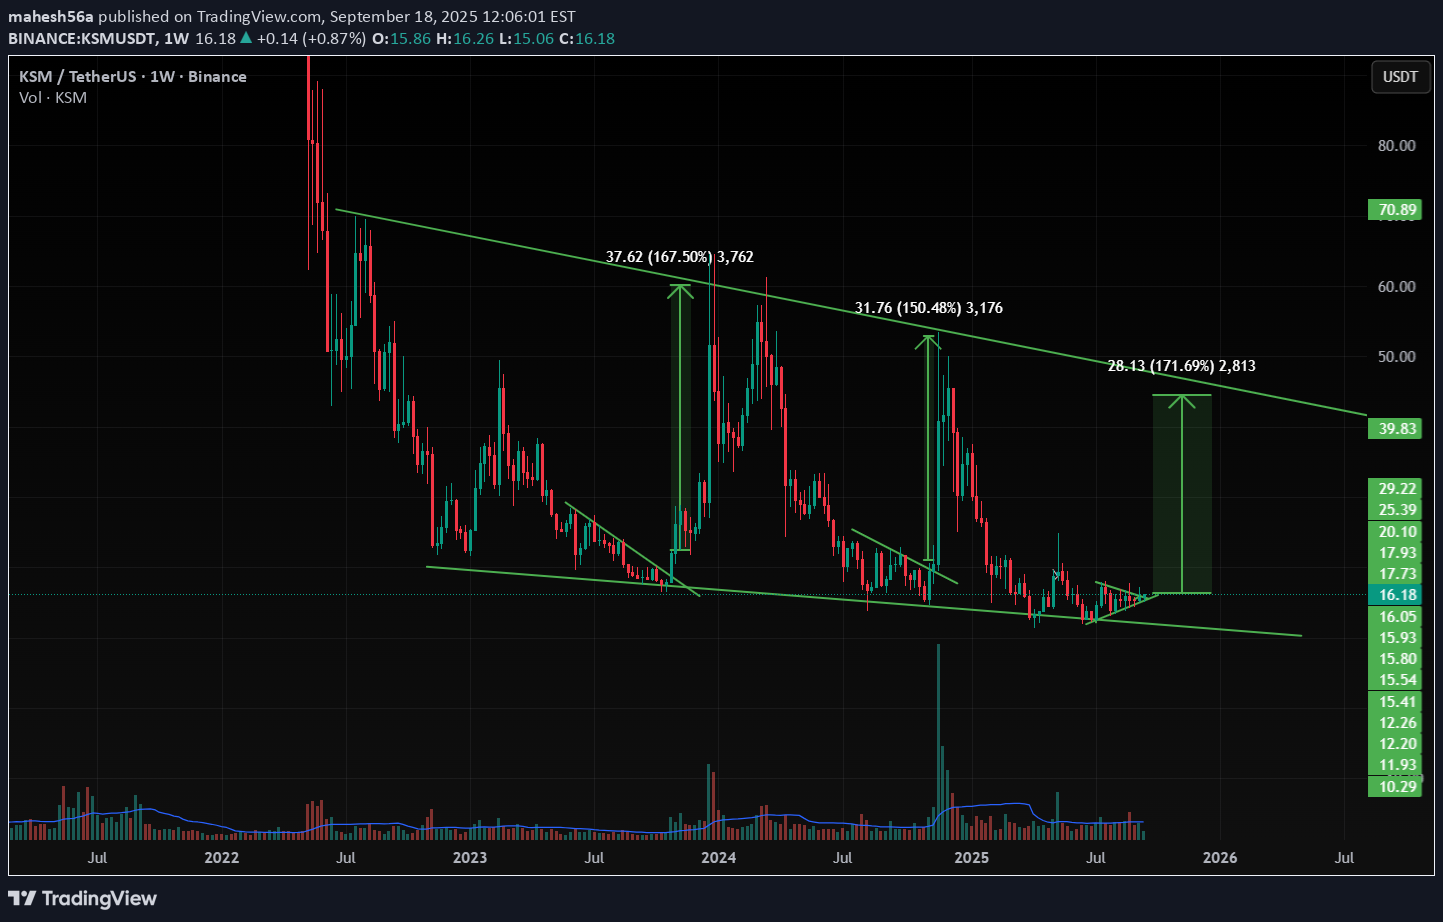
KSM is making a pattern at Support zone and It is Ready for Breakout from that pattern . and at the same time Altcoin Season Index is at 74 , when it is >75 it is sign of very bullish in altcoins and Breakouts will have very high potential to give a big move . and at the same time Bitcoin dominance is decreasing and altcoins dominance is started increasing , so look on all the altcoins and follow proper risk management , it has very good chances to move UP side but first we have to protect the down side , where risk management comes into game . Follow for more Ideas and potential coins/ Stocks .

Cryptojobs
KSM - 10 WEEKS STUCK IN NEUTRAL BOX

🚨 KSM - Price Analysis: Neutral Stalemate - Bearish Test Incoming? 📉 Quick TA on - charts in limbo mode. 💡 Daily View: 🔸 Very neutral zone, price stuck under key resistances: $15.80 & $16.15. 🤝 🔸 Daily uptrend supporting prices, but buy volume is weak... No real firepower yet. 🐂💤 Expectations: 🔸 This feels like a bearish test. Next move? Possible correction to the $14.20-$14.00 demand zone. 🔸 Bulls need to smash above $16.15 (daily) to flip the script! Weekly Tip: 🔸 Watch the bigger picture: 10 weeks of sideways action between $17.30 and $13.90 (closing). 🔸 Key signal? A weekly close above or below could trigger the next major move! ⚠️ Sum-Up: Tough chart with heavy indecision. My bias: Likely bearish. Stay alert! 👀 (DYOR, not advice!)
Disclaimer
Any content and materials included in Sahmeto's website and official communication channels are a compilation of personal opinions and analyses and are not binding. They do not constitute any recommendation for buying, selling, entering or exiting the stock market and cryptocurrency market. Also, all news and analyses included in the website and channels are merely republished information from official and unofficial domestic and foreign sources, and it is obvious that users of the said content are responsible for following up and ensuring the authenticity and accuracy of the materials. Therefore, while disclaiming responsibility, it is declared that the responsibility for any decision-making, action, and potential profit and loss in the capital market and cryptocurrency market lies with the trader.