
KMD
Komodo
| تریدر | نوع سیگنال | حد سود/ضرر | زمان انتشار | مشاهده پیام |
|---|---|---|---|---|
No results found. | ||||
Price Chart of Komodo
سود 3 Months :
سیگنالهای Komodo
Filter
Sort messages by
Trader Type
Time Frame

BallaJi
سقوط عظیم کومودو: آیا بازماندگان به بازگشت امیدوارند؟
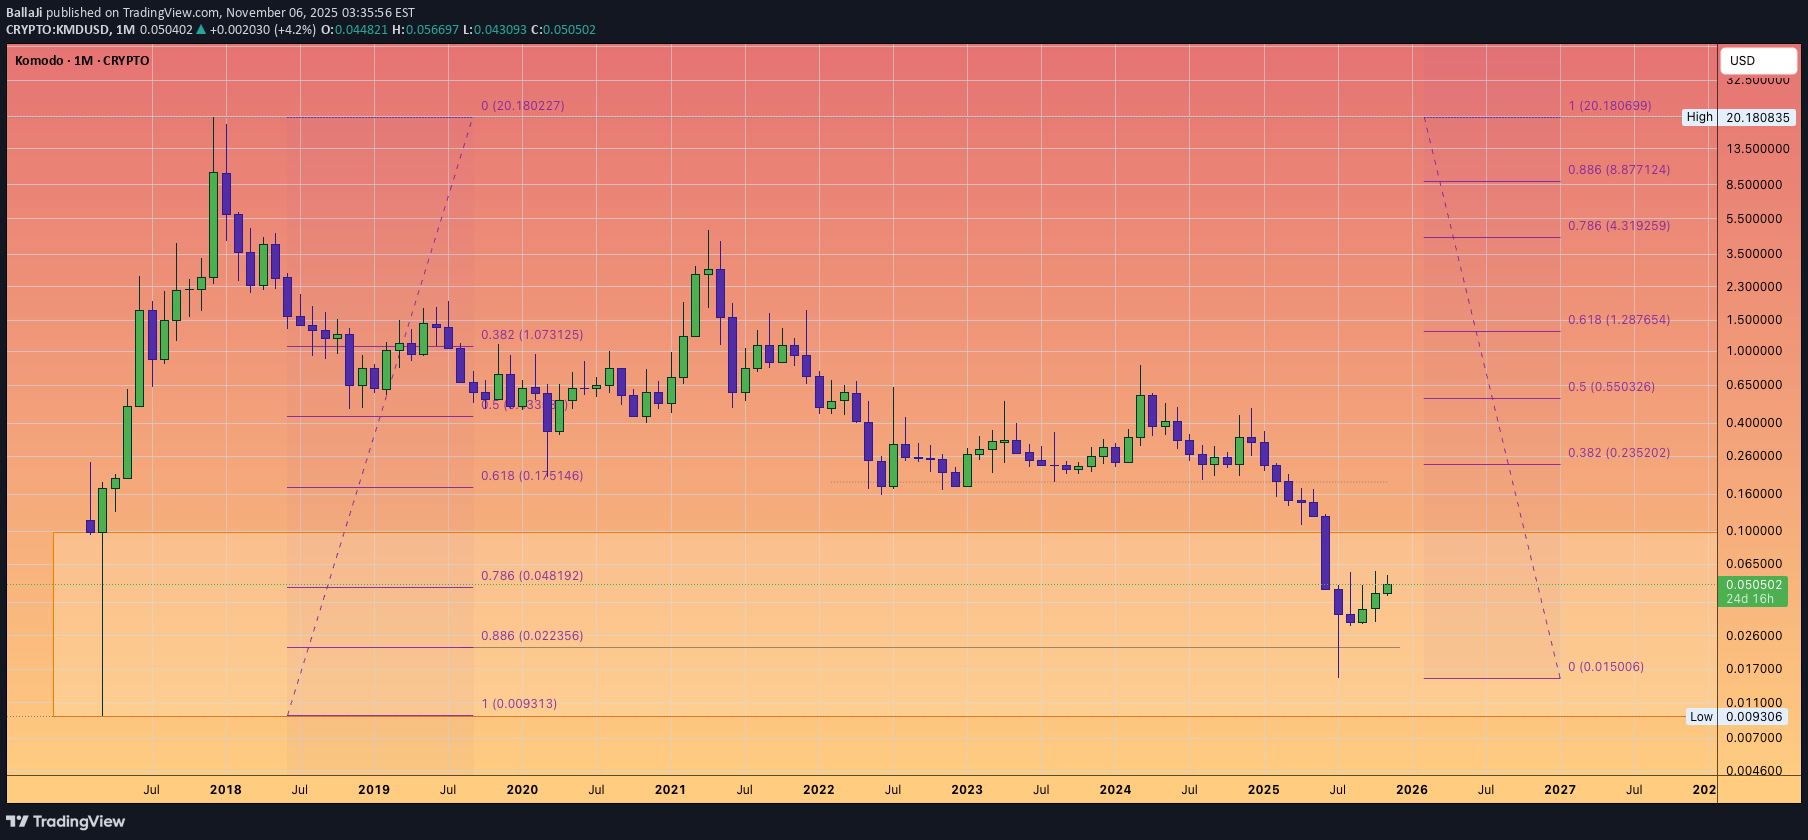
The question is now. What is left behind in the rubble. There seems to be working products and ongoing development. I assume much if not all bag holders would have left in search for riches elsewhere. Will they return for a recovery rally?

Zorroreny
KMD - manipulation games?
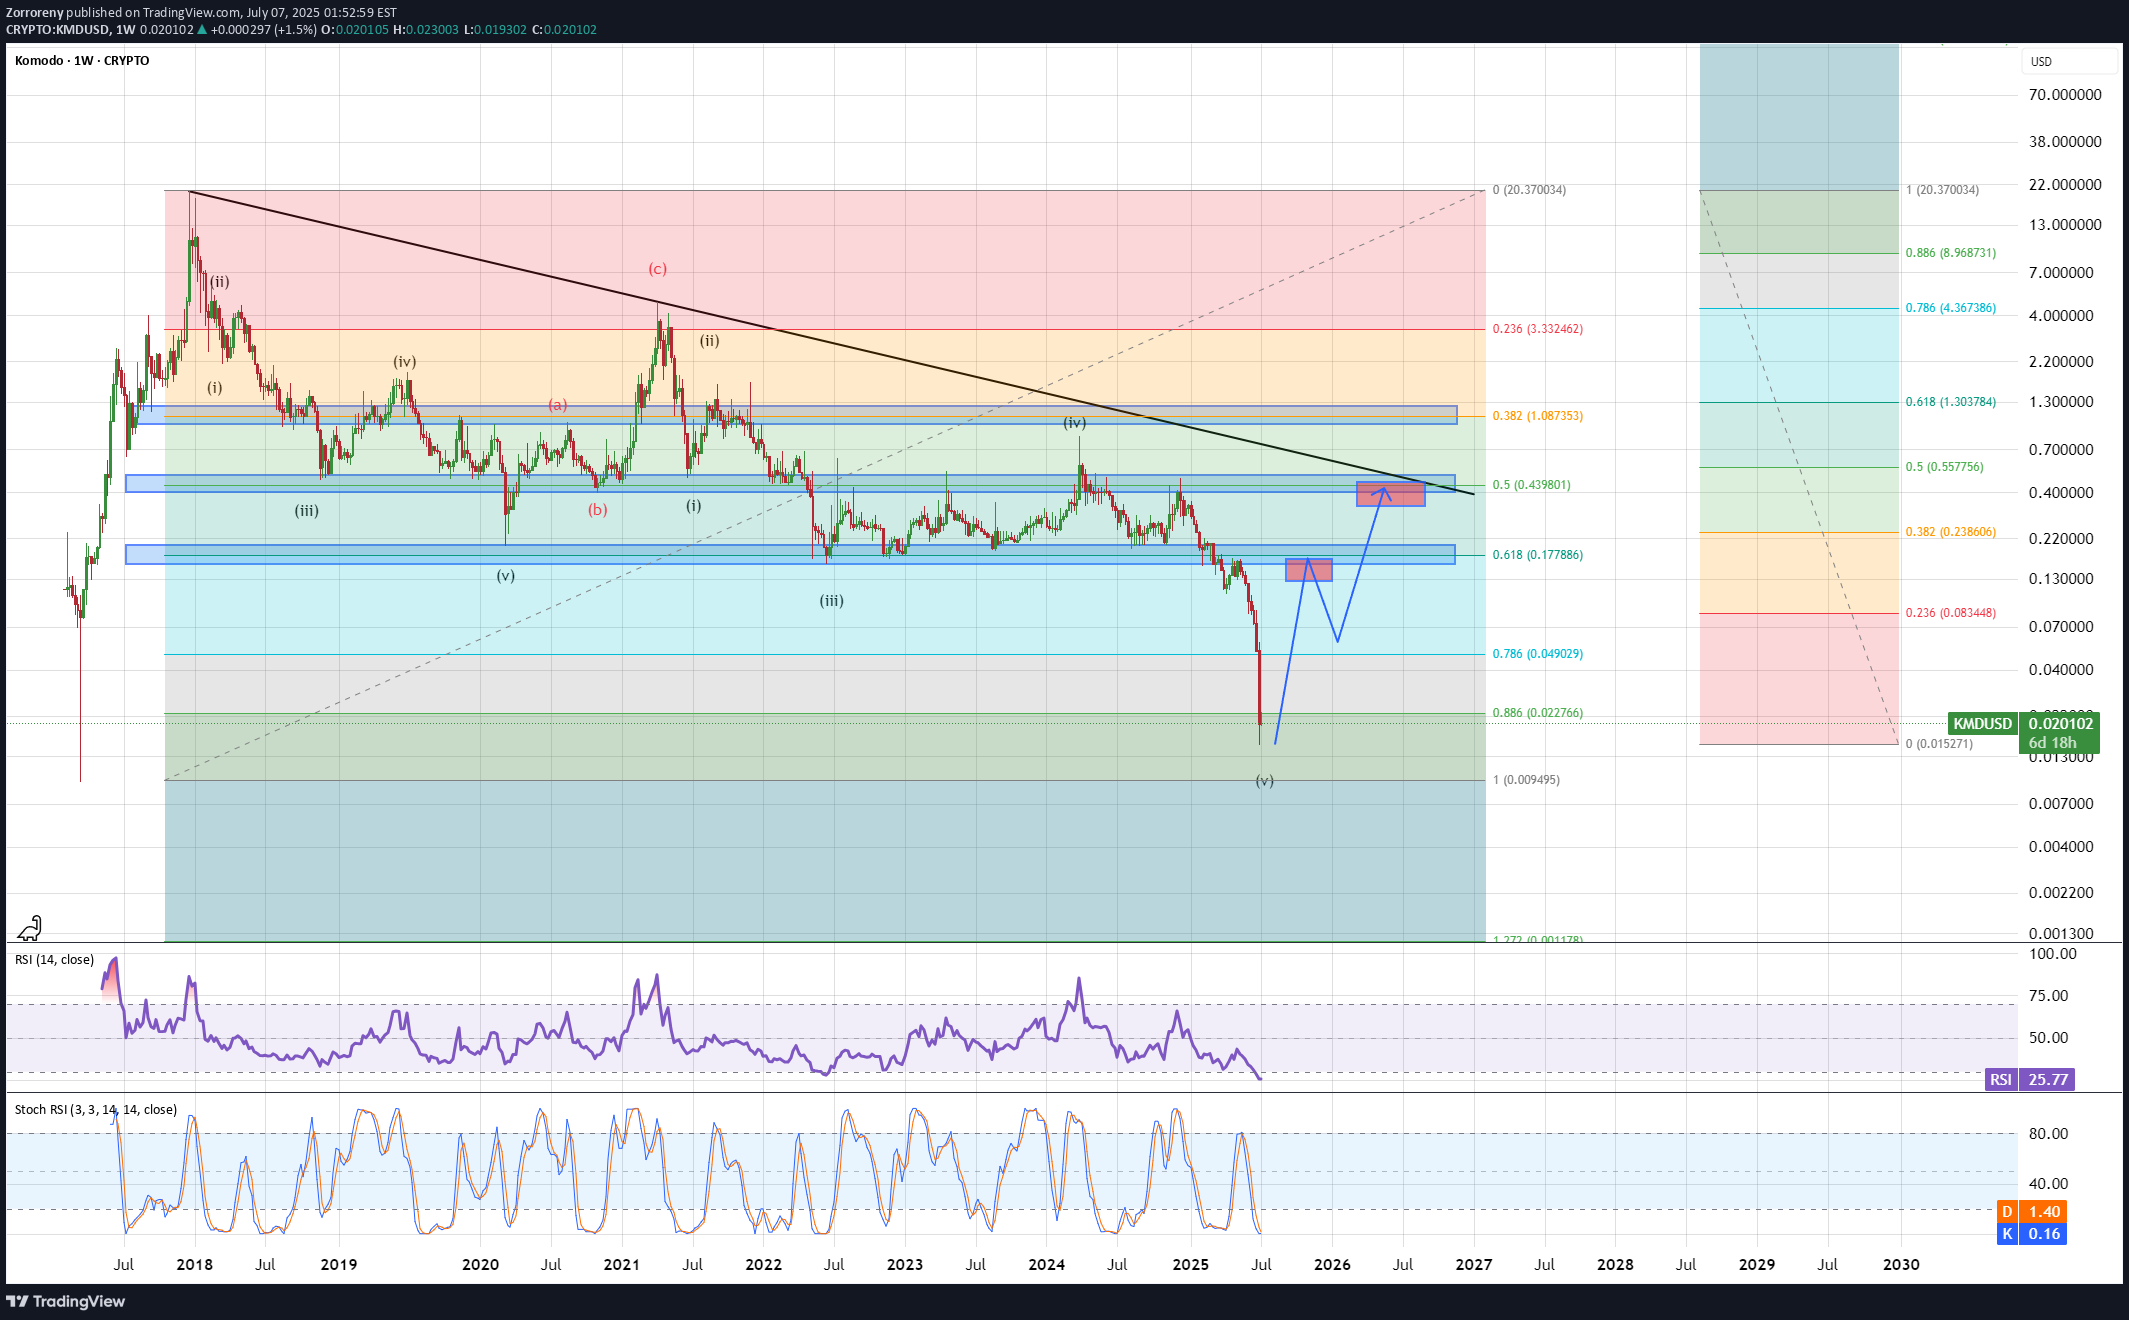
KMD had a nice setup for bounce up and then came Binance delisting news....Price dumped to fibb 0.886 range and I expect bounce up (test of fibb 0.886 usually causes contra move to fibb 0.382) however we have now some strong S/R ranges above so I would play it step by step.For bull to get alive we would need following:- wick wave 4 pivot at fibb 0.382 S/R- correct for HL and hold above fibb 0.618- break diagonal resistance lineUntill then it's step by step game...

CryptoNuclear
KMDUSDT 1D Analysis

KMD ~ 1D Analysis#KMD Buy after successfully penetrating this resistant line with a short -term target of at least 10%+ from here.

CryptoAnalystSignal
#KDA/USDT

#KDAThe price is moving within a descending channel on the 1-hour frame, adhering well to it, and is heading for a strong breakout and retest.We are seeing a bounce from the lower boundary of the descending channel, which is support at 0.1480.We have a downtrend on the RSI indicator that is about to break and retest, supporting the upward trend.We are looking for stability above the 100 moving average.Entry price: 0.1515First target: 0.1530Second target: 0.1550Third target: 0.1580

alizeynali69

Introduction: The Performance of KMD CoinKMD (Komodo) is a blockchain platform that enables developers to create their own private blockchains while benefiting from robust security features. This coin is used in the cryptocurrency market with the goal of enhancing security, scalability, and interoperability between blockchains. As a result, KMD has a high growth potential and can serve as an attractive option for both investors and blockchain users.Comprehensive and Optimized Analysis for KMD Coin📊 Current Market Status:Support Range: 0.1772 - 0.2344KMD is currently positioned at the lower boundary of a range box. This support area is the most critical level for market entry. If the market holds at this level, there is a potential for price movement toward the upper boundary of the range box and higher resistance zones. This could present an excellent entry point for investors.Stop Loss: 0.1400If the support level fails and the price moves lower, the stop loss should be set just below this level. This risk management strategy is crucial to prevent further losses and properly manage the investment.📈 Price Upside Potential:Upper Range Boundary (Red Zone):Resistance Zone: 0.4043 - 0.4584This resistance zone is observed on the weekly time frame, and based on historical data, each time the price has approached this zone, we’ve seen a pullback to the lower end of the range. However, if the price manages to break through this zone, there’s potential for the uptrend to continue.Upside Targets (if the upper range boundary is broken):TP1: 0.7819 - 0.9000TP2: 1.3486 - 1.5824TP3: 3.4201 - 3.7903If the current resistance zone is broken, the price could reach higher targets as listed above.🔍 Technical Features:Low Market Cap:Given KMD’s relatively low market cap, if liquidity flows into the market, this coin could experience growth beyond the mentioned targets. This characteristic provides a higher profit potential for investors.RSI (Relative Strength Index):Connecting RSI lows may indicate support at this trend line, suggesting a potential move toward higher levels. This technical tool can be considered a confirmation signal for long positions.📊 Trading Volume:To validate the uptrend, trading volume must increase significantly. Low volume could indicate a fake upward move that lacks sustainability. High volume can serve as a strong confirmation signal for the continuation of the uptrend.🔒 Risk Management and Stop Loss:After breaking the weekly resistance zone (red zone), the stop loss can be moved below this level.Also, as price reaches each target and stabilizes above it, the stop loss should be adjusted to below the broken targets to protect the profits.💡 Conclusion:KMD is currently at an important support level, and if this level holds, a move toward higher targets can be expected. With favorable technical features like a low market cap, RSI, and trading volume, this coin has high growth potential. For effective risk management, adjusting the stop loss based on price fluctuations and resistance breakouts is essential.

m6qvyrwjnr
$KMD chart on daily fram

This is the analysis of kmd chart on daily fram for short term I expect this move to be done within few days good luck for all

deceptive due
رمز ارز کمودو kmd

In the one -day analysis of the Dodge Star pattern, friends are currently in my servant's analysis can be up to 0.37 to the next one to two weeks. This is just one guide and I will not take responsibility for your sale. Please research the currency password before making any purchase or sale.

navid_aerospace
KMDUSDT | %1500 VOLUME INCREASE BIG OPPORTUNITY

KMDUSDT: Buyer Activity Surging with Strong Demand ZonesKMDUSDT is showing a 1500% increase in daily volume, reflecting intense buyer activity. The blue boxes on the chart highlight key demand zones, ideal for potential buy opportunities.For more precise entries, consider trading lower time frame market structure breaks within these zones. These setups often yield strong reactions, enhancing risk-to-reward potential. As always, apply proper risk management.I keep my charts clean and simple because I believe clarity leads to better decisions. My approach is built on years of experience and a solid track record. I don’t claim to know it all, but I’m confident in my ability to spot high-probability setups.My Previous Analysis🐶 DOGEUSDT.P: Next Move🎨 RENDERUSDT.P: Opportunity of the Month💎 ETHUSDT.P: Where to Retrace🟢 BNBUSDT.P: Potential Surge📊 BTC Dominance: Reaction Zone🌊 WAVESUSDT.P: Demand Zone Potential🟣 UNIUSDT.P: Long-Term Trade🔵 XRPUSDT.P: Entry Zones🔗 LINKUSDT.P: Follow The River📈 BTCUSDT.P: Two Key Demand Zones🟩 POLUSDT: Bullish Momentum🌟 PENDLEUSDT: Where Opportunity Meets Precision🔥 BTCUSDT.P: Liquidation of Highly Leveraged Longs🌊 SOLUSDT.P: SOL's Dip - Your Opportunity🐸 1000PEPEUSDT.P: Prime Bounce Zone Unlocked🚀 ETHUSDT.P: Set to Explode - Don't Miss This Game Changer🤖 IQUSDT: Smart Plan⚡️ PONDUSDT: A Trade Not Taken Is Better Than a Losing One💼 STMXUSDT: 2 Buying Areas🐢 TURBOUSDT: Buy Zones and Buyer Presence

yoruk_efe
KMD, kmdusdt

Those who live their bulls, the old ones know. I don't know if they will try ATH again, it depends on how tired the people they left behind give their goods. In other words, are there many people who have goods to sell above or do a wallet search. If we look at it technically, we have a positive purple line at 0.4460 from 4-hour to monthly candles, diagonal resistance above it and 0.65 right after. Around 1.65 will be the first resting place. If it sits on it, it can push the peak with hype. I wanted to share it because the short-term graph looks good. By the way, if I were to buy, I would expect it to go above purple. Good earnings.

cryptowolf022
$KMD #KMD 10X POtansiyel

Kmd long term 10x potential I expect a sharp move like VVGX.
Disclaimer
Any content and materials included in Sahmeto's website and official communication channels are a compilation of personal opinions and analyses and are not binding. They do not constitute any recommendation for buying, selling, entering or exiting the stock market and cryptocurrency market. Also, all news and analyses included in the website and channels are merely republished information from official and unofficial domestic and foreign sources, and it is obvious that users of the said content are responsible for following up and ensuring the authenticity and accuracy of the materials. Therefore, while disclaiming responsibility, it is declared that the responsibility for any decision-making, action, and potential profit and loss in the capital market and cryptocurrency market lies with the trader.