
KCS
KuCoin Token
| تریدر | نوع سیگنال | حد سود/ضرر | زمان انتشار | مشاهده پیام |
|---|---|---|---|---|
No results found. | ||||
Price Chart of KuCoin Token
سود 3 Months :
سیگنالهای KuCoin Token
Filter
Sort messages by
Trader Type
Time Frame

WaveRiders2


just_abdon
kcs

Alexinario expected to his uncle Cocoin The first goal is 60 The second goal is 400

MasterAnanda
KuCoin Token (KCS) Full Analysis · Past Cycle & Present

KCS is preparing for something really nice, very similar to 2021. In 2021 KuCoin Token grew 5,655%. From 0.500 to 28.77. The entire move from bottom to top lasted 511 days, the bottom being around July 2020, then the market went sideways before the bullish phase. The meat of the move happened in a total of 329 days. If we take the current cycle bottom to be around August 2024, 511 days gives us a date of 29-December 2025. In 2017 Bitcoin peaked around December. So this is a good date. I cannot calculate the analog using the 329 days for the "meat of the move" because the bullish breakout is not yet in place. But, late 2025 is what we are aiming for mainly for the next all-time high across the market. We remain open to see this go beyond and reach 2026 but this is something that we will have to wait and see. For now our focus is on what the data provides. Actually, many pairs, as we saw some weeks ago, are giving out strong signals pointing to Q1-Q2 2026 for their top. Others late 2025. So we have mixed signals and that's normal because the market is really big right now. Not everything can peak at the same time on the same date and not everything hit bottom at the same time. KuCoin Token is a great example, here the market bottom happened August 2023 and we then see a clear change of dynamics. Ethereum bottomed June 2022 and many altcoins hit bottom just recently, on and on. I keep harping on this just so you know that we cannot generalize anymore. Each project needs to be considered individually if we want accurate results. KuCoin Token (KCSUSDT) has been bullish growing from its base. A top happened March 2024 and a lower high late January this year, 2025. This does not invalidate the long-term bullish bias and potential. One major resistance zone remains between $13 and $16, matching the last two peaks just mentioned. We will never wait for "confirmation" here as it would mean a lost opportunity. The market will grow and will break this resistance zone easily and continue higher likely to reach new all-time highs. So this resistance range, rather than a level that needs to be conquered to confirm a bullish bias, can be taken as weak targets. By weak I mean that we do not sell here. We wait and sell only higher since the market is moving much higher it would be a waste to sell too early. One of the mistakes that can be made in this phase of the market cycle. Hold strong. Everything looks good. There is huge potential for growth. $44 is a great target but there is also $69. Which one to choose depends on how the overall market is doing and the date these targets are hit (or missed). For example, if KCS is trading near $40 in just two months, we can aim higher. On the other hand, if KCS is trading around $40 in December, then we can start to consider taking profits. Of course, this is just a brush-off, you need to do your own research and thorough planning. Namaste.

ProfittoPath
KCSUSDT Long Setup – Triangle Breakout Play !

Pattern: Symmetrical Triangle (30-min timeframe)Bias: Bullish BreakoutEntry: $11.192Stop-Loss (SL): $11.128Target 1 (TP1): $11.279Target 2 (TP2): $11.388Target 3 (TP3): $11.519 – $11.583🔍 Technical InsightsPrice consolidating after a sharp dropTriangle breakout in progress (highlighted zone)Risk/Reward looks solidSL set just below triangle base supportClean resistance levels for TP zones📢 Optional Caption for Social Media:🚨 KCSUSDT Long Setup📈 Triangle breakout confirmed📍 Entry: $11.192🛑 SL: $11.128🎯 TP1: $11.279 | TP2: $11.388 | TP3: $11.583💬 Let’s see if bulls take over!
ProfittoPath
KCS/USDT – Long Trade Setup (30-Min Chart)!

✅ Entry Zone: Around $11.50–$11.53Support: Holding above the ascending trendline and key support near $11.457Breakout Retest: Price pulled back to test both the horizontal and trendline support (yellow circle) – showing confluenceVolume: Stable but likely to increase on breakout continuation🎯 Targets & SLTake-Profit (TP):TP1: $11.640 (minor resistance)TP2: $11.733 (strong resistance zone)Stop-Loss (SL):Below $11.457 – protects from fakeouts⚖️ Risk-Reward Estimate:R:R Ratio: Around 2:1 – good for swing or intraday moveBias: Bullish (continuation from consolidation breakout)🧠 Trade LogicBullish ascending triangle held supportEntry after a retest = better confirmationStrong candle close above yellow zone would increase conviction

VIPROSE
KuCoin Token ($KCS) Price Analysis

📢#KCS is trading within an ascending channel, with price action showing a possible retest of the lower boundary as support. The market is currently in a corrective phase, possibly forming a higher low before resuming the uptrend.⛔️Support Zone: Between $8.75 - $9.00 – potential buying area for a rebound. 💬First Target: $19.40 – a key resistance level where profit-taking might occur.
ProfittoPath

📈 ** 🚀** ✅ **Pattern:** Symmetrical triangle breakout 🔺 🎯 **Entry:** ~$13.46 🛑 **Stop Loss:** Below $13.09 🎯 **Targets:** - **TP1:** $14.02 🔥 - **TP2:** $14.68+ 🚀 📊 **Confirmation:** Needs strong volume for breakout 📈 #CryptoTrading 🔥 #KCS #BreakoutTrade 🚀 #Bullish

GohelPrakasha
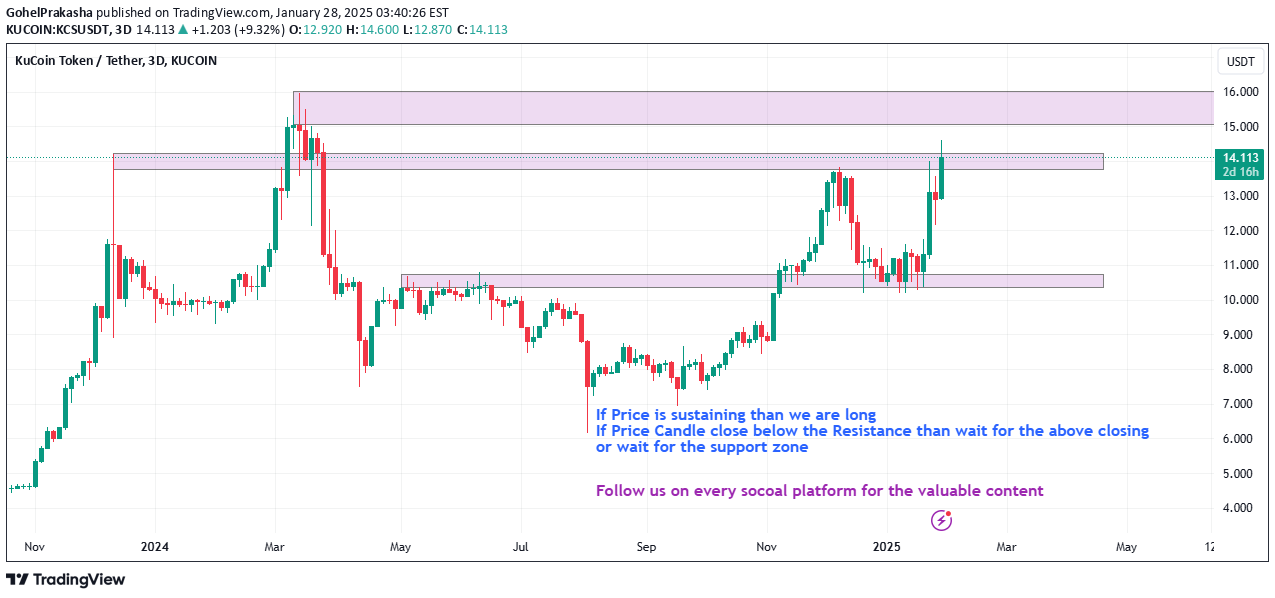
Hello,Price Action Analysis Interprets Market Movements Using Patterns And Trends On Price Charts.👉👉👉Check Below Details For Live Market Views/Trades/Analysis/News Updates.
ProfittoPath

**🚀 📊**- **SL (Stop-Loss):** 13.013 🔴 - **Entry:** 13.400 🟡 - **T1 (Target 1):** 13.811 🟢 - **T2 (Target 2):** 14.318 🟢 👉 Wait for a confirmed breakout above the resistance level for better entry timing. Always manage your risk effectively! 💹 #KCSUSDT #CryptoTrading #LongTrade #TechnicalAnalysis #TradingSetup #CryptoMarket #RiskManagement
ProfittoPath

Here’s the **KCS/USDT Short Trade Setup** based on the chart:---**🚨 📉**- **SL (Stop-Loss):** 13.509 🔴 - **Entry:** 13.185 🟡 - **T1 (Target 1):** 13.000 🟢 - **T2 (Target 2):** 12.573 🟢 👉 Wait for confirmation of rejection at resistance before entering. Always manage your risk effectively! 💹 #KCSUSDT #CryptoTrading #ShortTrade #TechnicalAnalysis #TradingSetup #CryptoMarket #RiskManagement
Disclaimer
Any content and materials included in Sahmeto's website and official communication channels are a compilation of personal opinions and analyses and are not binding. They do not constitute any recommendation for buying, selling, entering or exiting the stock market and cryptocurrency market. Also, all news and analyses included in the website and channels are merely republished information from official and unofficial domestic and foreign sources, and it is obvious that users of the said content are responsible for following up and ensuring the authenticity and accuracy of the materials. Therefore, while disclaiming responsibility, it is declared that the responsibility for any decision-making, action, and potential profit and loss in the capital market and cryptocurrency market lies with the trader.