
JOE
JOE
| تریدر | نوع سیگنال | حد سود/ضرر | زمان انتشار | مشاهده پیام |
|---|---|---|---|---|
No results found. | ||||
Price Chart of JOE
سود 3 Months :
سیگنالهای JOE
Filter
Sort messages by
Trader Type
Time Frame

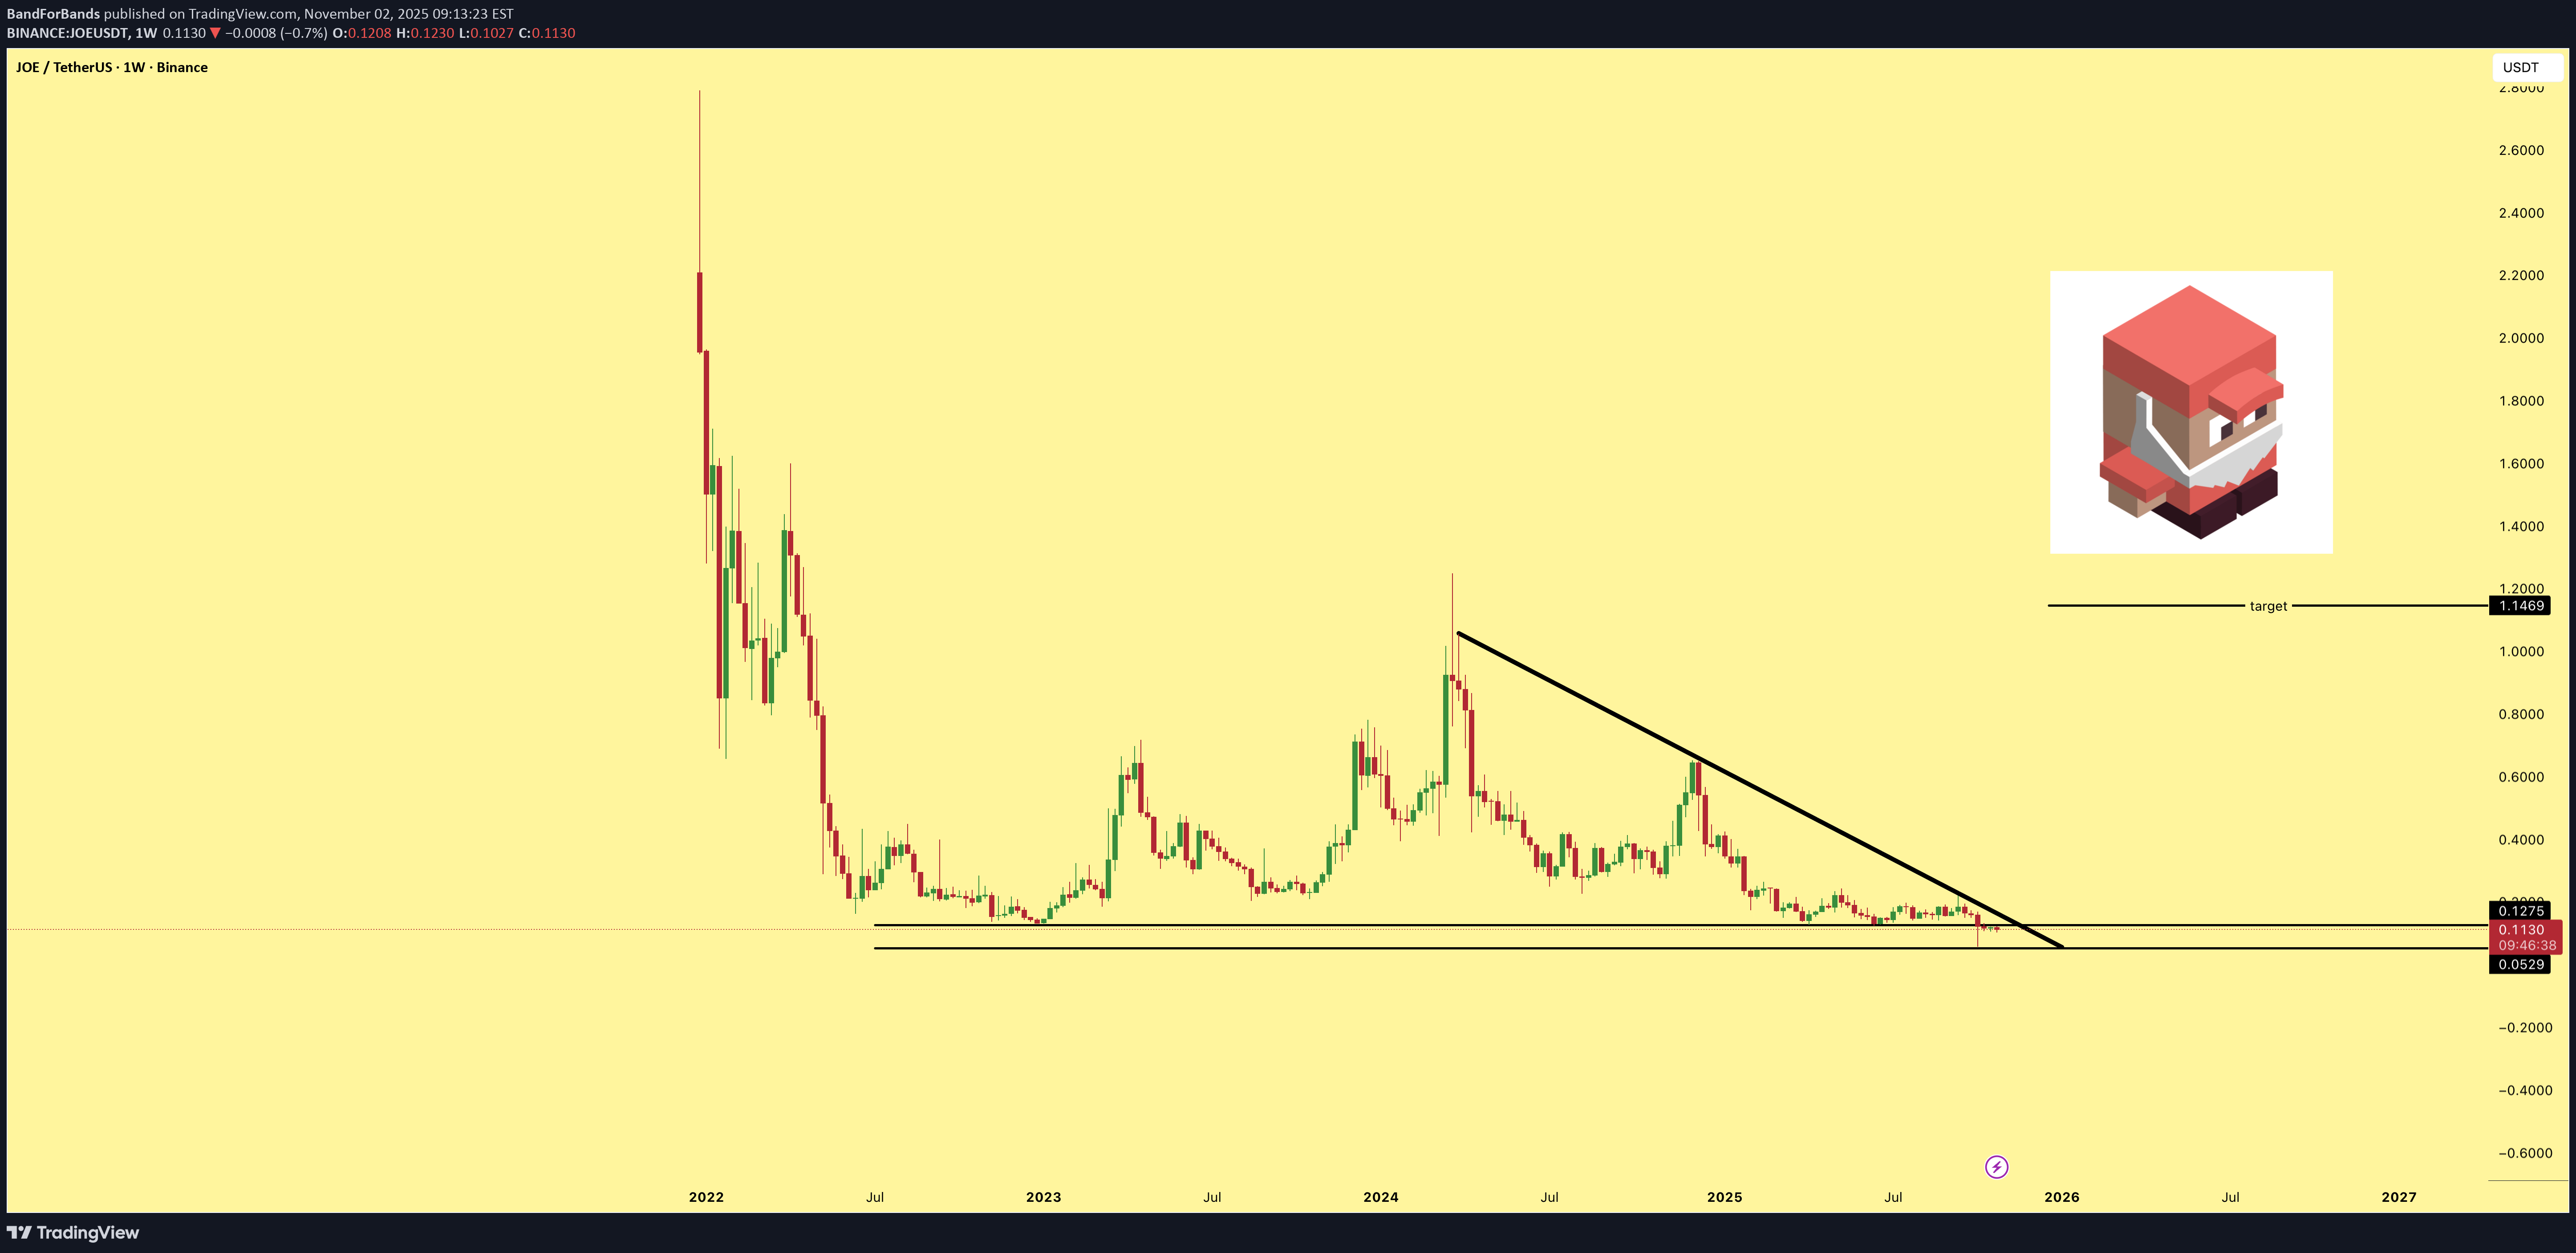
BandForBands

CryptoNuclear
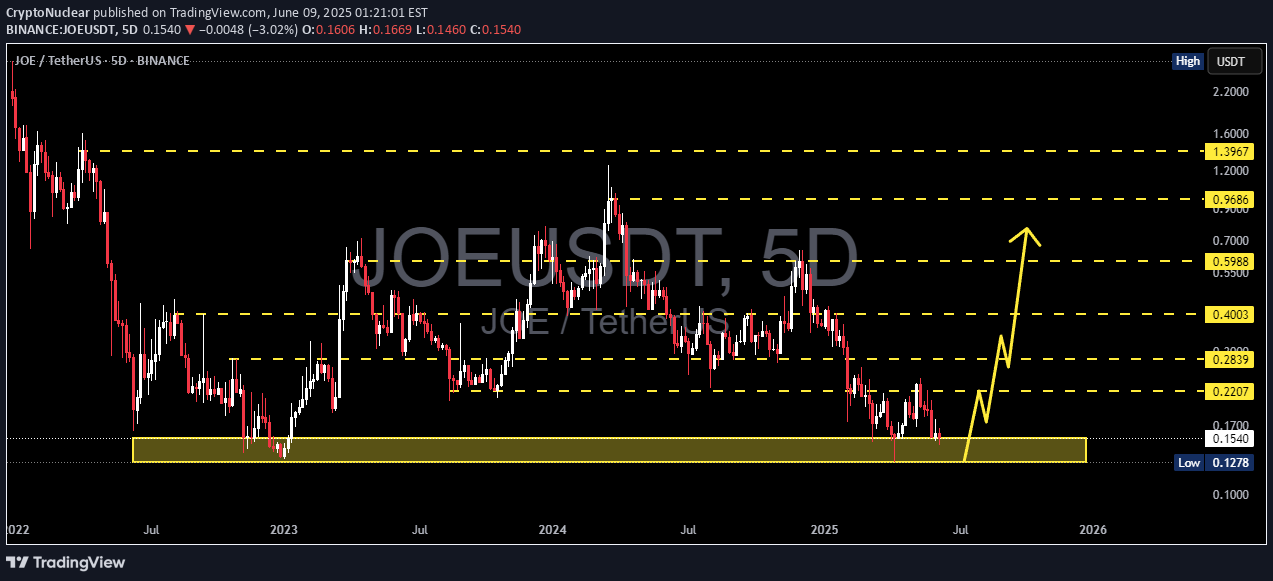
JOE/USDT در نقطه عطف: آیا روند معکوس بزرگ آغاز میشود یا سقوط نهایی در راه است؟

The price of JOE is currently sitting on a critical historical support zone around $0.1517 – $0.1241 (highlighted in yellow). This area has repeatedly acted as a strong demand zone since 2023, suggesting a potential accumulation base for mid-term investors. However, each retest without a strong rebound increases the probability of a breakdown. This phase could mark the decisive turning point for JOE’s next major move. --- Market Structure & Pattern Primary trend: Long-term downtrend with consistent Lower Highs pressing the market structure downward. Current phase: Sideways consolidation within a strong demand zone, signaling possible base formation. Price behavior: Decreasing volatility and declining volume — often characteristic of an accumulation phase before a breakout move. --- Bullish Scenario 1. Key confirmation: A 5D candle close above $0.2332 would break the most recent lower high structure. 2. Follow-up signal: Retest of the $0.1885 level as new support, accompanied by rising volume. 3. Upside targets: Stage 1 → $0.4087 Stage 2 → $0.6254 Stage 3 (major reversal extension) → $0.9569 – $1.4642 4. Macro context: A rebound from this zone could signal the start of a mid-term trend reversal, similar to the 2023 recovery phase. --- Bearish Scenario 1. Confirmation: A 5D close below $0.1241 with strong selling volume. 2. Implication: Opens room for a decline toward $0.09, or potentially a deeper correction if selling momentum accelerates. 3. Warning sign: Consistent rejection near $0.1885 without a breakout indicates strong supply pressure still dominating the market. --- Strategic Approach Aggressive (Early Buyers): Gradual accumulation within $0.14–$0.151, stop loss below $0.124. Conservative (Confirmation Traders): Wait for a confirmed 5D breakout above $0.2332 before entry. Mid-term profit targets: $0.4087 and $0.6254 with partial take profits on strength. Risk management: Keep trade risk ≤3% of portfolio and avoid full allocation before direction confirmation. --- Conclusion The $0.1517–$0.1241 zone remains the last major defense for bulls. If this level holds, JOE could form a strong foundation for a trend reversal. But if it breaks, the market may revisit deeply undervalued levels near $0.09. Currently, JOE is at a crossroad between accumulation and capitulation — a stage that often precedes the next major move in the market. --- #JOE #JOEUSDT #Crypto #Altcoins #DeFi #TechnicalAnalysis #CryptoAnalysis #BreakoutSetup #AccumulationZone #MarketStructure #SwingTrading

ZEUS_Market_Alerts
JOE ANALYSIS
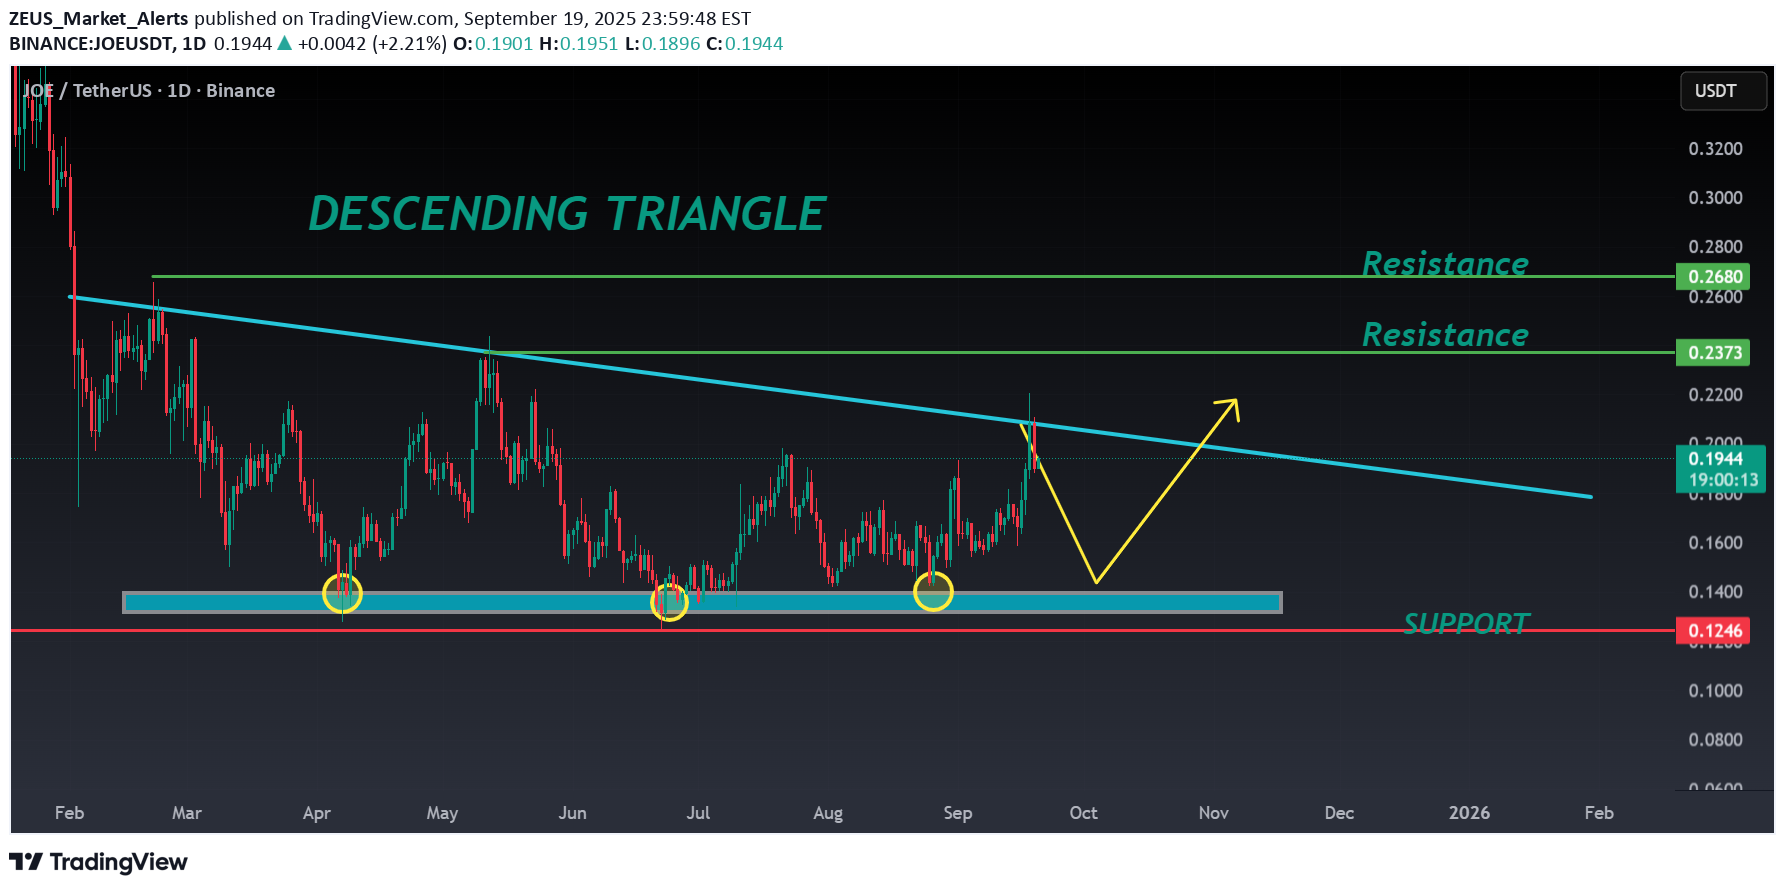
📊#JOE Analysis ✅There is a formation of Descending triangle pattern on daily chart🧐 Pattern signals potential bullish movement incoming after a small retest 📉 👀Current Price: $0.1944 🚀 Target Price: $0.2370 ⚡️What to do ? 👀Keep an eye on #JOE price action and volume. We can trade according to the chart and make some profits⚡️⚡️ #JOE #Cryptocurrency #TechnicalAnalysis #DYOR

Alpha-GoldFX
JOEUSDT Forming Bullish Momentum
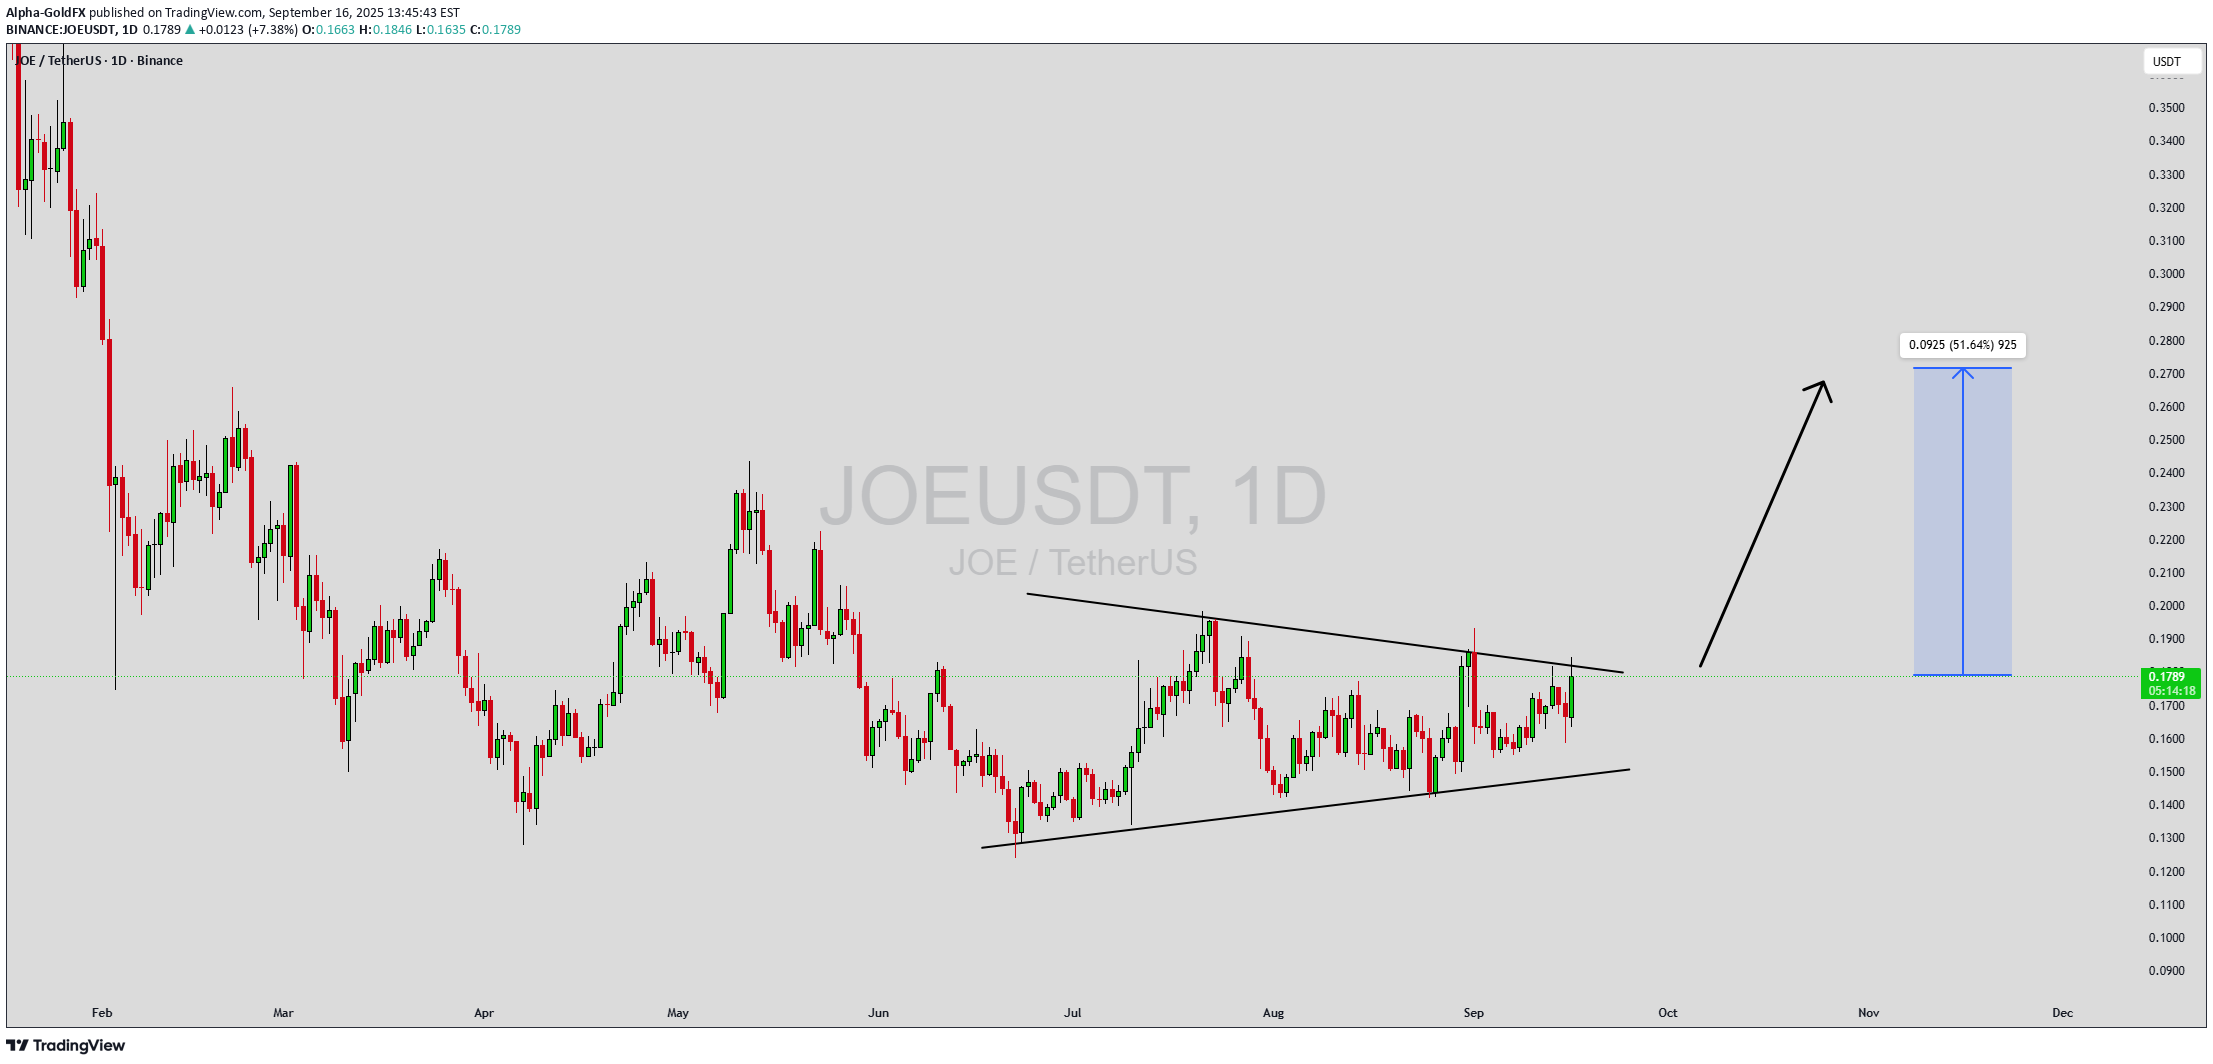
JOEUSDT is forming a strong technical structure that signals potential bullish momentum. The chart indicates price consolidation within a tightening range, often a precursor to a breakout move. With good trading volume supporting the current price action, the conditions are aligning for a significant upside move. Once resistance is cleared, the market could gain momentum quickly, pushing JOEUSDT into higher valuation zones. Based on the current setup, expectations are pointing toward a 40% to 50%+ potential gain. This projection aligns with the broader bullish sentiment and the accumulation phase observed over the past weeks. Breakouts from such patterns often lead to fast rallies as traders and investors enter aggressively to catch the trend early. Investor interest is steadily increasing in this project, highlighting growing demand and confidence in its potential. With technicals and volume aligning, JOEUSDT may offer strong opportunities for both short-term traders and long-term holders. If momentum continues, the pair is well-positioned for a healthy bullish run in the coming sessions. ✅ Show your support by hitting the like button and ✅ Leaving a comment below! (What is You opinion about this Coin) Your feedback and engagement keep me inspired to share more insightful market analysis with you!

Thebitcoin37
JOEUSDT TRADE ANALYSIS.
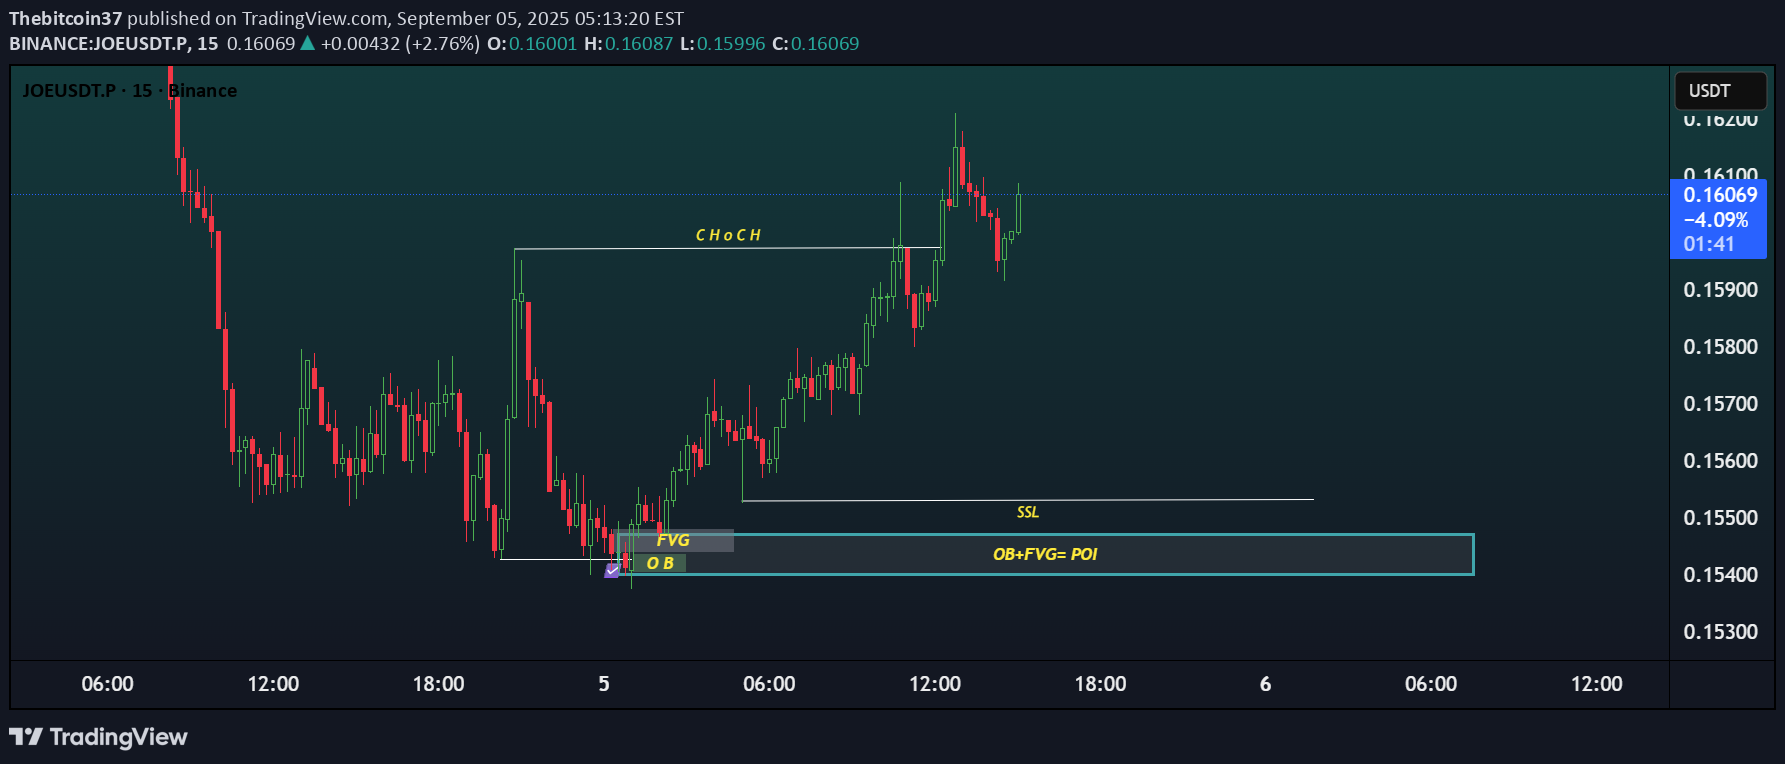
OEUSDT – 15m Analysis Bias: ✅ Bullish continuation possible Key Structure Update: Clear CHoCH marked – shift from bearish → bullish order flow. Price already broke short-term structure and is pulling back. POI Level: OB + FVG confluence zone at 0.154–0.155 USDT. SSL liquidity sits just above this zone, likely inducement before continuation. Trade Plan: Ideal scenario: price taps into OB + FVG = POI for confirmation (bullish candle or rejection wick). Continuation target would be 0.162–0.164 USDT zone. Premium Note: As long as structure holds above POI, bullish momentum remains valid. If price closes below 0.154 USDT, bias weakens and invalidation triggers. ⚠️ Summary: Waiting for a drop into 0.154–0.155 USDT demand zone (OB + FVG). A confirmed reaction there can give a bullish leg continuation toward 0.162–0.164.

Captain-MAO
JOE/USDT

After a prolonged downtrend, JOE/USDT is showing strong signs that the bearish cycle is nearly over. On the daily timeframe, price has delivered a clean breakout above the trendline, followed by a successful retest of structure

ارز joe در کف قیمتی: فرصت ورود به بازار؟ 📈
Currency JOE at the price of the price.
CryptoNuclear
JOE/USDT Approaching a Major Turning Point: Will Buyers Step In?

🔎 Market Overview & Structure: JOE/USDT is currently trading within a major historical demand zone between $0.1241 – $0.1548, a level that has proven to be a strong support since early 2023. Each time the price revisits this area, we’ve seen significant bounces — indicating that buyers continue to defend this zone aggressively. However, the macro structure still reflects a clear long-term downtrend from its all-time high. --- 🧠 Why This Zone Matters (Demand Zone Characteristics): This zone has been tested multiple times and remains intact, showing strong buyer interest and accumulation. It acts as the final defense before a possible major breakdown. Institutions and smart money often accumulate in zones like this – making it a Low Risk, High Reward area. --- 🟢 Bullish Scenario – Is a Mid-Term Reversal Brewing? If the price holds above the $0.1241 level and breaks through $0.1885: 1. A reversal pattern (base or double bottom) may form. 2. Potential upside targets: 🎯 TP1: $0.1885 → First resistance breakout 🎯 TP2: $0.2332 → Key horizontal resistance 🎯 TP3: $0.4087 → Next major supply zone 🎯 TP4 (Mid-Term): $0.6254 – $0.9569 if strong bullish momentum continues 3. A daily or 5D candle close above $0.2332 with high volume would confirm a trend shift to the upside. --- 🔴 Bearish Scenario – Danger of Breakdown: If the price breaks below $0.1241: A new Lower Low structure will confirm continued bearish trend. There's no major historical support below this zone, opening the door for a sharp decline into uncharted territory. This would signal renewed seller dominance and likely a prolonged bearish phase. --- 📐 Price Patterns & Structure: Current price action resembles an accumulation range or base formation. Possibility of: 🔁 Double Bottom ⏳ Adam & Eve Reversal Pattern A breakout from this range could spark a strong upside rally. --- 💡 Strategy Insights: Accumulation Entry Zone: $0.1241 – $0.1548 with tight stop-loss. Bullish Confirmation: Breakout and close above $0.1885 with volume. Bearish Confirmation: Daily close below $0.1241 → avoid longs, consider shorts. --- 📌 Conclusion: JOE/USDT is at a make-or-break level. This is a key decision point where the price could either start a mid-term bullish reversal or fall into deeper bearish territory. For long-term investors, this is a potential accumulation zone with favorable risk-reward. For traders, it's time to watch closely for breakout or breakdown confirmations. #JOEUSDT #CryptoAnalysis #Altcoins #BreakoutTrading #ReversalZone #DemandZone #TechnicalAnalysis #JOEToken #CryptoSetup

Bithereum_io
JOEUSDT 1D

#JOE is moving inside a symmetrical triangle on the daily chart and has bounced nicely off the triangle support. 📌 In case of a breakout above the triangle resistance and the daily SMA100, the potential upside targets are: 🎯 $0.2005 🎯 $0.2478 🎯 $0.2861 🎯 $0.3244 🎯 $0.3789 🎯 $0.4483 ⚠️ As always, use a tight stop-loss and apply proper risk management.
CryptoNuclear
Disclaimer
Any content and materials included in Sahmeto's website and official communication channels are a compilation of personal opinions and analyses and are not binding. They do not constitute any recommendation for buying, selling, entering or exiting the stock market and cryptocurrency market. Also, all news and analyses included in the website and channels are merely republished information from official and unofficial domestic and foreign sources, and it is obvious that users of the said content are responsible for following up and ensuring the authenticity and accuracy of the materials. Therefore, while disclaiming responsibility, it is declared that the responsibility for any decision-making, action, and potential profit and loss in the capital market and cryptocurrency market lies with the trader.