
ICP
Internet Computer
| تریدر | نوع سیگنال | حد سود/ضرر | زمان انتشار | مشاهده پیام |
|---|---|---|---|---|
 CryptoAnalystSignalRank: 30933 | خرید | حد سود: تعیین نشده حد ضرر: تعیین نشده | 12/18/2025 | |
 coinpediamarketsRank: 31423 | خرید | حد سود: تعیین نشده حد ضرر: تعیین نشده | 12/15/2025 |
Price Chart of Internet Computer
سود 3 Months :
خلاصه سیگنالهای Internet Computer
سیگنالهای Internet Computer
Filter
Sort messages by
Trader Type
Time Frame

Kap_Waves
Internet Computer’s Next Move Hinges on a Single Count

Internet Computer is trading at a level that places the market at a clear structural crossroads, where both bullish continuation and deeper corrective risk remain technically valid. From a constructive perspective, the recent low may already represent the start of a new Wave 1 In this scenario, price action is attempting to advance into Wave C of an expanded flat correction. The structure of the advance favors an expanded flat rather than a running flat, as the latter fails to align with proportional Fibonacci measurements. In both bullish and bearish counts, the current projection only remains coherent if the broader correction resolves as an expanded flat. As long as the recent low is respected, the market retains the potential to build a base and progress higher within this framework. An alternative outcome emerges if price violates the marked low. Such a move would negate the immediate bullish interpretation and shift focus toward deeper downside extensions. Under this scenario, ICP could seek support within the 1.382, 1.414, and 1.618 projection zones, areas that typically attract corrective exhaustion. A reaction from those levels would still be consistent with a larger expanded flat, allowing for a subsequent rebound to complete Wave C before the market reveals its longer-term direction. For now, ICP remains balanced between confirmation and invalidation. The behavior around the recent low will determine whether the market is already transitioning into a new impulsive phase or requires one more decline to complete the broader corrective structure.

likwit
This might explode
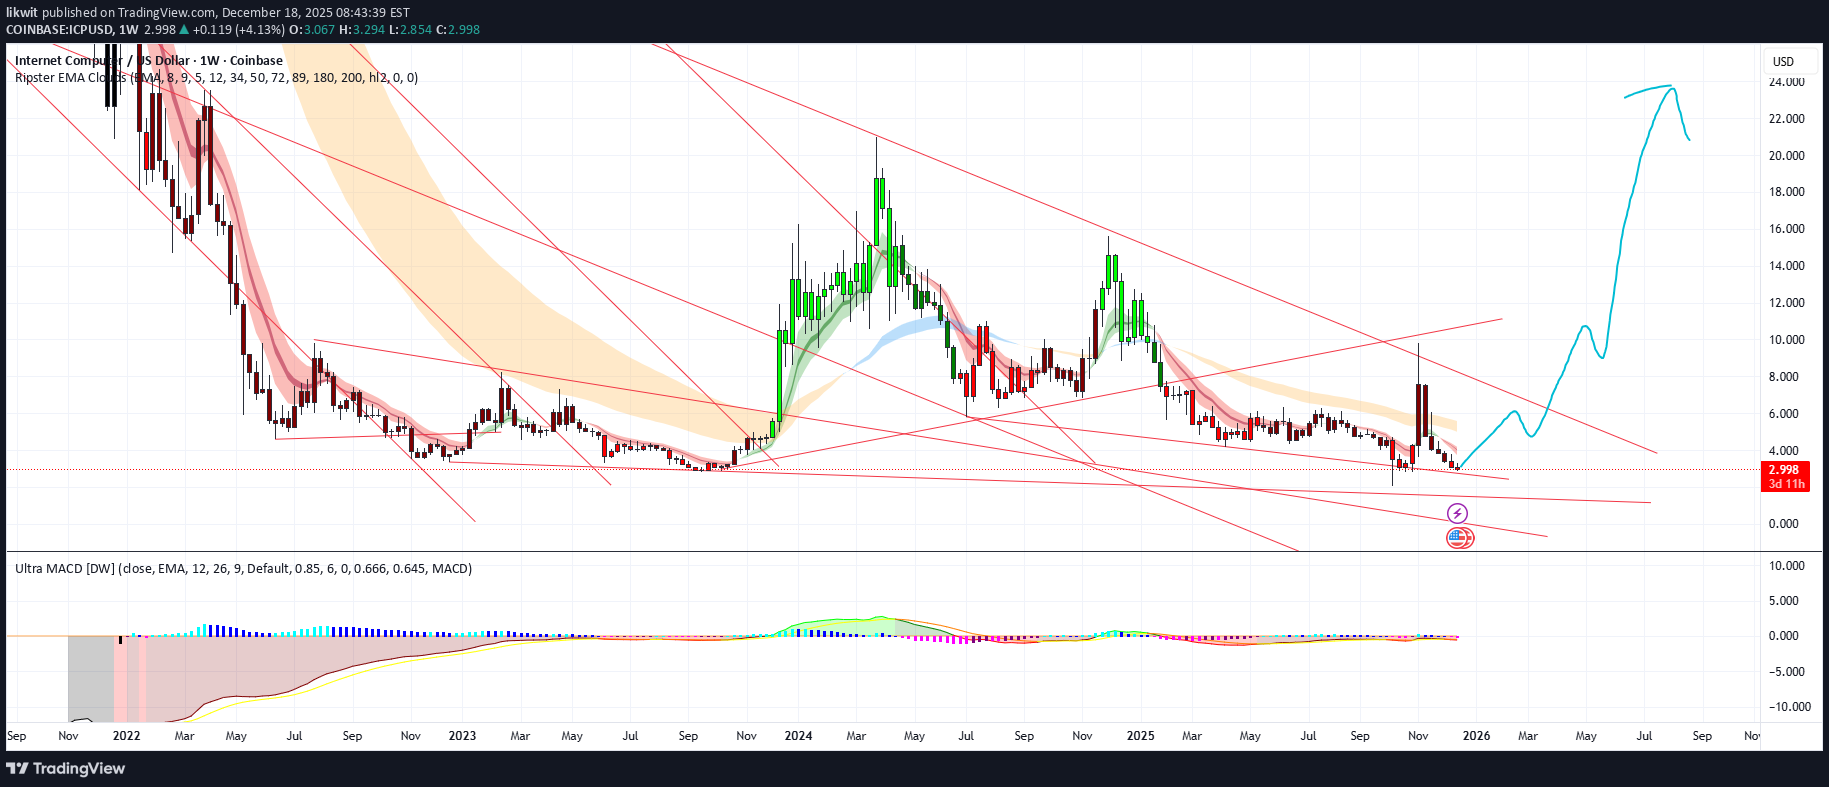
If we can breakout and make a solid base at 15-20$, I can see ICP getting to $200 in 2028.
CryptoAnalystSignal
آیا ICP آماده انفجار صعودی است؟ تحلیل کلیدی برای خرید در سطح ۲.۸۰!
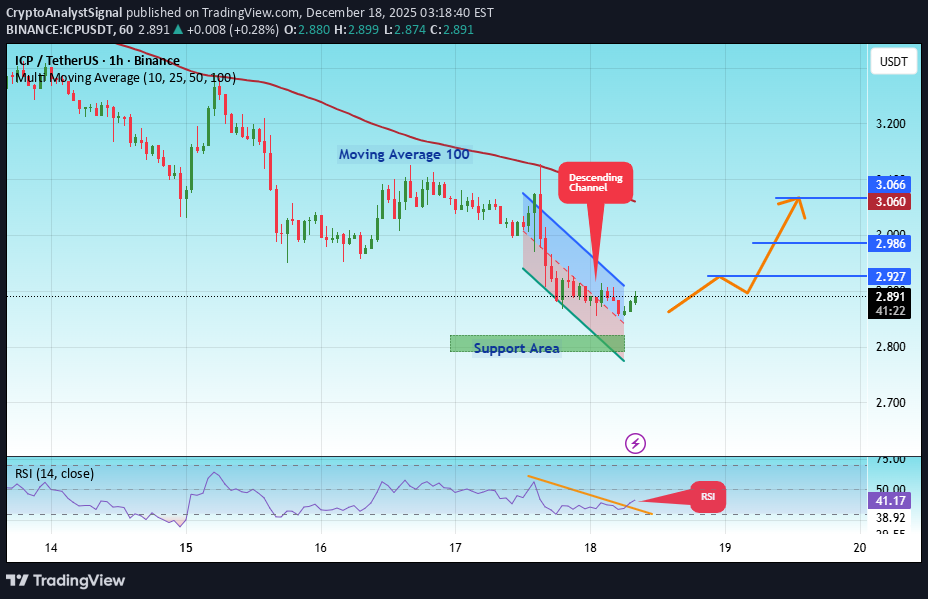
#ICP The price is moving in a descending channel on the 1-hour timeframe. It has reached the lower boundary and is heading towards breaking above it, with a retest of the upper boundary expected. We have a downtrend on the RSI indicator, which has reached near the lower boundary, and an upward rebound is expected. There is a key support zone in green at 2.80. The price has bounced from this zone multiple times and is expected to bounce again. We have a trend towards consolidation above the 100-period moving average, as we are moving close to it, which supports the upward movement. Entry price: 2.88 First target: 2.92 Second target: 2.98 Third target: 3.06 Don't forget a simple principle: money management. Place your stop-loss below the support zone in green. For any questions, please leave a comment. Thank you.#ICP First target: 2.92 Reached Second target: 2.98 Reached Third target: 3.06 Reached
coinpediamarkets
$ICPUSDT — Last Buying Zone in Play!
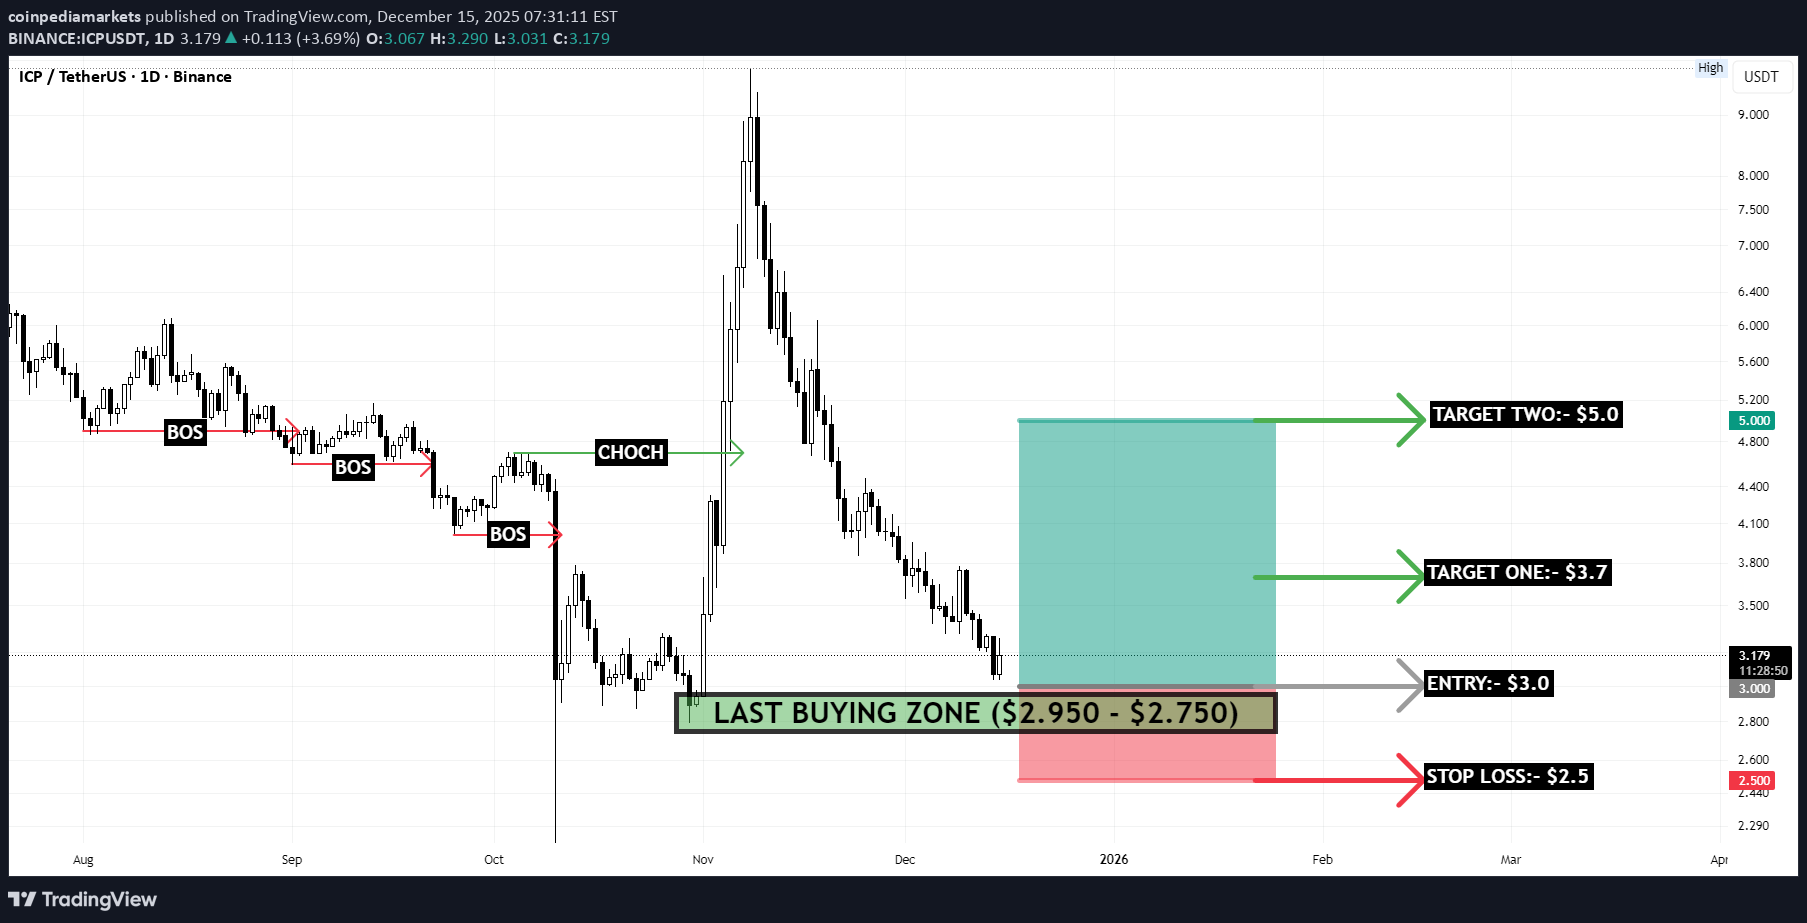
ICPUSDT has retraced back into the last buying zone (2.95 – 2.75) after a strong impulsive move that confirmed a bullish CHoCH on the daily timeframe. This area represents the final demand supporting the current bullish structure, and the ongoing reaction suggests buyers are still defending this zone. As long as price holds above the 3.00 entry region, the setup remains constructive, with upside targets positioned at 3.70 for the first expansion and 5.00 as the higher-timeframe liquidity objective. These targets align with prior structure and unfilled inefficiencies on the chart. This last buying zone is critical. A clean break below 2.75 would invalidate the bullish thesis and expose price to deeper downside, with risk clearly defined by the stop-loss at 2.50. Given the volatility, strict risk management is essential. For more structured market breakdowns and higher-timeframe insights, make sure to like and comment.TRADE ACTIVATED, MANAGE YOUR RISK ACCORDINGLY
CryptoAnalystSignal
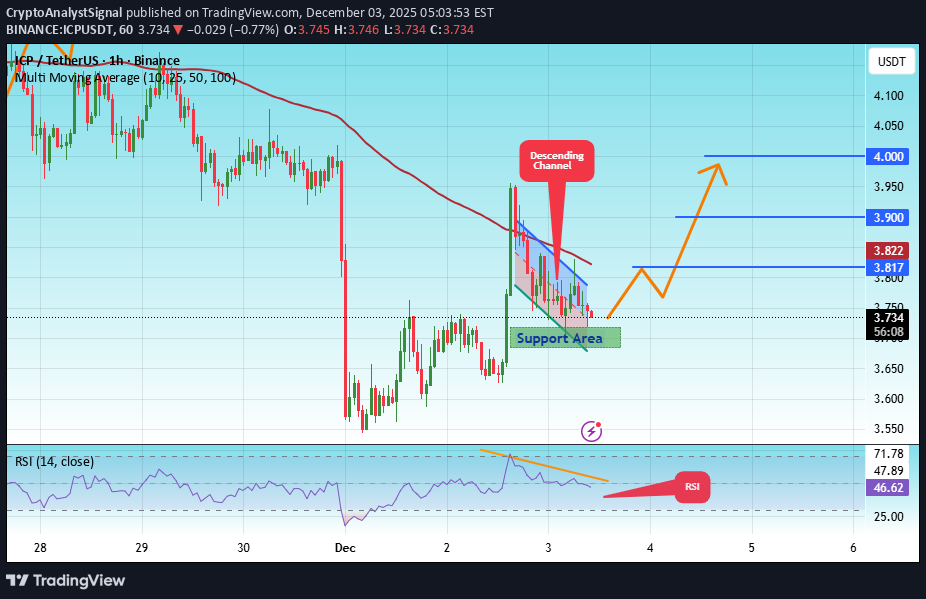
تحلیل تکنیکال ICP/USDT: احتمال بازگشت قدرتمند از حمایت کلیدی (اهداف جدید اعلام شد!)
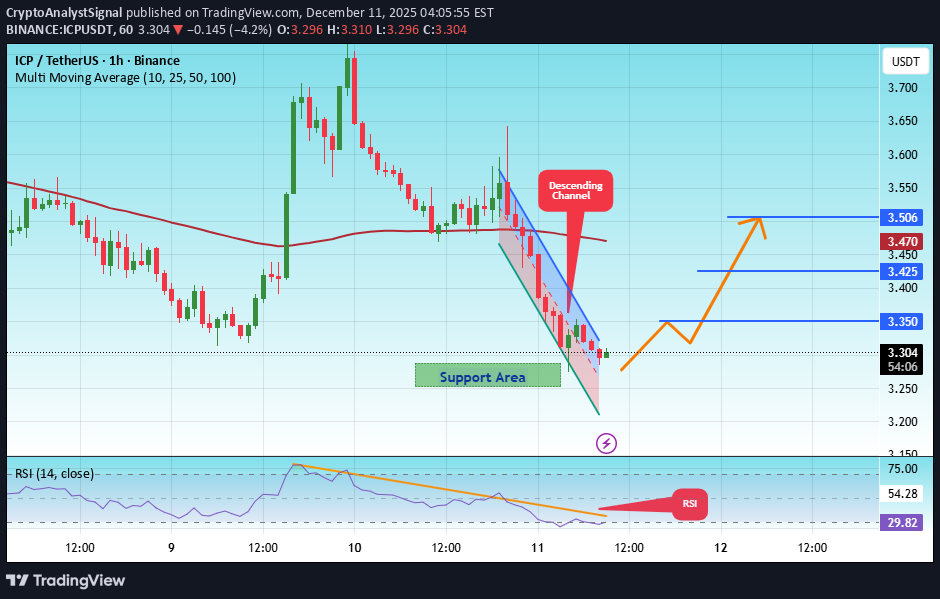
#ICP The price is moving in a descending channel on the 1-hour timeframe. It has reached the lower boundary and is heading towards breaking above it, with a retest of the upper boundary expected. We have a downtrend on the RSI indicator, which has reached near the lower boundary, and an upward rebound is expected. There is a key support zone in green at 3.25. The price has bounced from this zone multiple times and is expected to bounce again. We have a trend towards consolidation above the 100-period moving average, as we are moving close to it, which supports the upward movement. Entry price: 3.30 First target: 3.35 Second target: 3.43 Third target: 3.50 Don't forget a simple principle: money management. Place your stop-loss below the support zone in green. For any questions, please leave a comment. Thank you.#ICP First target: 3.35 Reached Second target: 3.43 Reached

mastercrypto2020
سیگنال خرید فوری ICP/USDT: ورود، اهداف و حد ضرر (لوریج ۵ تا ۱۰ برابر)
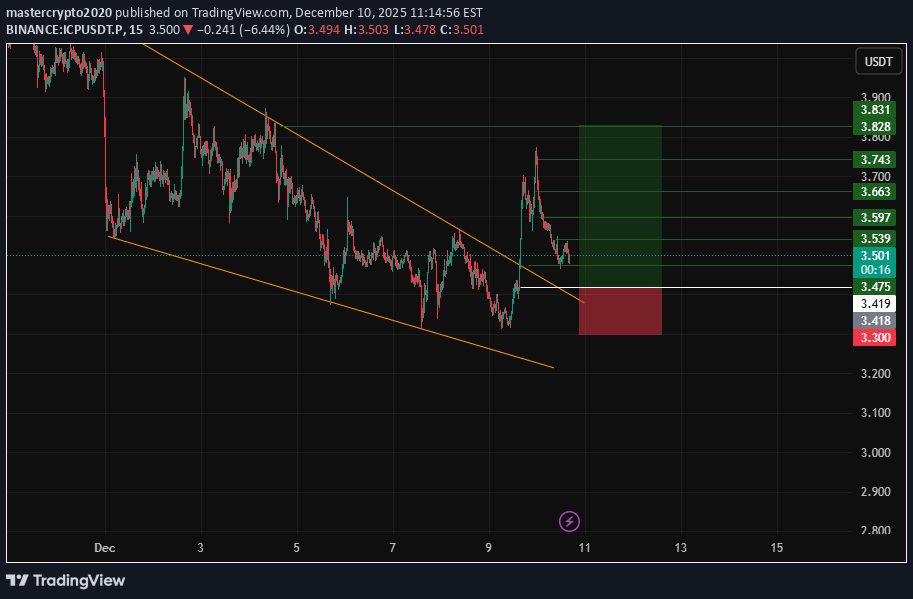
--- 📢 Official Trade Signal – ICP/USDT 📈 Position Type: LONG 💰 Entry Price: 3.419 --- 🎯 Take-Profit Targets (Partial Exits): • TP1: 3.472 • TP2: 3.541 • TP3: 3.596 • TP4: 3.660 • TP5: 3.743 • TP6: —3.828 --- 🛑 Stop-Loss: 3.300 📊 Timeframe: 15m ⚖️ Risk/Reward Ratio: ≈ 2.03 (based on TP4) 💥 Suggested Leverage: 5× – 10× --- 🧠 Technical Analysis Summary ICP is showing signs of bullish momentum after finding support near the 3.419 level. The market structure on the 15-minute chart indicates a potential upward shift, with price action forming higher lows and testing key resistance zones. The identified take-profit levels align with previous swing highs and liquidity concentrations. The critical upside targets are: 3.472 → 3.541 → 3.596 → 3.660 A confirmed break above TP1 (3.472) is expected to accelerate momentum toward the subsequent targets, particularly if accompanied by increasing buying volume. --- ⚙️ Trade Management Rules ✔ Take partial profit at each TP level ✔ Move stop-loss to entry point once TP1 is reached ✔ Trail stop-loss upward as price advances ✔ No re-entry if stop-loss (3.300) is triggered ✔ Confirm bullish structure and momentum before entering --- 📌 TradingView Hashtags #ICPUSDT #ICP #CryptoSignal #LongSetup #TradingView #FuturesTrading #TechnicalAnalysis --- Disclaimer: Always practice proper risk management and verify market conditions before entering any trade.
CryptoAnalystSignal
تحلیل تکنیکال ICP: فرصت خرید در کف کانال نزولی با اهداف صعودی!
#ICP The price is moving in a descending channel on the 1-hour timeframe. It has reached the lower boundary and is heading towards breaking above it, with a retest of the upper boundary expected. We have a downtrend on the RSI indicator, which has reached near the lower boundary, and an upward rebound is expected. There is a key support zone in green at 3.40. The price has bounced from this zone multiple times and is expected to bounce again. We have a trend towards consolidation above the 100-period moving average, as we are moving close to it, which supports the upward move. Entry price: 3.43 First target: 3.48 Second target: 3.55 Third target: 3.63 Don't forget a simple principle: money management. Place your stop-loss below the green support zone. For any questions, please leave a comment. Thank you.#ICP First target: 3.48 Reached Second target: 3.55 Reached#ICP First target: 3.48 Reached Second target: 3.55 Reached Third target: 3.63 Reached
CryptoAnalystSignal
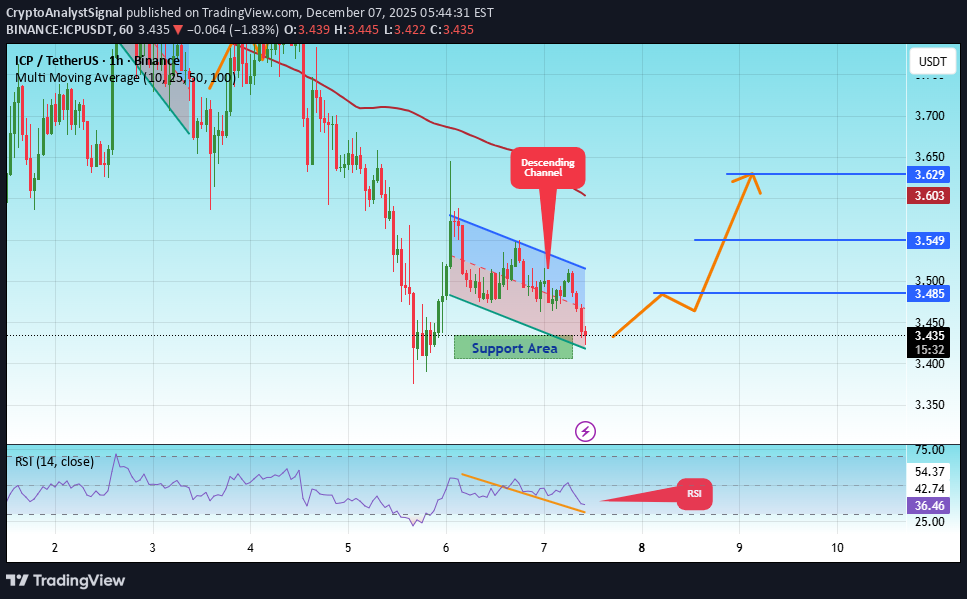
آیا این ارز دیجیتال (ICP) به زودی سقف جدید میزند؟ تحلیل دقیق و نقاط ورود/خروج!
#ICP The price is moving in a descending channel on the 1-hour timeframe. It has reached the lower boundary and is heading towards breaking above it, with a retest of the upper boundary expected. We have a downtrend on the RSI indicator, which has reached near the lower boundary, and an upward rebound is expected. There is a key support zone in green at 3.70. The price has bounced from this zone multiple times and is expected to bounce again. We have a trend towards stability above the 100-period moving average, as we are moving close to it, which supports the upward movement. Entry price: 3.74 First target: 3.82 Second target: 3.90 Third target: 4.00 Don't forget a simple principle: money management. Place your stop-loss below the green support zone. For any questions, please leave a comment. Thank you.#ICP First target: 3.82 Reached Second target: 3.90 Reached

صعود قاطع ICP: آیا زمان کسب سود فرا رسیده است؟

Man, the Internet Computer (ICP) bounced exactly from the level I was watching. It really looks like it’s starting to gain upward momentum now. You can feel the market shifting—buyers are stepping in, confidence is slowly returning, and the chart is finally showing some strength instead of that long consolidation we’ve been stuck in. Honestly, this is the kind of setup where patience starts to pay off. Anyone can panic on the dips, but holding your vision when the market is shaky is what separates real conviction from noise. If the trend continues like this, we might finally see the move we’ve been waiting for. Just stay focused, trust your analysis, and don’t let short-term volatility shake you out. Crypto rewards the ones who stay disciplined, not the ones who get scared by every red candle. Keep your strategy tight—good things are usually built quietly before they break out loud. Let’s see where ICP can go from here. 🚀

تحلیل هفتگی ICP/USDT: چه سرنوشتی در انتظار این ارز دیجیتال است؟
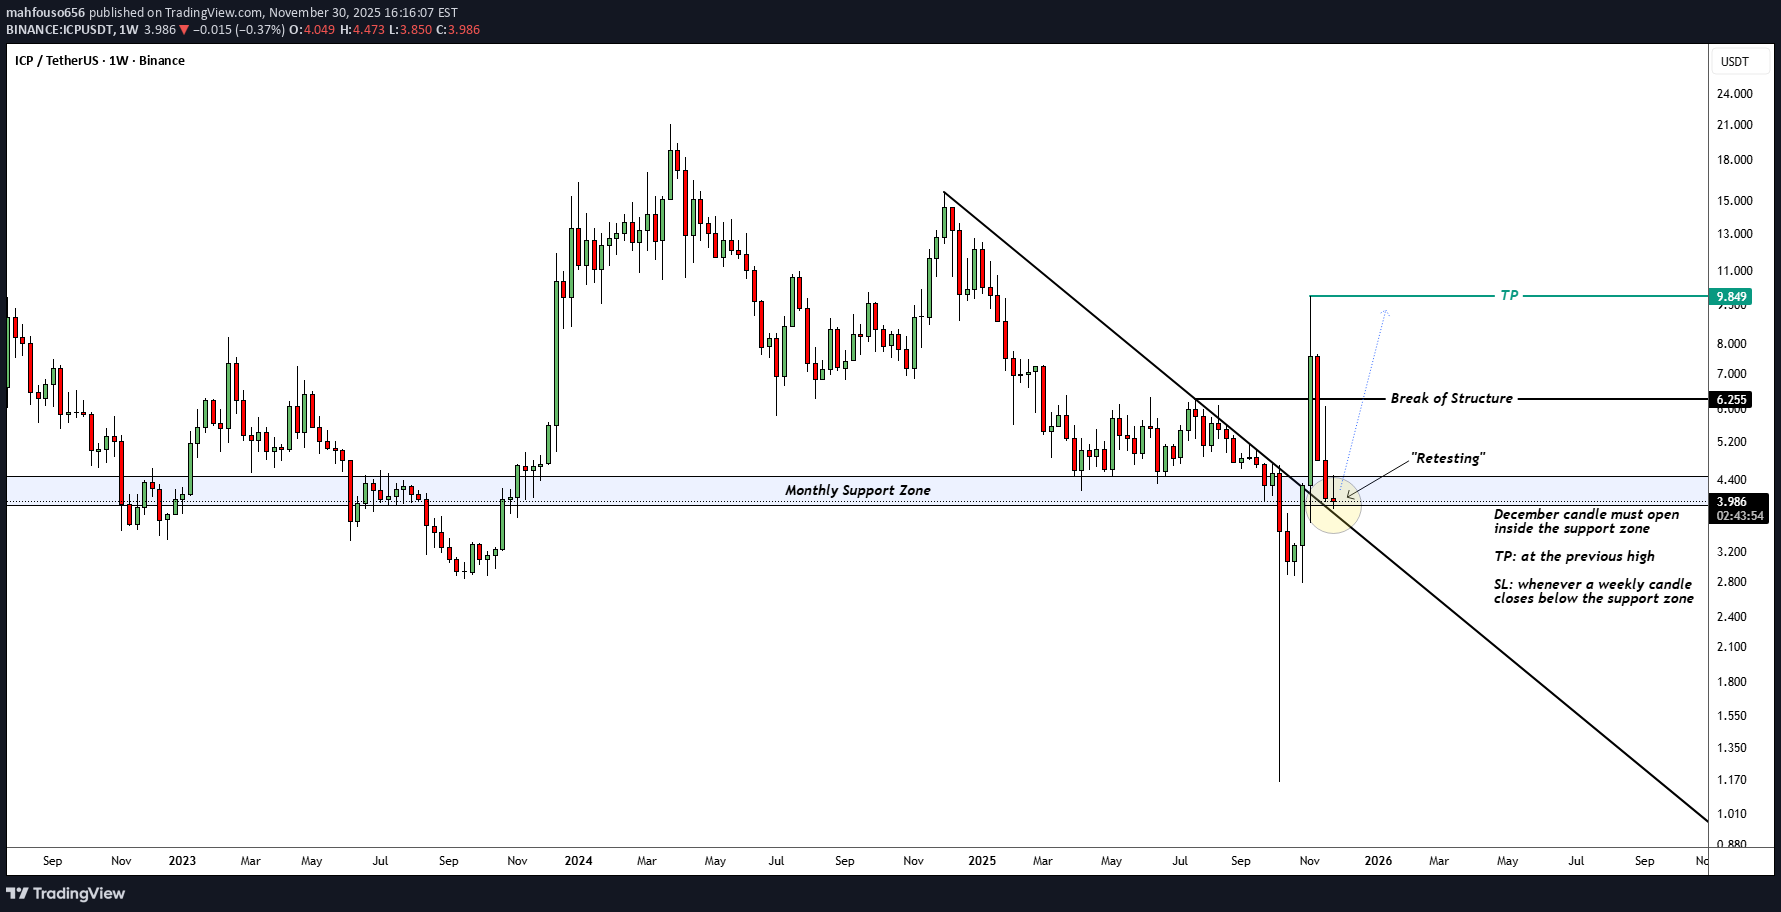
My view for ICPUSDT, everything is explained in the attached chart Not a financial advice https://www.tradingview.com/x/7QvGnj4E/
Disclaimer
Any content and materials included in Sahmeto's website and official communication channels are a compilation of personal opinions and analyses and are not binding. They do not constitute any recommendation for buying, selling, entering or exiting the stock market and cryptocurrency market. Also, all news and analyses included in the website and channels are merely republished information from official and unofficial domestic and foreign sources, and it is obvious that users of the said content are responsible for following up and ensuring the authenticity and accuracy of the materials. Therefore, while disclaiming responsibility, it is declared that the responsibility for any decision-making, action, and potential profit and loss in the capital market and cryptocurrency market lies with the trader.