
likwit
@t_likwit

What symbols does the trader recommend buying?
Purchase History
پیام های تریدر
Filter
likwit
This might explode
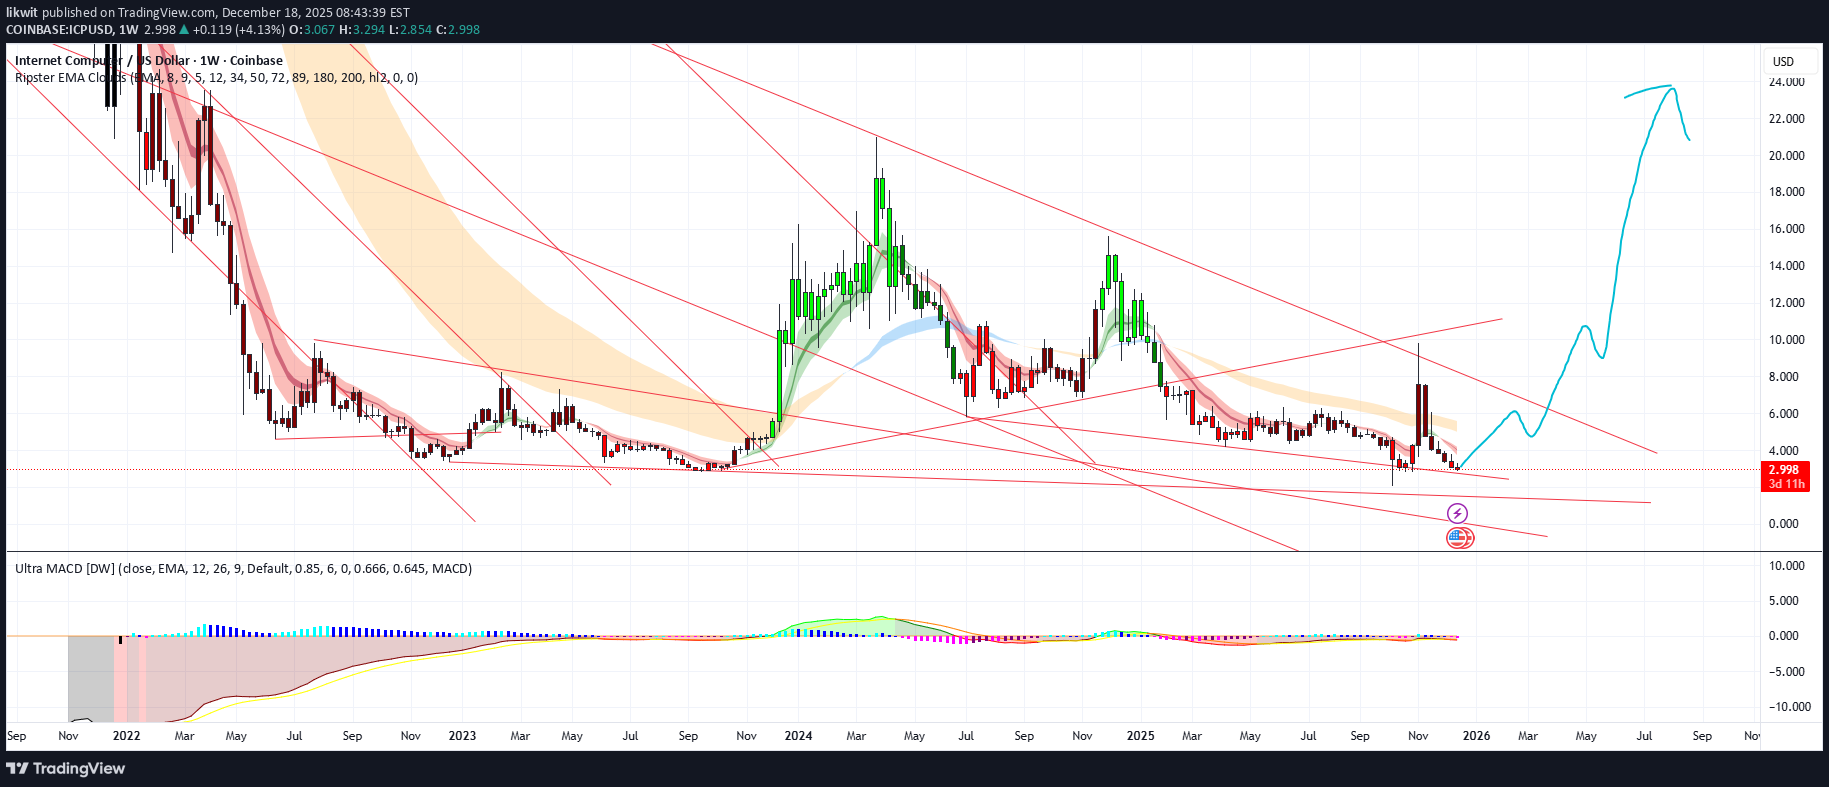
If we can breakout and make a solid base at 15-20$, I can see ICP getting to $200 in 2028.
likwit
Down. Then up.
See chart. Easy roadmap. If it brakes back above the trendline close the short.
likwit
Tesla technical
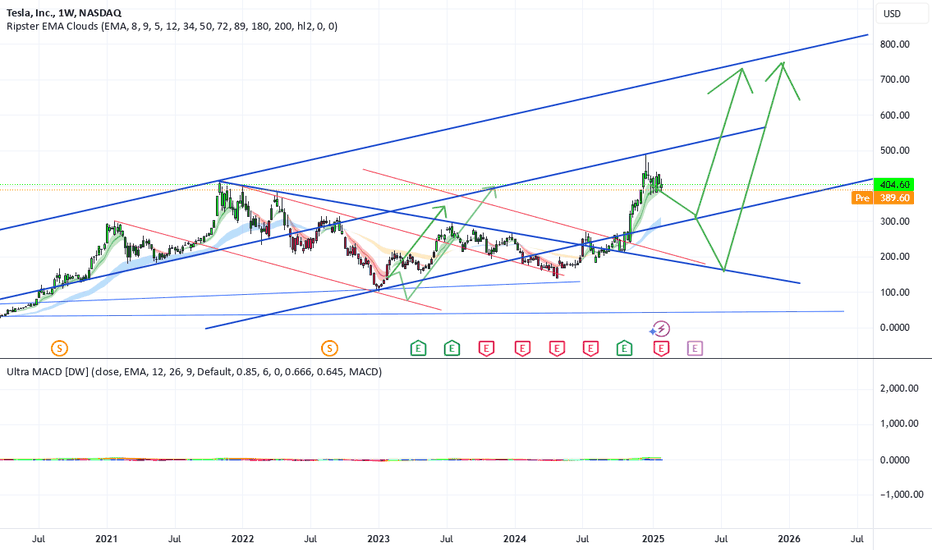
Last idea worked out well. Here is the new roadmap.Close the short now. You can either go long now, or wait for confirmation to get back above the blue line (weekly close above it). Ifwe will test the low one more time, we are looking at price to reach maximum 165$ in extreme case.We have some resistance here trying to break back into the blue-trendline-zone. After that it will be smooth sailing.So we have now pushed back into the blue trendline. Very bullish.So everything is set to push to $500-$800 now.I think it was to early. It moved sideways. Currently we are under the blue trendline again. It might push down all the way to $156 if the overall market will turn down.
likwit
Failure too get back into the channel
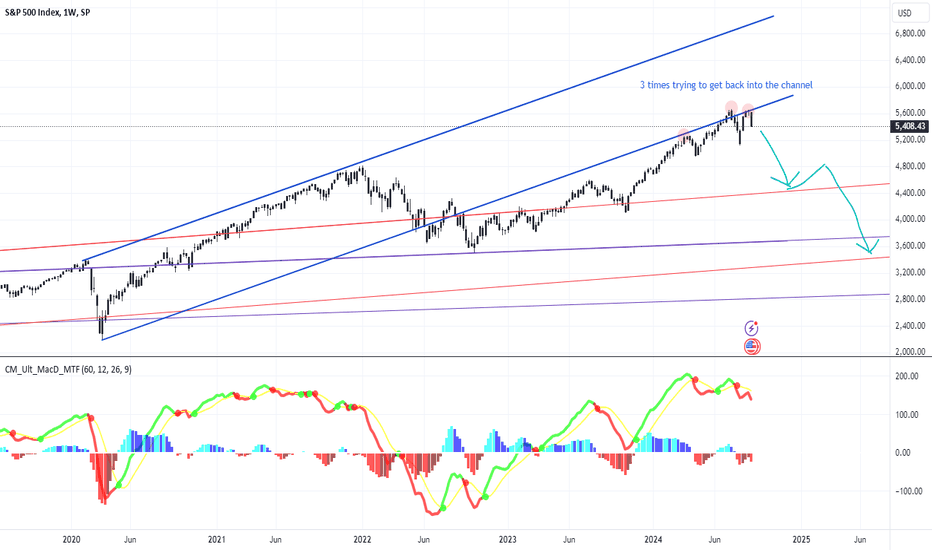
Weekly candles. Three times trying to get back into the channel. No succes. Closing this week below the 2020 trendline. We will go down. I will not be suprised if we wil see some -5% days this month.
likwit
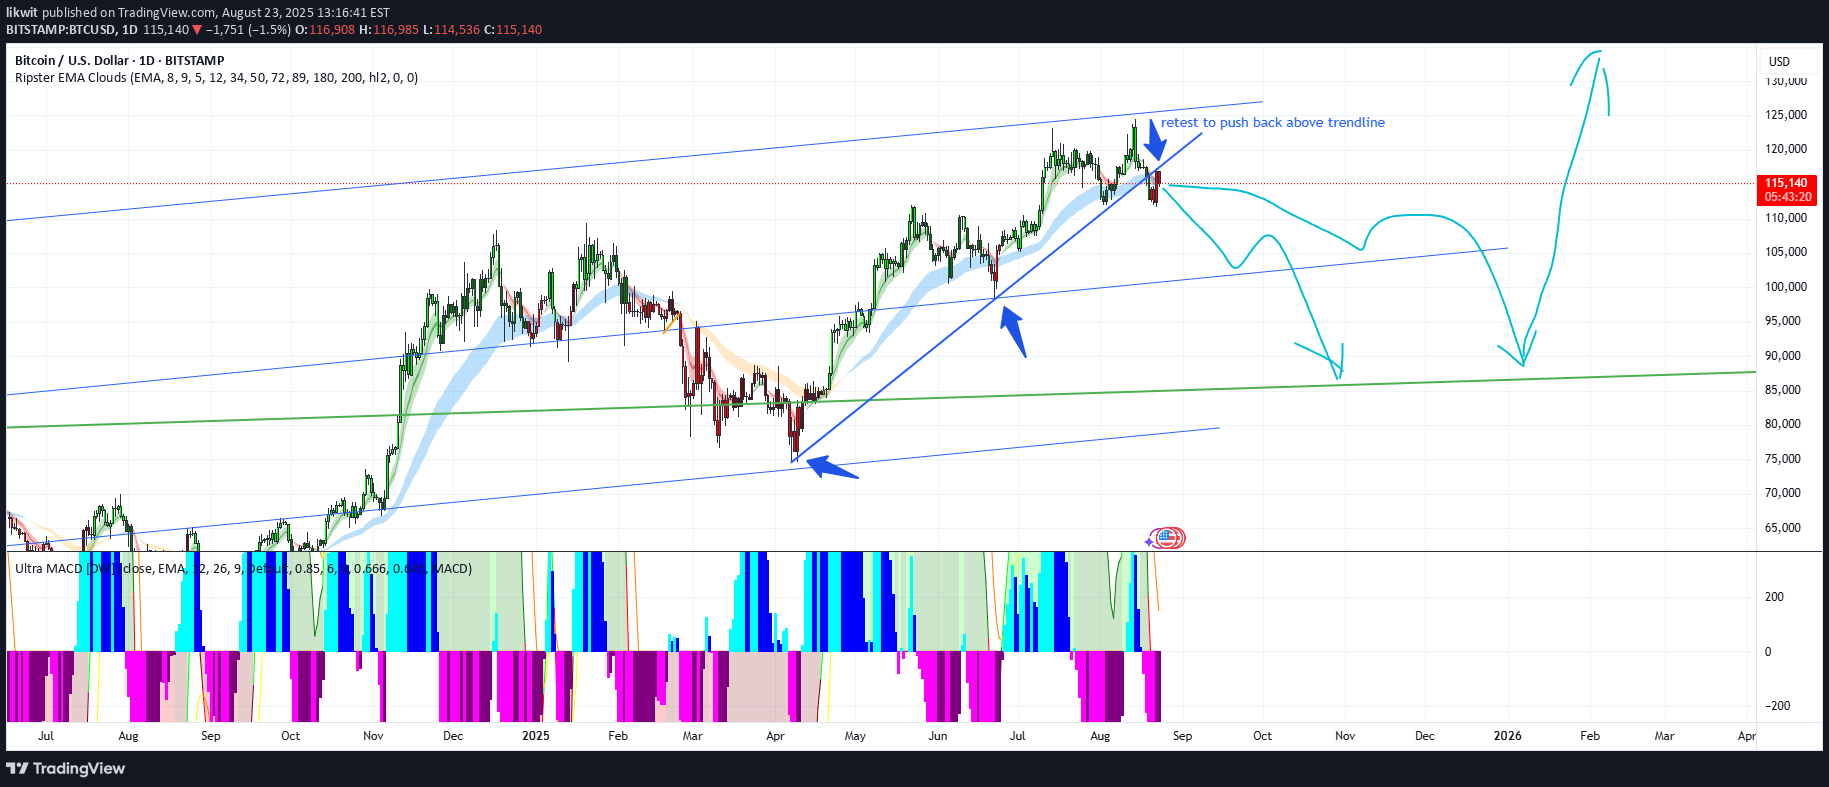
Bitcoin possibly 100k

Wait for January to close above 21615. If so take a long position in February. We might go to 100k.Little more describtion. The green line goes over the high from 2013 and 2017. You can see we broke out in feb 2021. In summer 2021 it tried to break down the green line again, but was rejected. In jan 2022 it tried to break the green line again, but we got another rejection. Finally on april 2022 it broke the green line and we went down hard. The low green line is the same trendline running from the march 2020 low. In november, december and janaury it did hold this level on the dot. Therefore I suspect this is a solid base for a long position. But first lets wait for this month to close above 21615.So it looks like we will close above the trendline. In february I suspect we test the trendline @ around 21800. From there it should go up. If not, close position and wait for it to be above the trendline again.So we touched the trendline and it rejected. We might push to the upside. This means we could head to 42k.Last week we opened above the green line, and made a test to the downside. The weekly candle however closed above the green line yesterday. This is a very bullish sign.We have lift offJust keep buying the dips along the wayWatch the 78/79k mark. We might get a pullback at that level. Might take some profit there.Bounced exactly on the trendline (green). Seems bullish if we can stay above.Worked out well. We are now at the middle blue trendline resistance. Lets see if we will break through or pull back.So it looks like we build base. We will try to push trough the upper blue trendline. That will mean we will have to go to >125k.
likwit
Bull or bear?
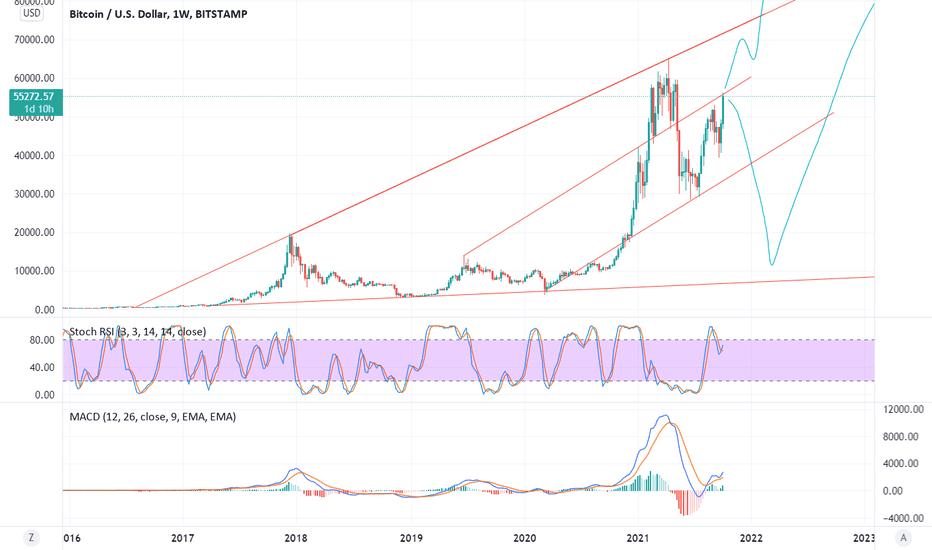
Important level. Do we break it and party hard or will we go down first? A weekly closing above the line is needed (not perse this week). Remember, the majority always have to be wrong. To wipeout all the new investors, before a major bull market, might just happen.We had a fake breakout to the upside to start this week. Today closed below the trendline. We need to close the weekly (!) candle above the trendline for a strong bullish signal. If we close weekly below the trendline it is a slightly bearish signal.We are (probably) closing this month above the middle trendline. We already tested the middle trendline this week and bounced back up. This is a bullish signal.We have closed below the trend line. Currently reaction to get back into the trend. If that fails we are looking at a minor support at 30k, solid support at 12k and major support at 8k.We broke 30k and now in no-mans-land. Solid support at 12k and major support at 8k.
Disclaimer
Any content and materials included in Sahmeto's website and official communication channels are a compilation of personal opinions and analyses and are not binding. They do not constitute any recommendation for buying, selling, entering or exiting the stock market and cryptocurrency market. Also, all news and analyses included in the website and channels are merely republished information from official and unofficial domestic and foreign sources, and it is obvious that users of the said content are responsible for following up and ensuring the authenticity and accuracy of the materials. Therefore, while disclaiming responsibility, it is declared that the responsibility for any decision-making, action, and potential profit and loss in the capital market and cryptocurrency market lies with the trader.