
HOOK
Hooked Protocol
| تریدر | نوع سیگنال | حد سود/ضرر | زمان انتشار | مشاهده پیام |
|---|---|---|---|---|
No results found. | ||||
Price Chart of Hooked Protocol
سود 3 Months :
سیگنالهای Hooked Protocol
Filter
Sort messages by
Trader Type
Time Frame

سیگنال خرید HOOK/USDT: فرصت طلایی لانگ با پاداش 1 به 5!
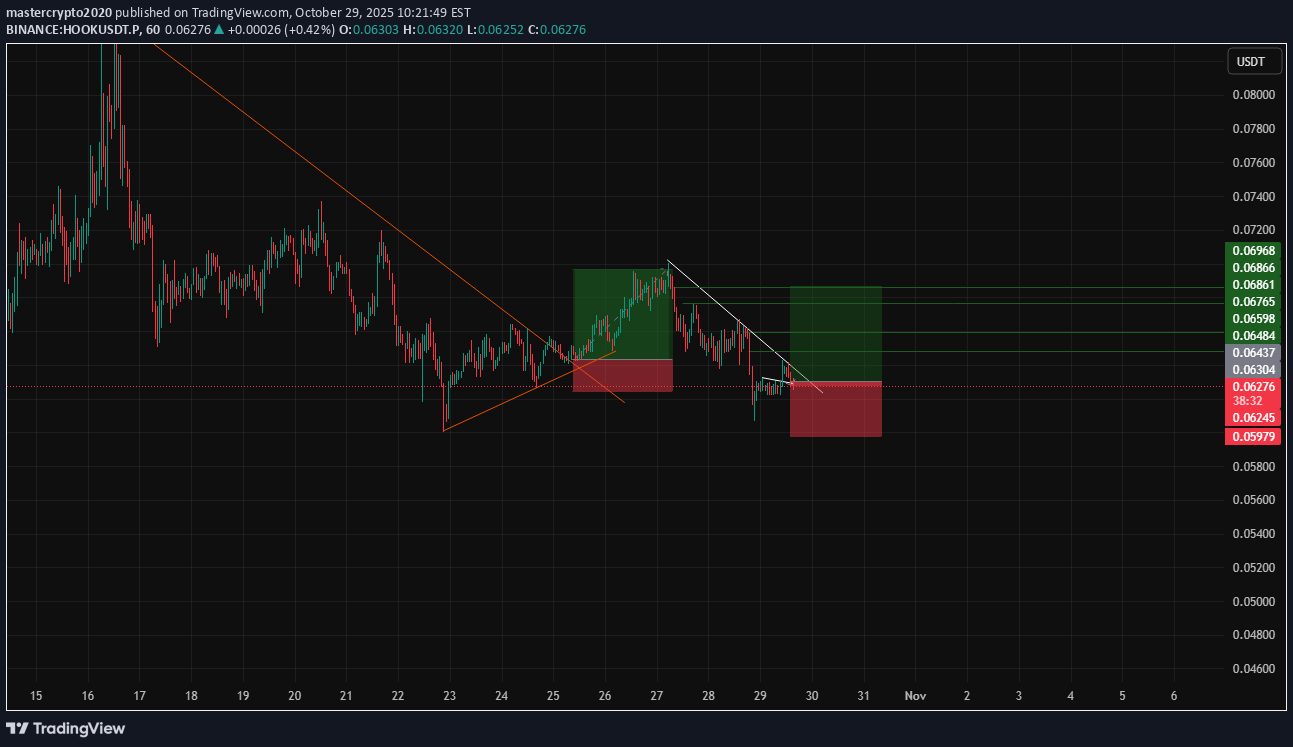
--- 📢 Signal Alert 🔹 Pair: HOOK/USDT 📈 Position: LONG 💰 Entry Zone: 0.06250 – 0.06400 🎯 Targets (Take Profit): ▫️ TP1: 0.06484 ▫️ TP2: 0.06595 ▫️ TP3: 0.06760 🛑 Stop Loss: 0.05979 📊 Timeframe: — ⚖️ Risk/Reward Ratio: 1:5 📌 Suggested Leverage: 5x --- 📖 Analysis / Reason for Entry: Support Zone Reaction: Price has bounced from a strong demand area near 0.06250, showing multiple rejections on lower timeframes. Momentum Confirmation: RSI is recovering from oversold territory, signaling potential bullish reversal. Volume Behavior: Increasing buy-side volume confirms buyers’ activity around the entry zone. Structure: Formation of a double-bottom pattern around 0.0620–0.0630, which often precedes bullish continuation. ⚠️ Note: Wait for confirmation candles before entering. Always apply proper risk management.

Strateg_
فرصت بعدی بعد از PIVX: رمز ارز HOOK آماده انفجار قیمتی!

As I have already written, you should not try to jump on the departed train on pivx, which I recommended for purchase for more than a month, it is better to consider the options where the X's are just being prepared. First of all, they include CHESS HOOK BMT MITO VIC. Consider the position of the HOOK. After listing on binance, the token left several strong technical signals for a retest up to 0-50-75, which is highly likely to lead to a major growth wave. The growth momentum last week was only the first investment in the upcoming trend. An uptrend line has been formed and there is a high probability of an attempt to consolidate above it before the end of this month. The quarter opened in a mixed zone, an opening above 0.09 gives a signal for growth up to 0.15, however, an opening below 0.1 is likely to give pullbacks in the event of a sharp increase. The main long-term support for the current issue is the 0.0750-850 range, from which there was a rebound after a long-term rebidding. A hike below this range is likely only with an additional significant drawdown of ETH. The most likely target is an attempt to close the current monthly candle above 0.21-21 in order to continue the trend in the new month. With negative overall market dynamics, there is a possibility of a pullback from 0.21-25. In this case, in the new month, we can expect a new attempt to return to the trend line from 0.110-125, which will provide an additional opportunity for scalping.

CryptoAnalystSignal
پیشبینی انفجار صعودی هوک (HOOK/USDT): شکست قاطع از الگوی گوه نزولی!

#HOOK The price is moving within a descending channel on the 1-hour frame, adhering well to it, and is heading for a strong breakout and retest. We have a bearish trend on the RSI indicator that is about to be broken and retested, which supports the upward breakout. There is a major support area in green at 0.0960, representing a strong support point. We are heading for consolidation above the 100 moving average. Entry price: 0.0994 First target: 0.1052 Second target: 0.1095 Third target: 0.1158 Don't forget a simple matter: capital management. When you reach the first target, save some money and then change your stop-loss order to an entry order. For inquiries, please leave a comment. Thank you.
CryptoAnalystSignal
#HOOK/USDT

#HOOK The price is moving within a descending channel on the 1-hour frame, adhering well to it, and is heading for a strong breakout and retest. We have a bearish trend on the RSI indicator that is about to be broken and retested, which supports the upward breakout. There is a major support area in green at 0.0953, representing a strong support point. We are heading for stability above the 100 moving average. Entry price: 0.1070 First target: 0.1135 Second target: 0.1200 Third target: 0.1300 Don't forget a simple matter: capital management. When you reach the first target, save some money and then change your stop-loss order to an entry order. For inquiries, please leave a comment. Thank you.

Bithereum_io
HOOKUSDT 1D
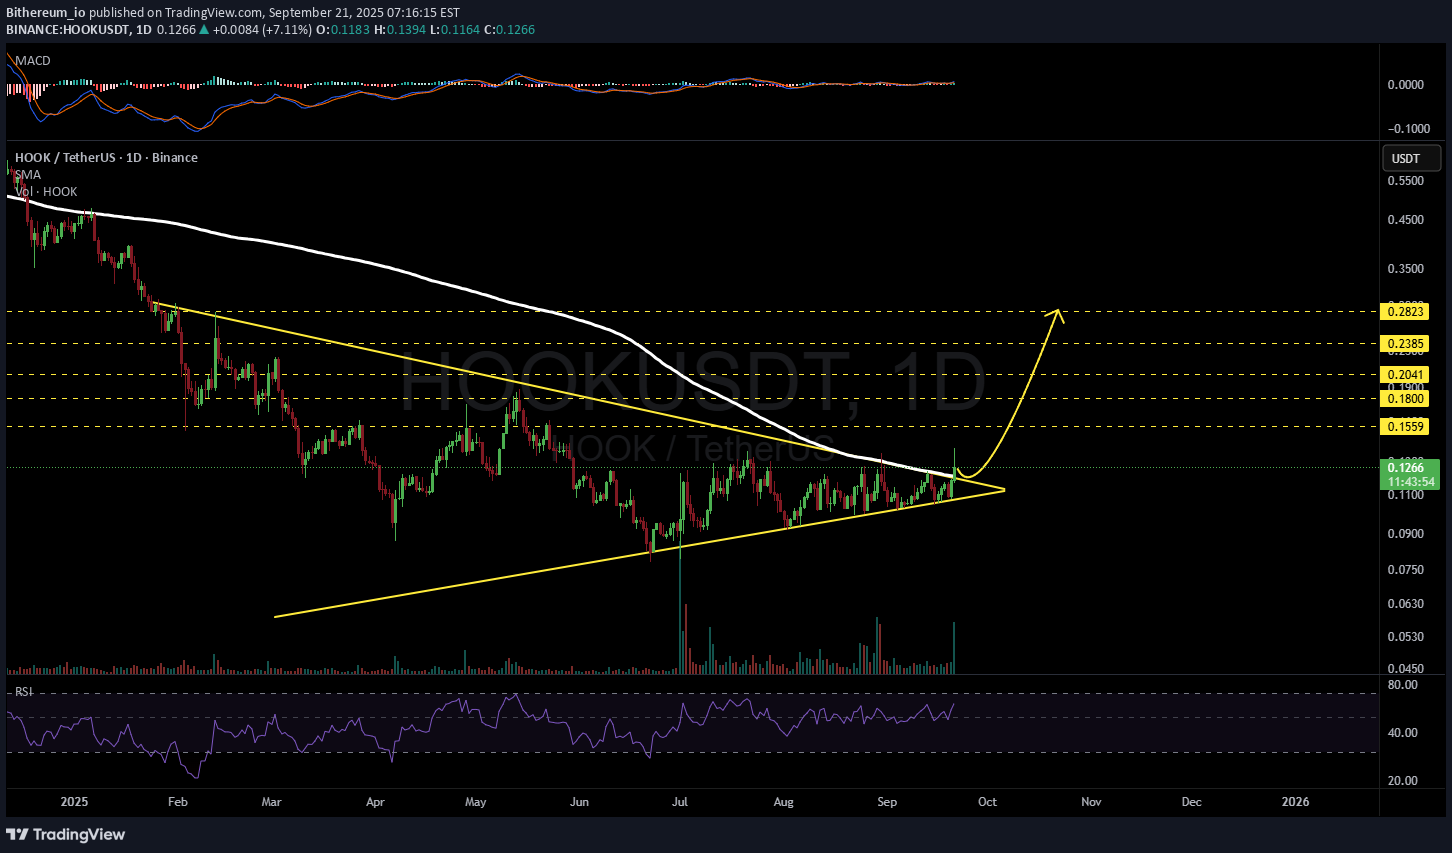
#HOOK has broken above the symmetrical triangle and the SMA200 on the daily chart. In case of a successful retest, the potential targets are: 🎯 $0.1559 🎯 $0.1800 🎯 $0.2041 🎯 $0.2385 🎯 $0.2823 ⚠️ Always remember to use a tight stop-loss and follow proper risk management.

CryptoWithJames
HOOKUSDT UPDATE
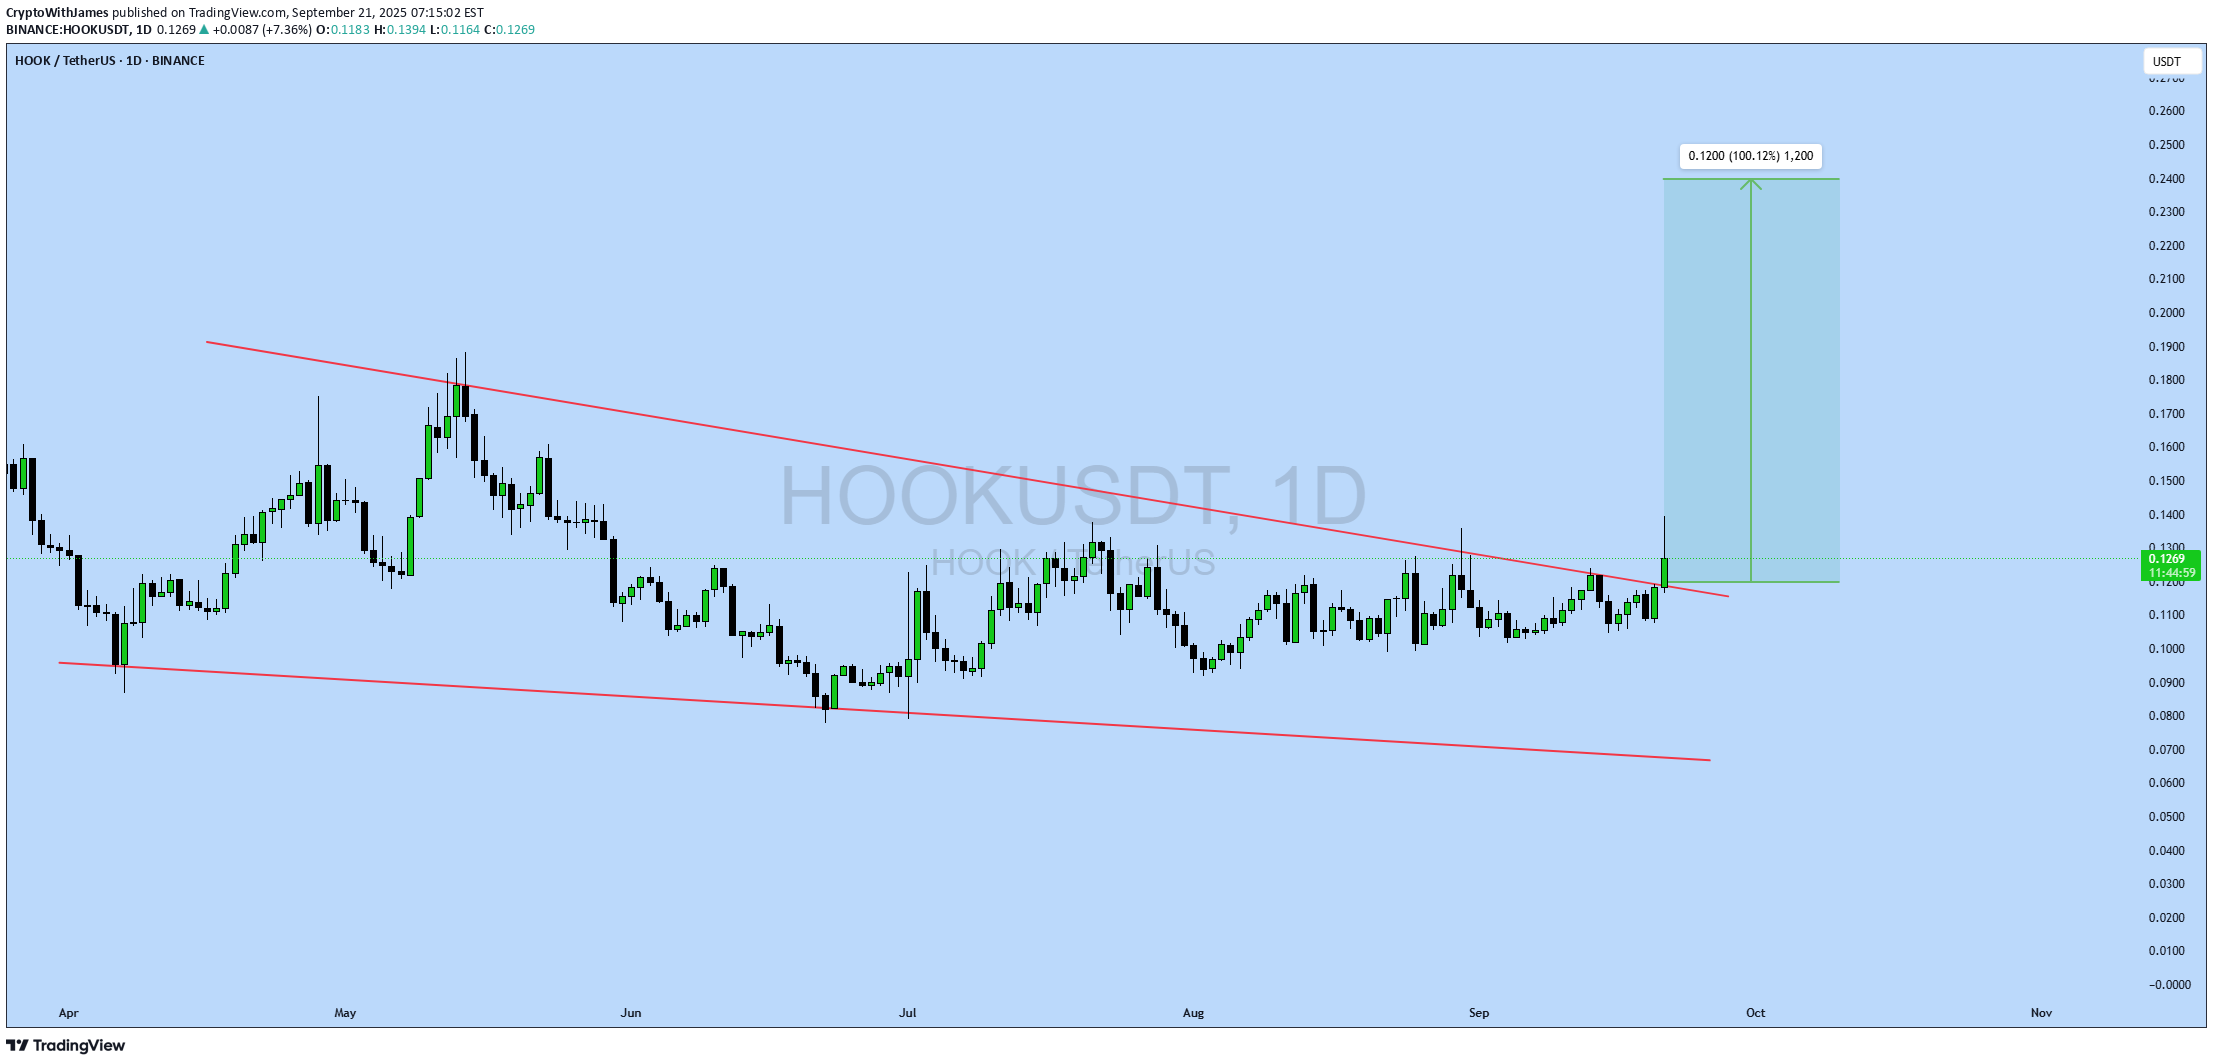
#HOOK UPDATE HOOK Technical Setup Pattern: Bullish Falling Wedge Pattern Current Price: $0.63 Target Price: $1.26 Target % Gain: 100.22% HOOK is breaking out of a falling wedge pattern on the 1D timeframe. Current price is $0.63 with a target near $1.26, showing about 100% potential upside. The breakout confirms bullish momentum with structure favoring continuation. Always use proper risk management. Time Frame: 1D Risk Management Tip: Always use proper risk management.

Alpha-GoldFX
HOOKUSDT Forming Bullish Pennant
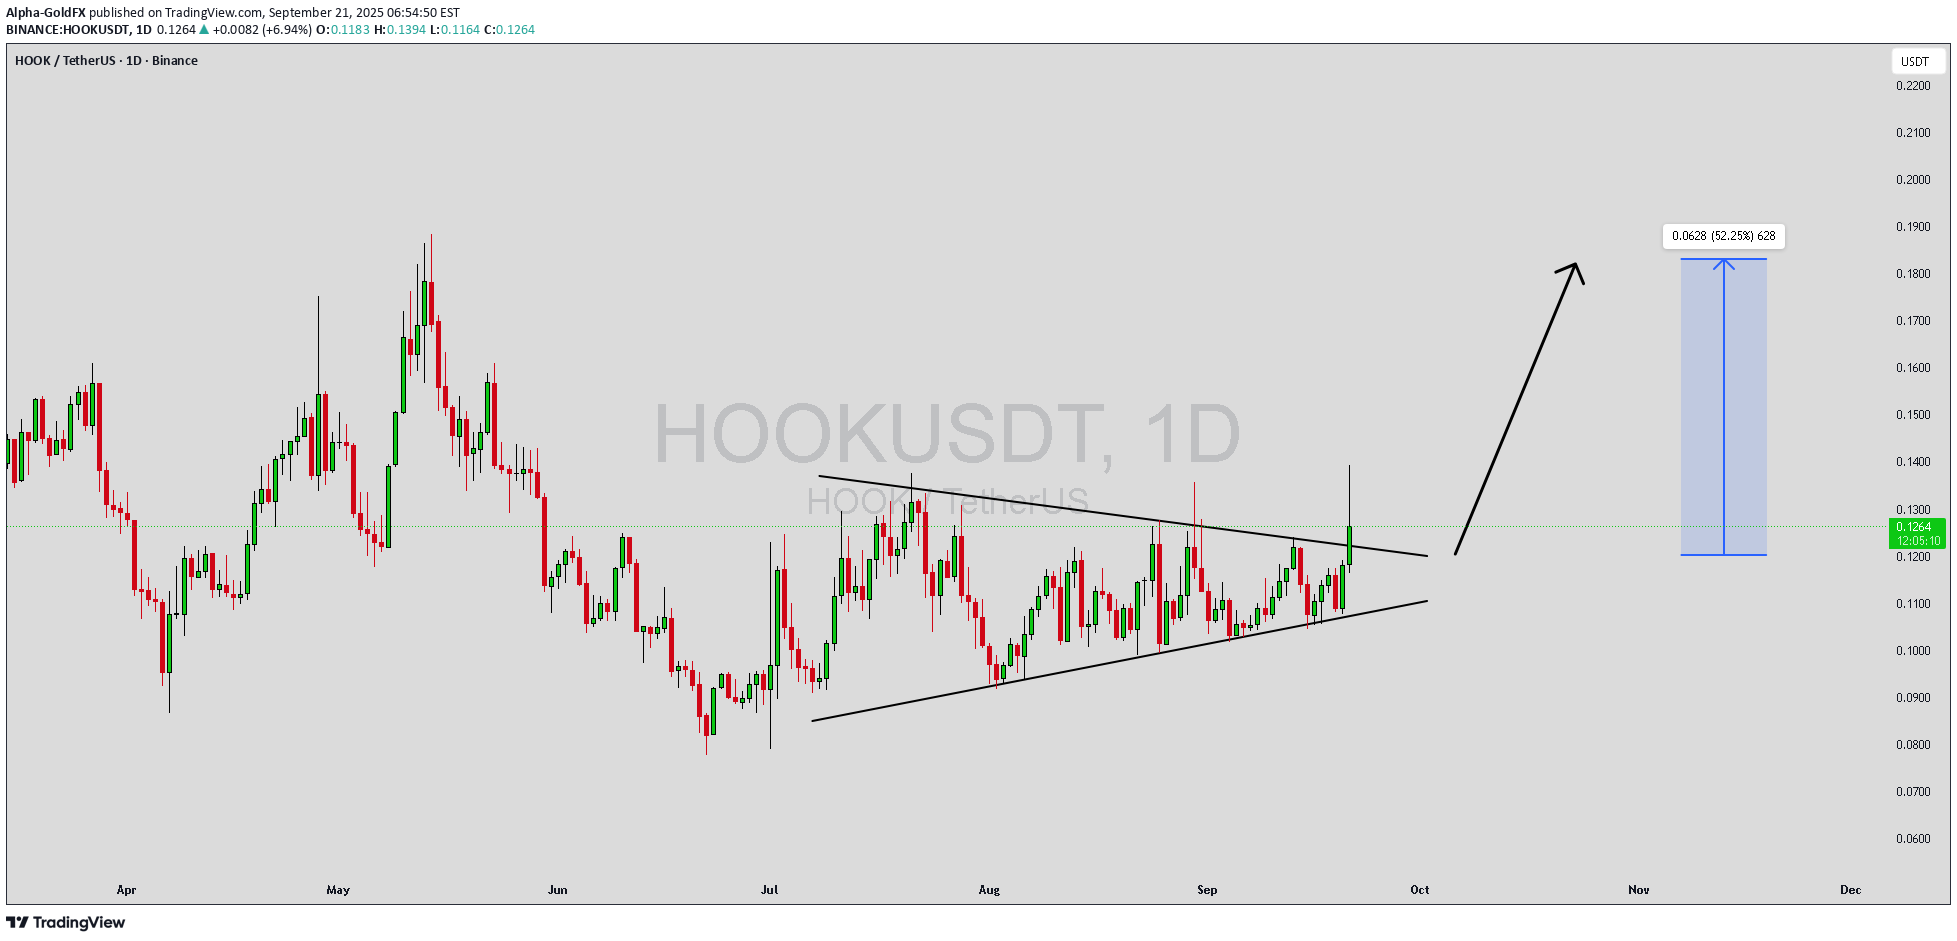
HOOKUSDT is currently forming a bullish pennant pattern on the charts, which is often a continuation signal following a strong upward move. After a period of consolidation within narrowing trendlines, the price action suggests that buyers are preparing for another breakout. This setup aligns with increasing interest from investors who are looking for high-potential coins in the current market environment. The trading volume has remained healthy, confirming that accumulation is taking place as the pennant structure develops. A breakout from this pattern could trigger a strong rally, with the expected gain ranging from 90% to 100%+. Such moves are typically fueled by both technical strength and renewed investor participation, making this setup very attractive for short- to mid-term traders. Investor sentiment around HOOKUSDT has also been improving as this project gains more traction in the market. The combination of a strong technical setup, good volume support, and growing investor interest points toward a potential surge in price once resistance levels are breached. Traders keeping an eye on this coin may find it one of the more exciting opportunities on the charts right now. ✅ Show your support by hitting the like button and ✅ Leaving a comment below! (What is You opinion about this Coin) Your feedback and engagement keep me inspired to share more insightful market analysis with you!

MeTraderTr
#HOOK Üçgen Daralmış, OBO olmuş Kurnaz MM ;)
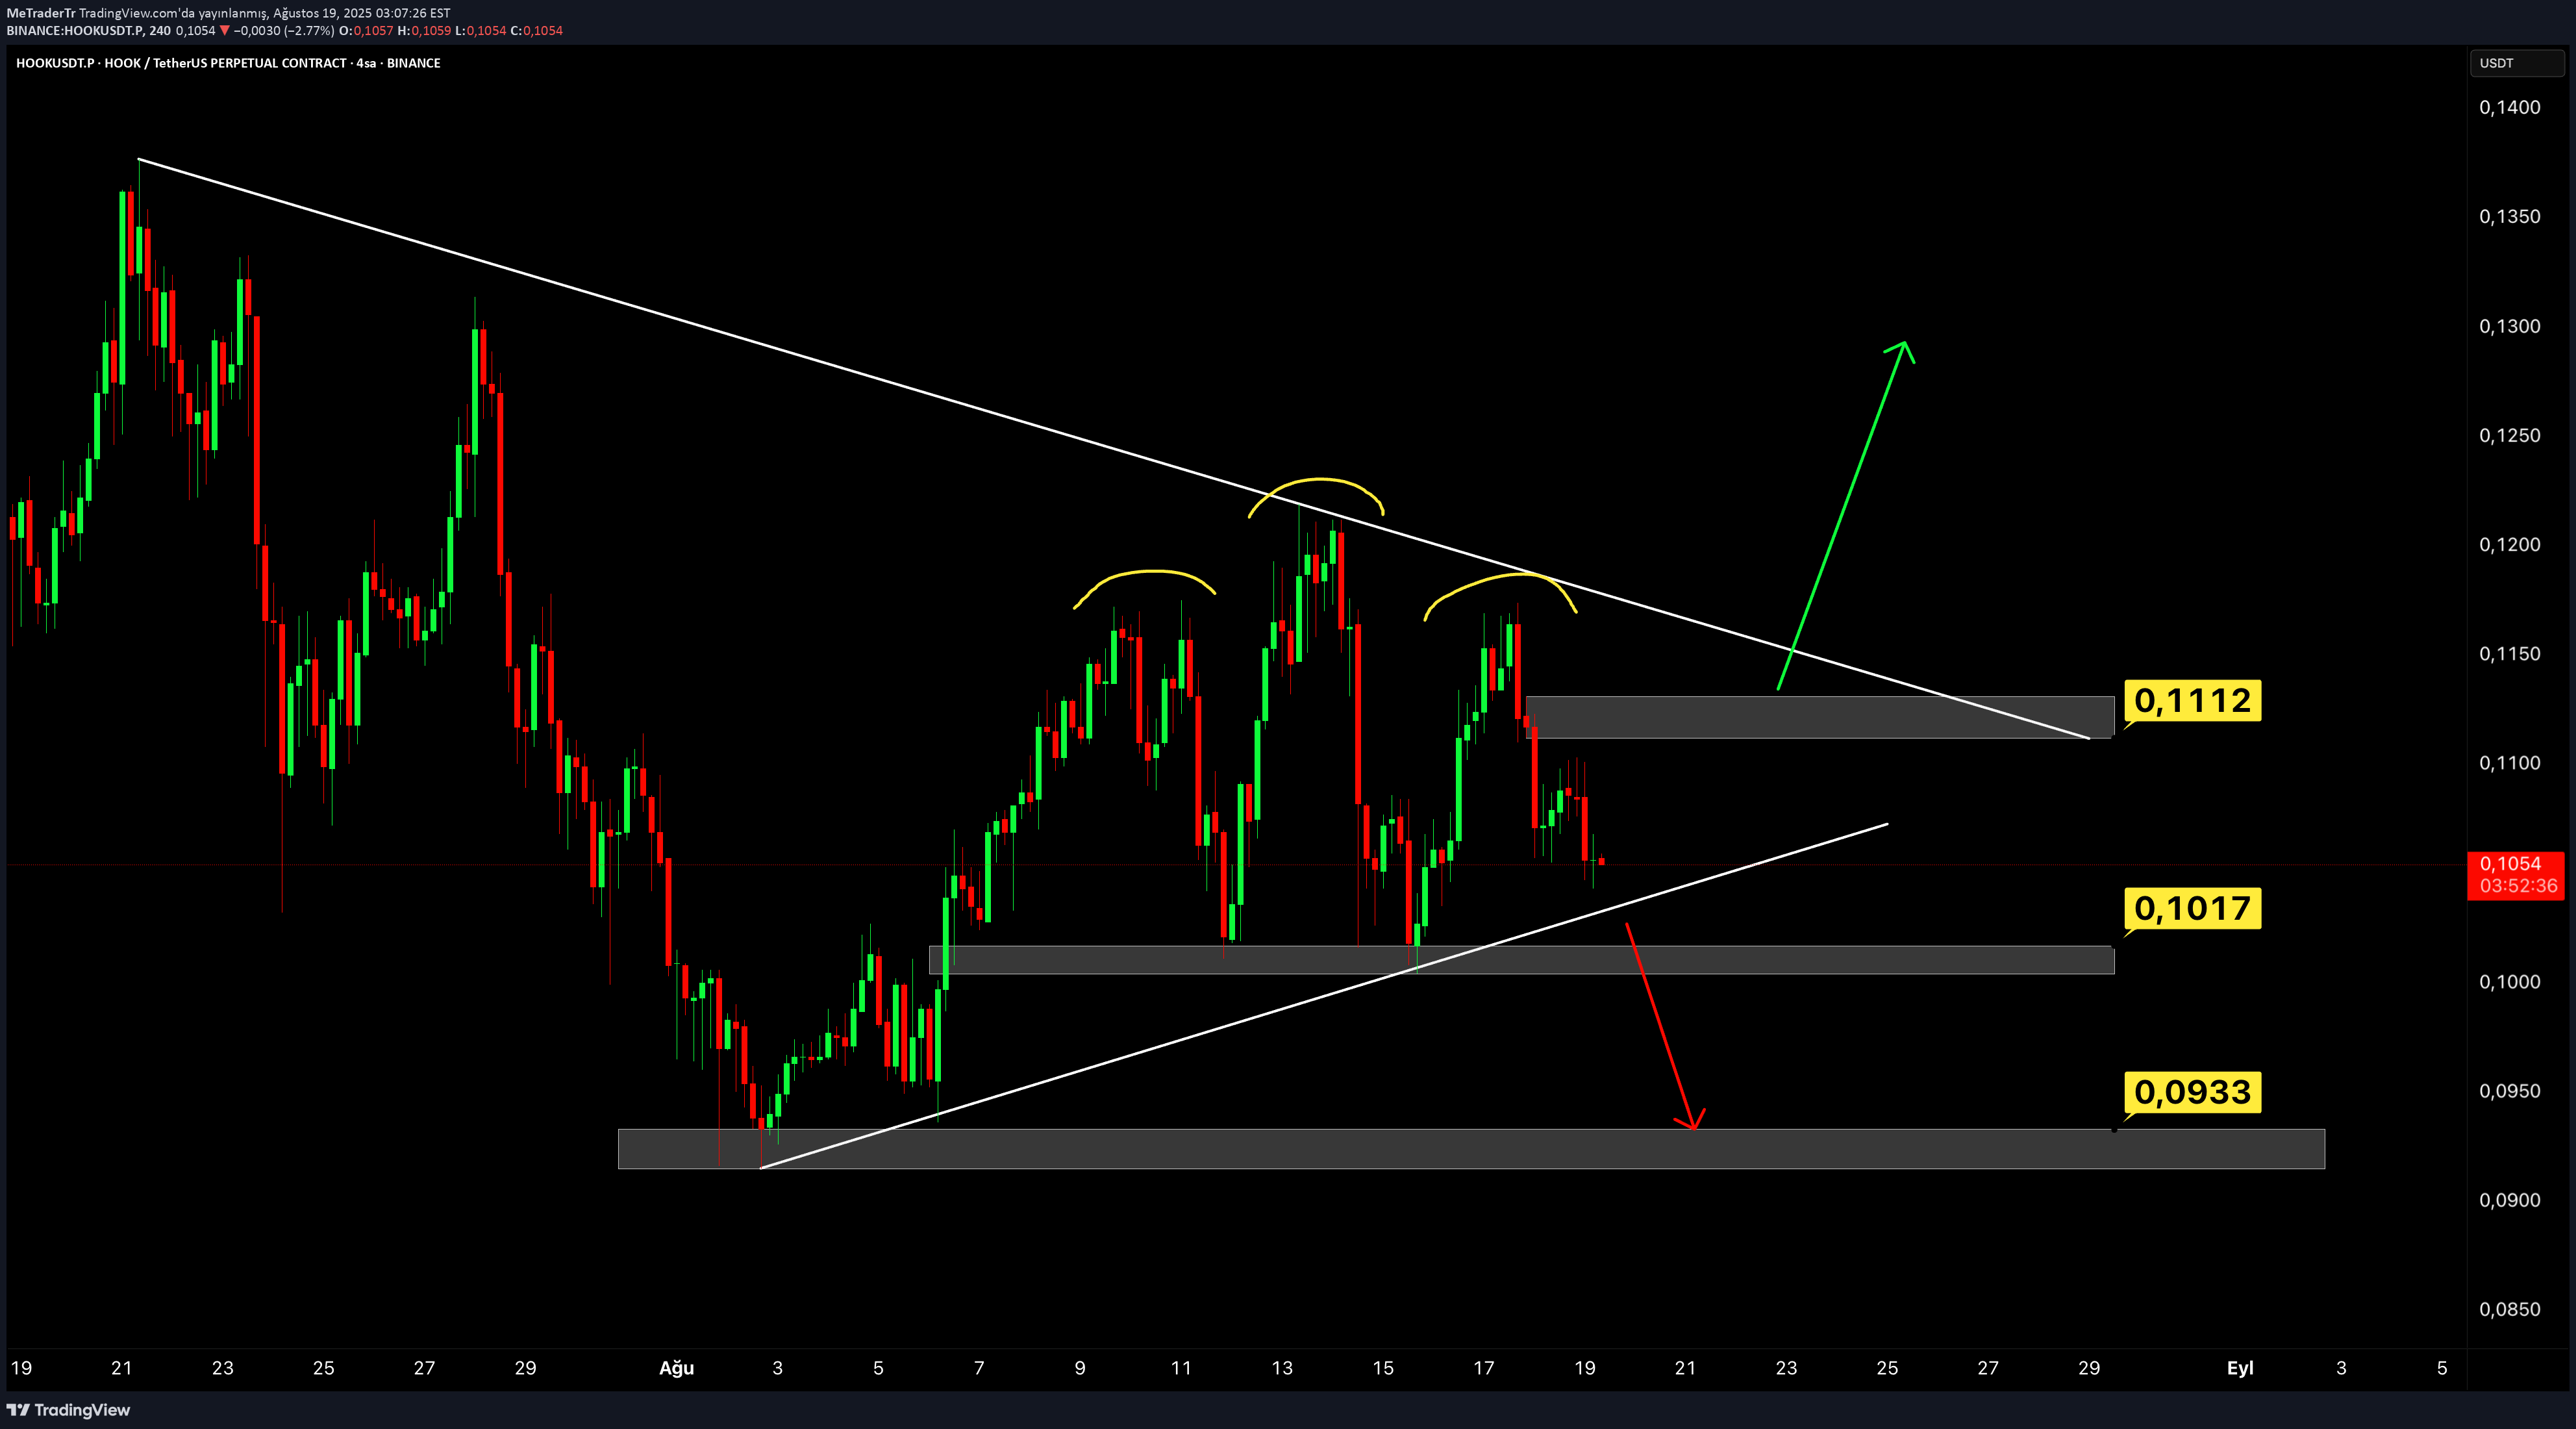
Hook The shrinking triangle has been Obo in the triangle and this will rise to us contrary to the fall ... Cunning MM knows the job !!!
Alpha-GoldFX
HOOKUSDT Forming Bullish Reversal

HOOKUSDT is currently showcasing a classic bullish reversal pattern, backed by solid technical structure and increasing investor attention. The price has formed a falling wedge, a well-known bullish setup characterized by converging downward-sloping trendlines, suggesting that bearish momentum is waning. This setup typically precedes sharp breakouts and trend reversals. Recent breakout behavior and volume dynamics further strengthen the case for a strong upward move. Volume has remained strong throughout this consolidation phase, indicating accumulation and heightened market interest. This is a key confirmation, as volume backing enhances the reliability of the pattern. A breakout from the wedge supported by rising volume aligns well with typical behavior seen in successful bullish reversals. The technical outlook is reinforced by broader on-chain fundamentals. Hooked Protocol (HOOK) is a gamified, social-learning Web3 platform aimed at boosting mass blockchain adoption through quiz apps, quiz-to-earn mechanics, and onboarding infrastructure. It has demonstrated real traction, attracting millions of users across multiple products early on. According to TradingView analyst assessments, HOOKUSDT is positioned for potential gains of 90% to 100%+, reflecting a highly favorable risk-to-reward setup for swing and mid-term investors. Momentum traders are especially watching for a confirmed breakout and volume surge. This makes HOOKUSDT an intriguing altcoin breakout setup that merits close attention over the next few sessions. ✅ Show your support by hitting the like button and ✅ Leaving a comment below! (What is your opinion about this Coin) Your feedback and engagement keep me inspired to share more insightful market analysis with you!

coin_mastermind
HOOK – Holding the Line at Key Support

📆 On the Daily timeframe, $NASDAQ:HOOK has re-tested its trendline support and is currently holding firm 🛡️. 📊 On the 3D timeframe, the wedge structure remains intact — suggesting a potential bounce if bulls step in 🔄. This is a critical level for structure integrity. 👀 Keep your eyes on this zone for the next big move! Not financial advice.
Disclaimer
Any content and materials included in Sahmeto's website and official communication channels are a compilation of personal opinions and analyses and are not binding. They do not constitute any recommendation for buying, selling, entering or exiting the stock market and cryptocurrency market. Also, all news and analyses included in the website and channels are merely republished information from official and unofficial domestic and foreign sources, and it is obvious that users of the said content are responsible for following up and ensuring the authenticity and accuracy of the materials. Therefore, while disclaiming responsibility, it is declared that the responsibility for any decision-making, action, and potential profit and loss in the capital market and cryptocurrency market lies with the trader.