
HNT
Helium
| تریدر | نوع سیگنال | حد سود/ضرر | زمان انتشار | مشاهده پیام |
|---|---|---|---|---|
No results found. | ||||
Price Chart of Helium
سود 3 Months :
سیگنالهای Helium
Filter
Sort messages by
Trader Type
Time Frame

rasooldavarpanah
HNT/USDT: منطقه طلایی خرید کجاست؟ سیگنال صعودی با شکست ۲.۴ دلار!
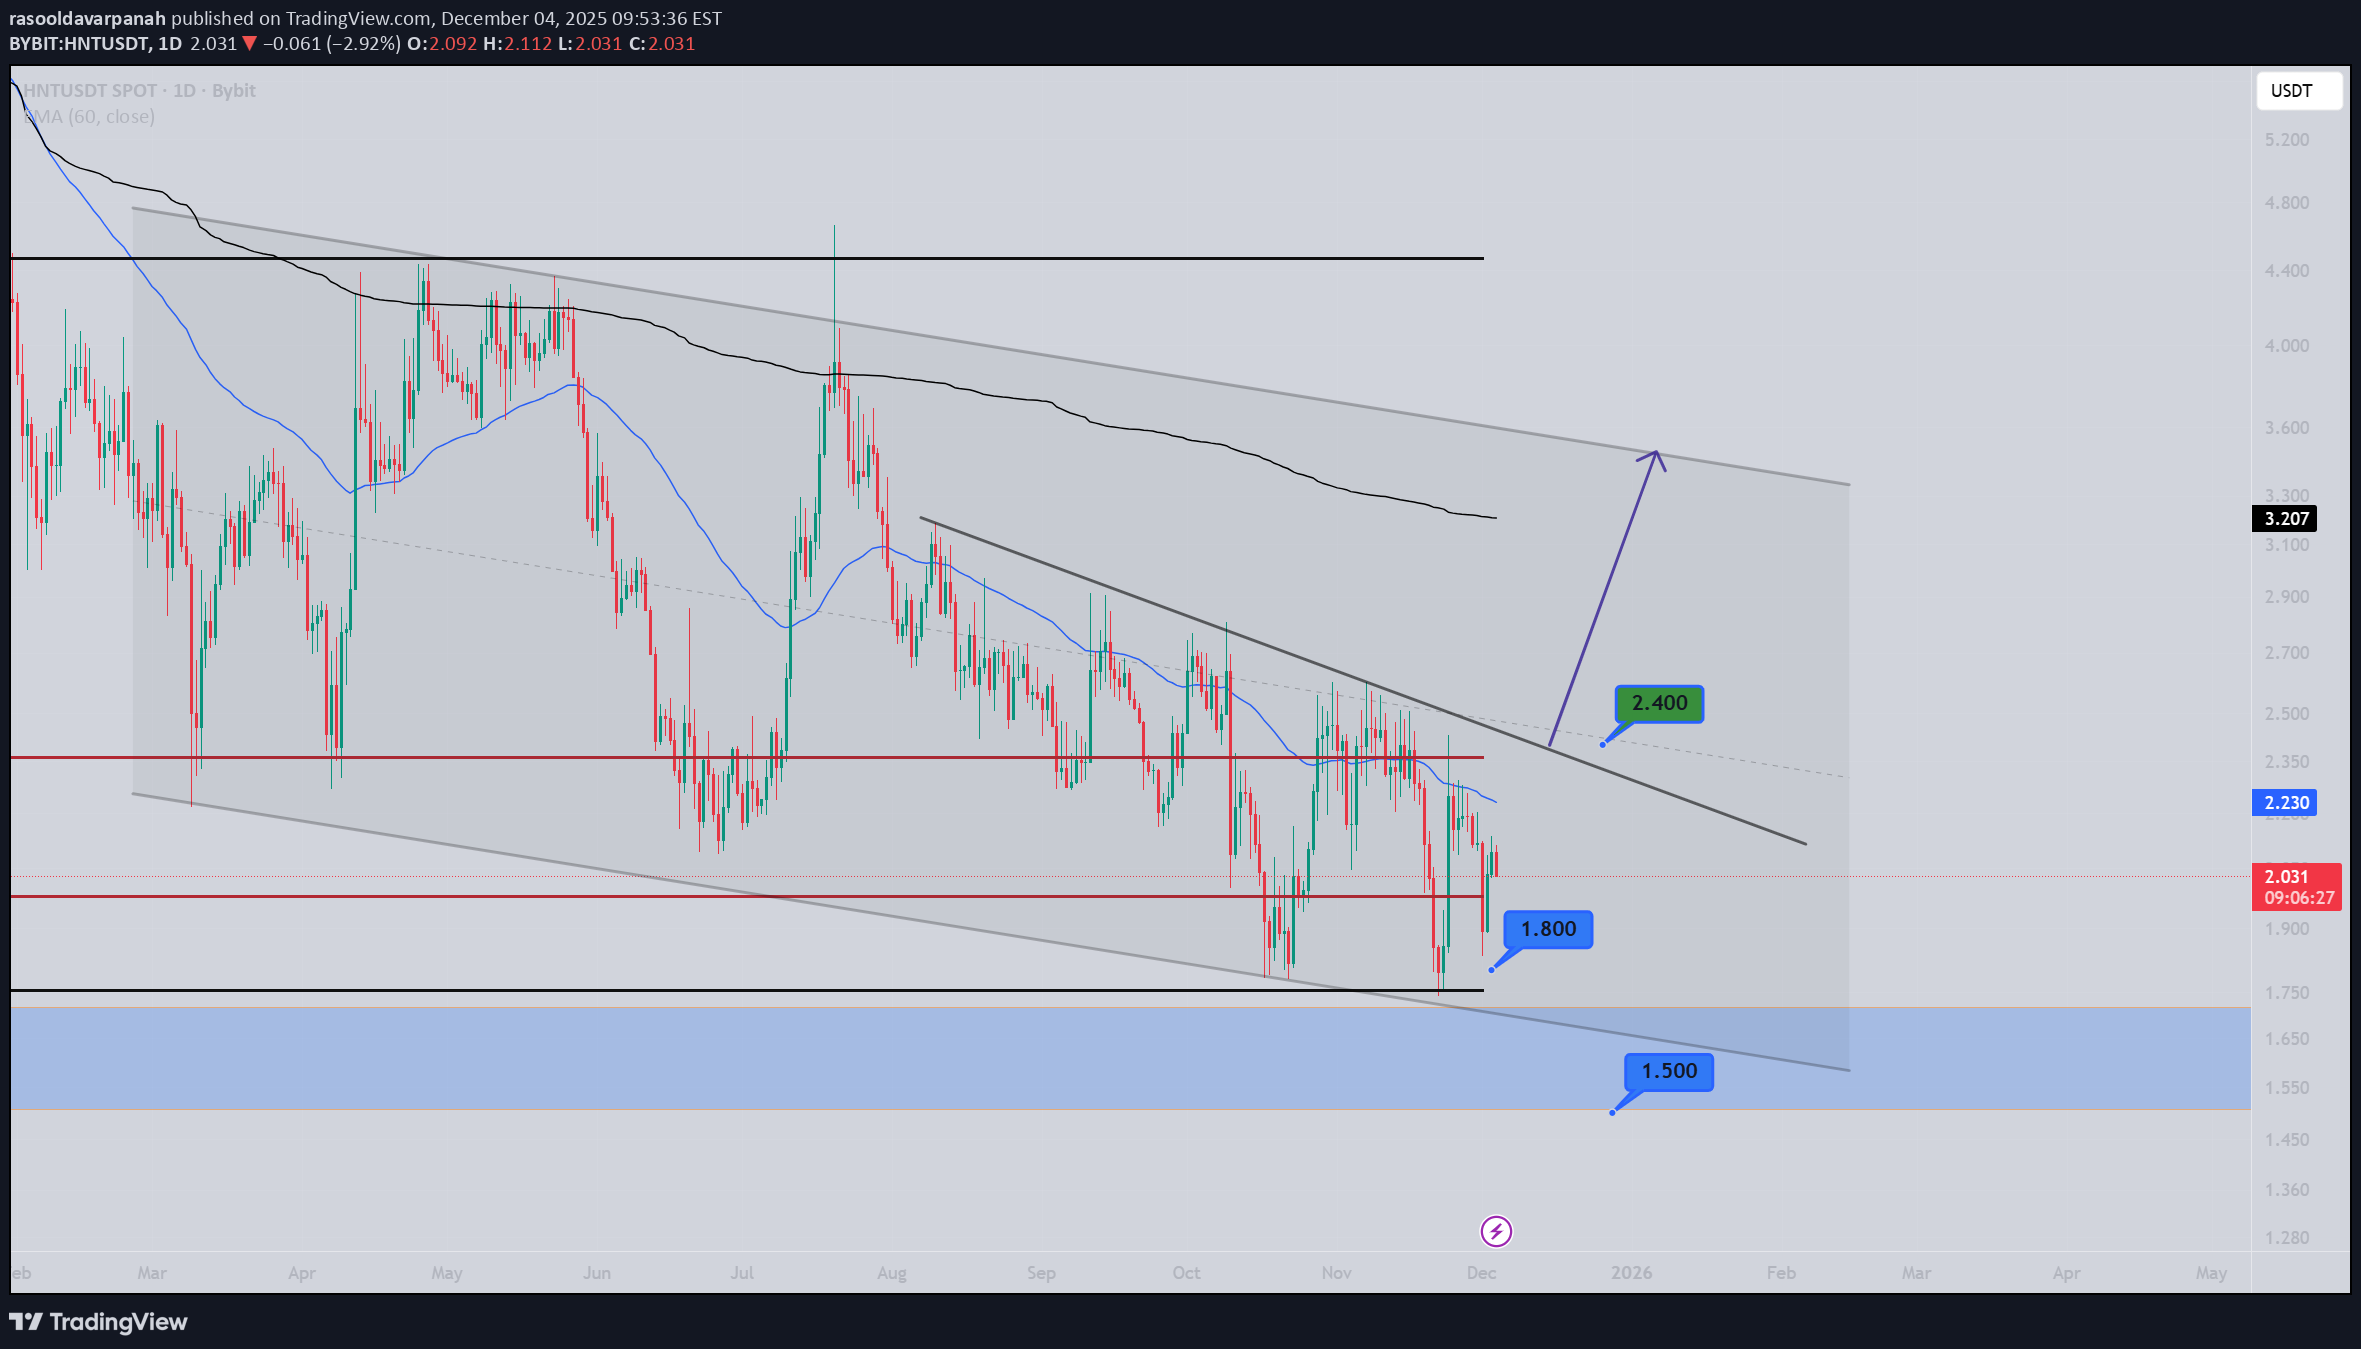
In my view, it’s completing its accumulation base, and I’m waiting for a higher low and a higher high. The $1.5–$1.8 zone is a valuable area for accumulation. Bullish leg confirmation comes with a sustained hold above $2.4.

Bithereum_io
تحلیل تکنیکال HNT/USDT: فرصت خرید در کف الگوی گُوِه نزولی! (اهداف سقف جدید)
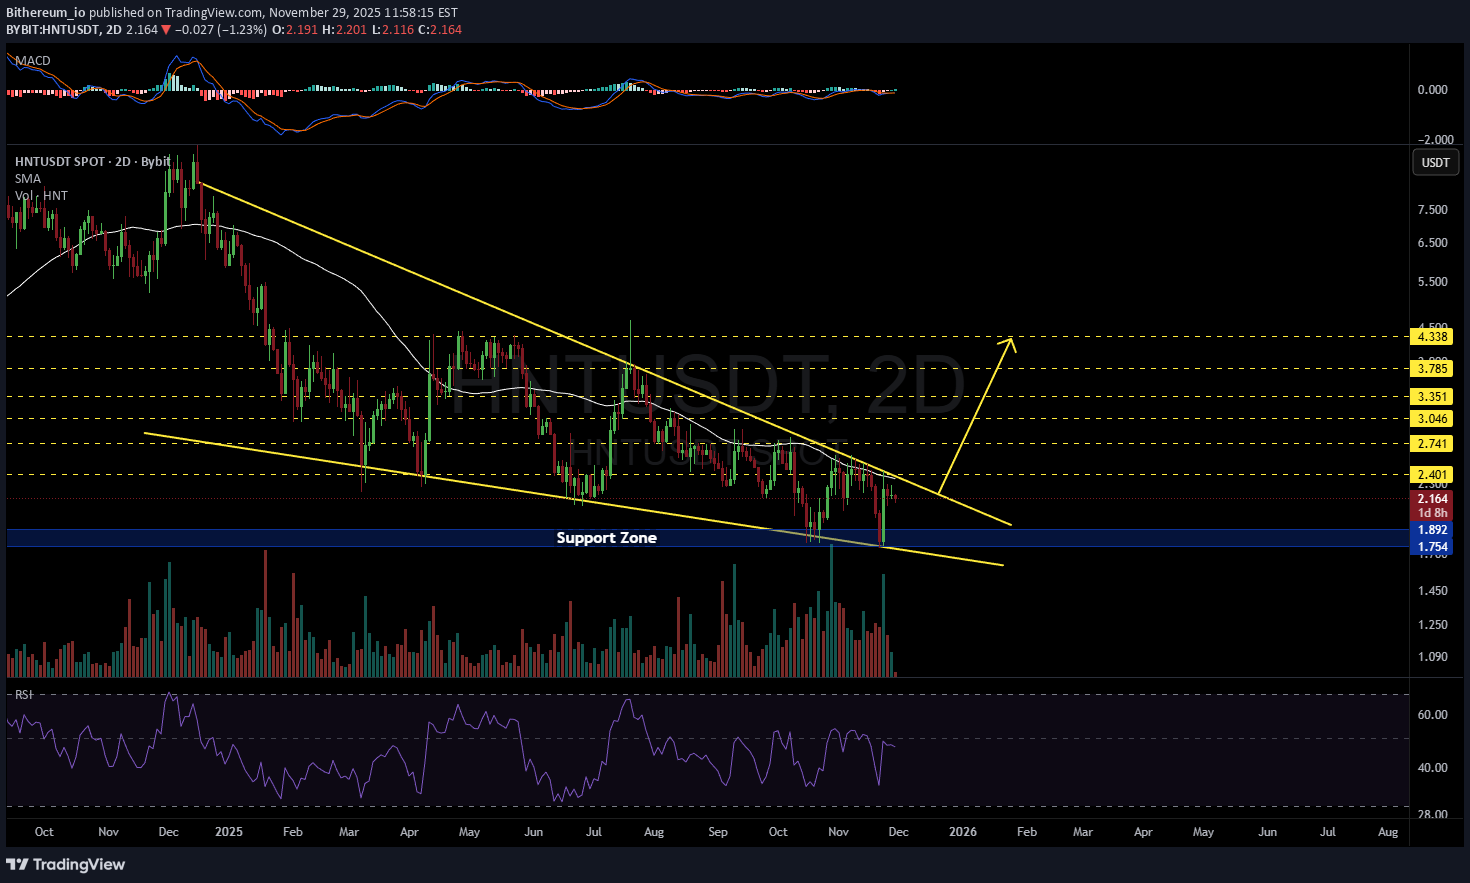
#HNT is moving inside a falling wedge pattern on the 2-day timeframe. Consider buying a small bag here and on the support zone between $1.892 ~ $1.754. If price breaks above the wedge resistance and the 2-day SMA50, the potential targets are: 🎯 $2.401 🎯 $2.741 🎯 $3.046 🎯 $3.351 🎯 $3.785 🎯 $4.338 ❌ Invalidation: a 2-day candle closing below the wedge support. ⚠️ Always remember to use a tight stop-loss and maintain proper risk management.
Bithereum_io
تحلیل تکنیکال HNT: فرصت خرید در کف کانال نزولی و اهداف صعودی بزرگ!
#HNT is moving inside a falling wedge pattern on the 2-day timeframe. Consider buying a small bag here and on the support zone between $1.892 ~ $1.754. If price breaks above the wedge resistance and the 2-day SMA50, the potential targets are: 🎯 $2.401 🎯 $2.741 🎯 $3.046 🎯 $3.351 🎯 $3.785 🎯 $4.338 ❌ Invalidation: a 2-day candle closing below the wedge support. ⚠️ Always remember to use a tight stop-loss and maintain proper risk management.

Mike-BTD
آیا هلــیوم به کف قیمتی میرسد؟ نشانههای خستگی خرسها و فرصت خرید پنهان
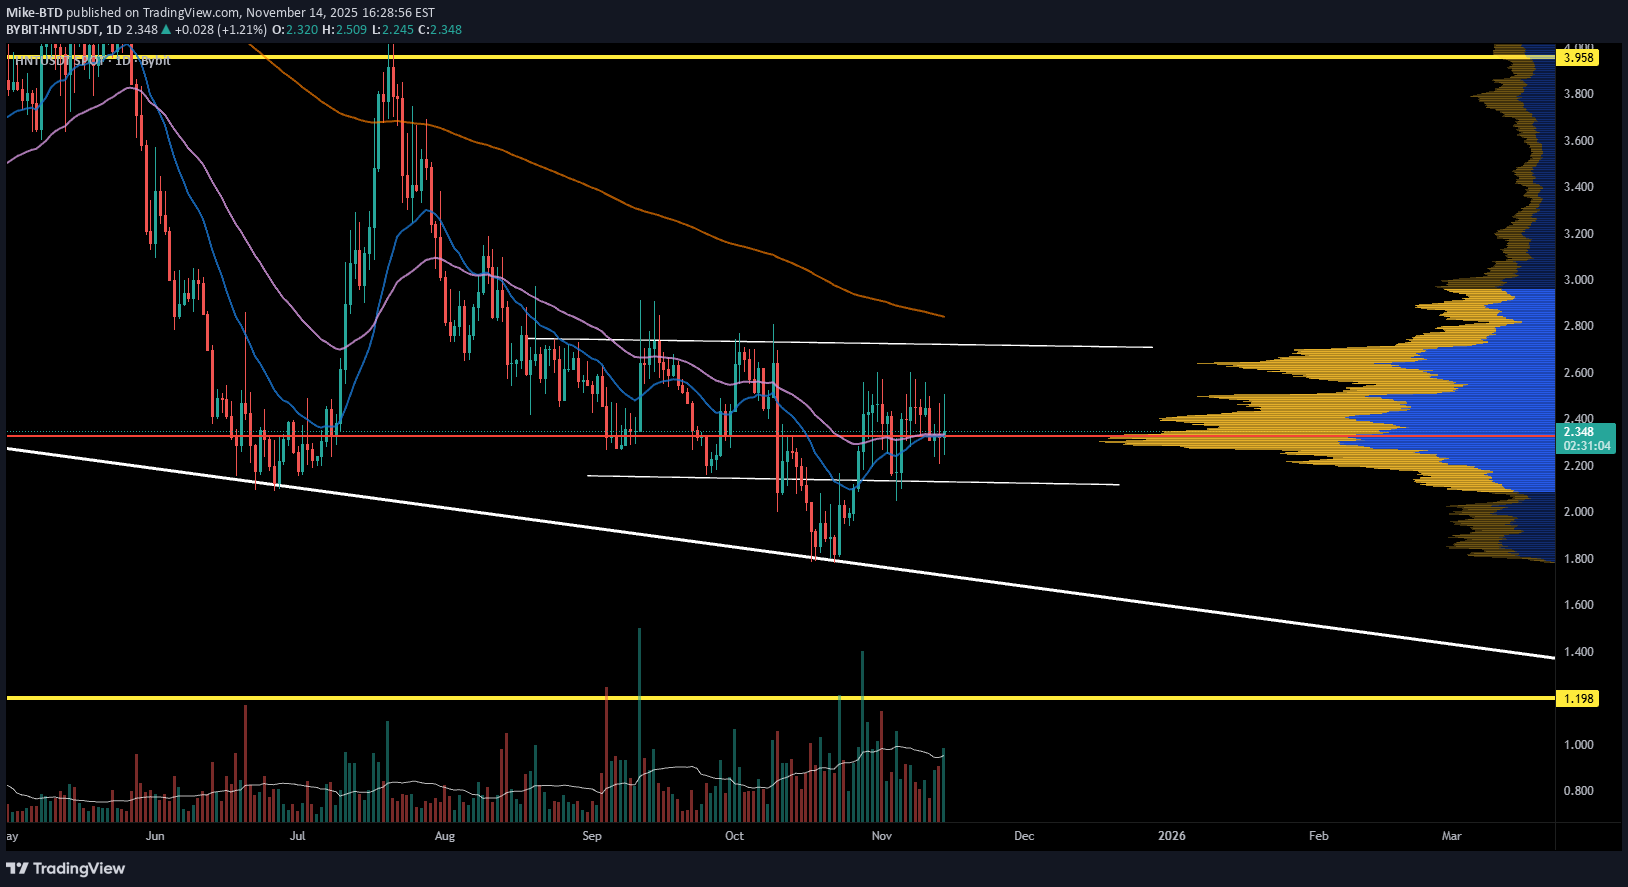
HNT is showing early signs of bearish exhaustion, with a swing failure and clear bullish divergence appearing at a major horizontal support zone. This area has historically acted as an accumulation region, making it a point of interest — but the mid-term trend is still down, so risk management remains essential. Volume is still weak, meaning buyers haven’t stepped in with conviction yet. A shift in market structure would be the confirmation needed for a broader reversal.

MyCryptoParadise
آینده ارز HNT: انفجار بزرگ یا سقوط نهایی؟ (سطح حیاتی امروز!)
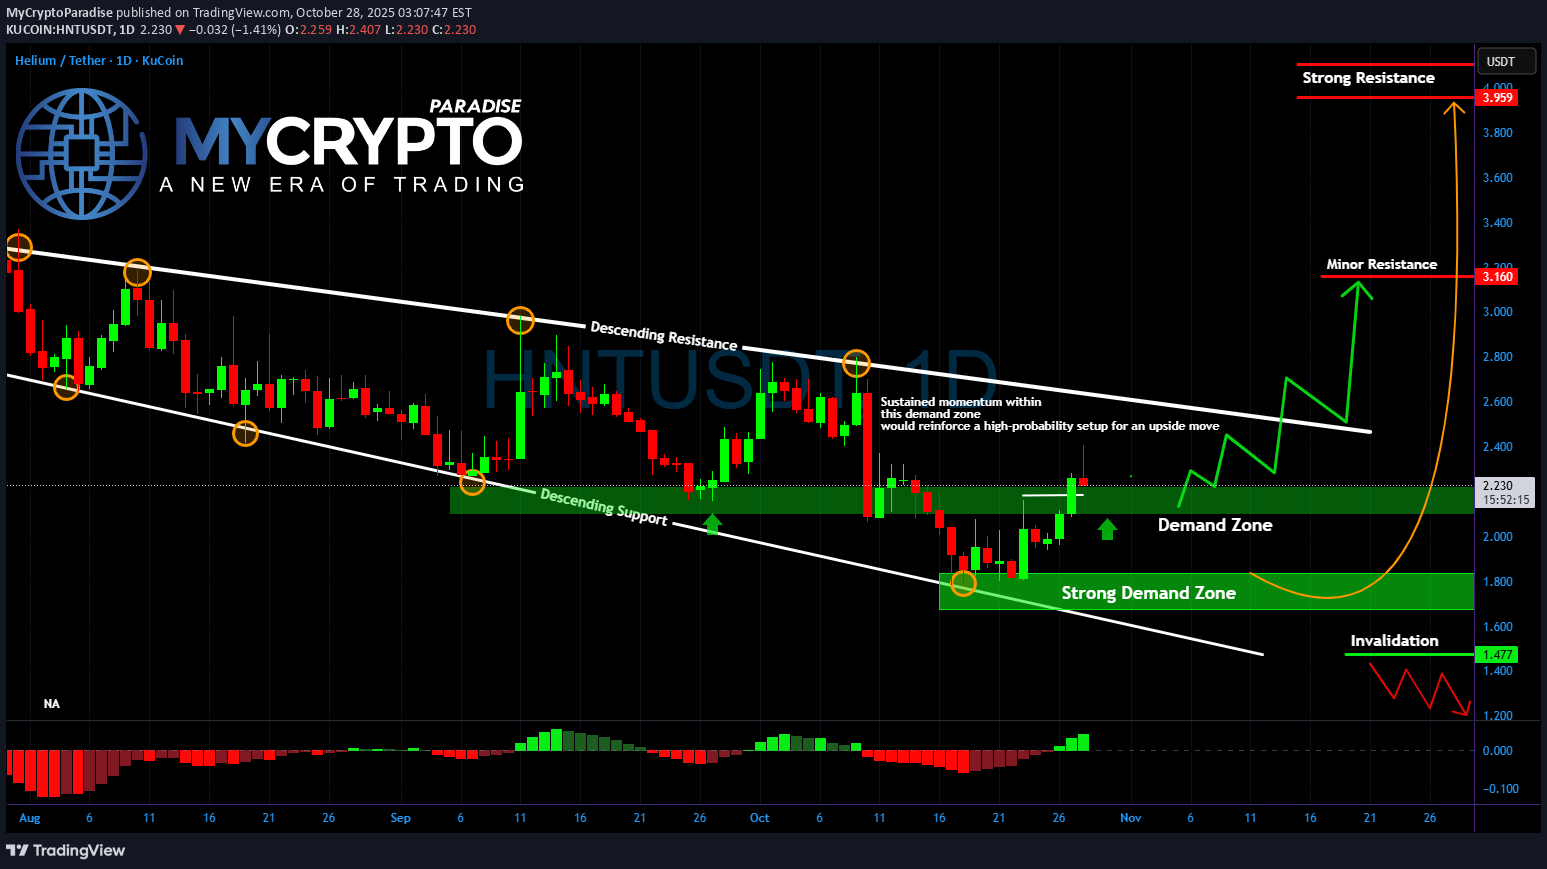
Yello Paradisers, are you paying attention? Because #HNTUSDT is now at a critical make-or-break level and the next few candles could decide everything. 💎After weeks of downward drift inside a clean descending channel, #HNT has just shown its first real signs of strength. The bounce from the strong demand zone between $1.70 and $1.90 is not random it’s a key zone we’ve been watching since early October. The structure has now shifted from passive to active accumulation, and the market is hinting at a potential breakout. 💎We’re currently trading above $2.25, right inside a mid-range demand zone. If price holds this area and manages to build momentum above $2.40, the door opens for an explosive move towards the minor resistance at $3.15. A successful breakout from this descending channel structure would likely extend the rally even further, with $3.95 standing as the next major resistance and potential profit-taking area. 💎Momentum indicators are flipping. MACD histogram has turned green, and volume is starting to show life again. All eyes are now on how price reacts over the next few days. 💎However, if the market fails to sustain this breakout attempt and slides back below the $2.00 mark, the bullish thesis gets weaker. A breakdown below $1.90 re-exposes the strong demand zone, and if $1.70 fails, invalidation sits at $1.47. Below that, the setup is dead, and we’d be looking at a reset of the entire structure. This is the exact type of environment where inexperienced traders blow up chasing green candles or panic-selling strong demand. Don’t be that trader. MyCryptoParadise iFeel the success🌴

CryptoNuclear
HNT در نقطه انفجار: آیا صعود بزرگ در راه است یا سقوط نهایی؟ (تحلیل الگوی گوه نزولی)
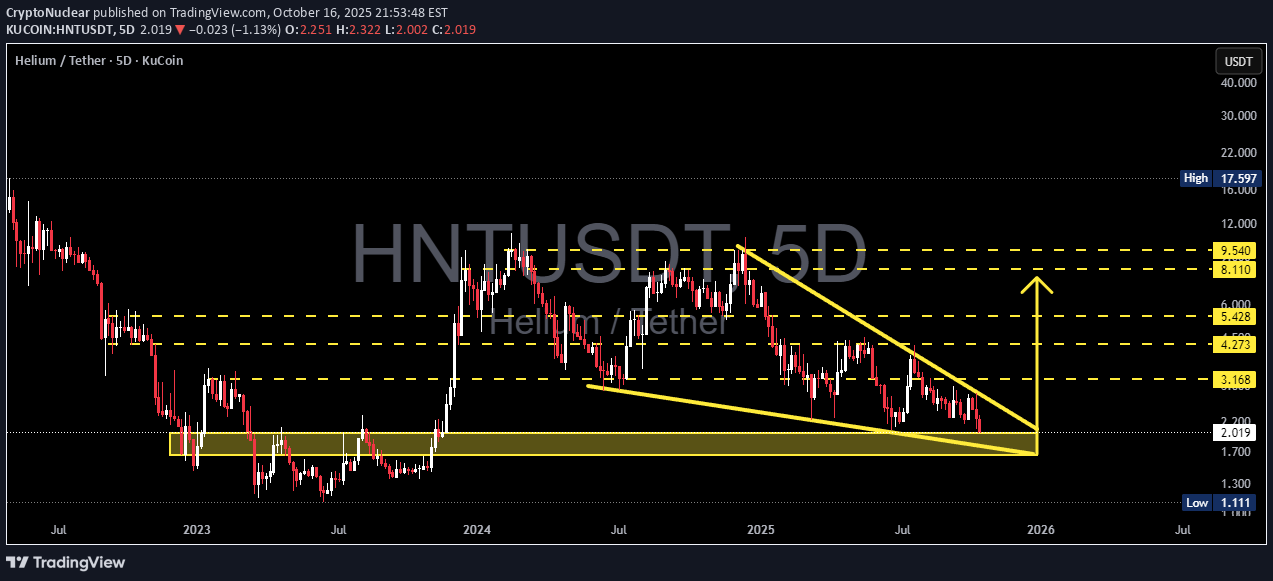
HNT is once again testing its major historical support zone between 1.70–2.02 USDT, a critical demand area that has acted as a price fortress since 2023. The chart is currently forming a Falling Wedge pattern, a classic structure that signals trend exhaustion and potential reversal. As the wedge tightens near a key support base, volatility compression suggests that a massive move is approaching — either a strong bullish breakout or a capitulation breakdown. --- 🔹 Pattern Explanation The chart reveals a Falling Wedge pattern — a series of lower highs and lower lows that converge, often preceding a bullish reversal when price breaks upward with strong volume. HNT is now hovering right above its historical demand zone, signaling potential smart money accumulation before a larger trend shift. Key Resistance Levels to Watch: 3.168 4.273 5.428 8.110 9.540 USDT Major Support Zone: 1.70 – 2.02 USDT (yellow box) --- 🟢 Bullish Scenario — Reversal Loading If HNT can break and close above the upper trendline of the wedge on the 5D timeframe with strong volume confirmation, it would mark the end of the extended downtrend. Such a breakout could trigger a multi-month recovery rally, with potential upside targets at: 3.16 → 4.27 → 5.42 → 8.11 → 9.54 USDT Given its proximity to the accumulation zone, the risk-to-reward ratio is highly favorable for swing or position traders anticipating a reversal. --- 🔴 Bearish Scenario — Breakdown to Historical Lows However, if the 1.70–2.02 USDT support zone fails, bearish momentum could accelerate. A confirmed 5D close below this level would expose the next potential target near: 1.11 USDT (historical low) Failure to defend this demand zone could trigger another leg of capitulation, likely marking the final phase of the bearish cycle before true bottom formation. --- ⚖️ Conclusion HNT is currently standing at a critical inflection point — a zone that will likely determine the next major trend. The Falling Wedge structure favors a bullish breakout if volume confirms, but a breakdown below 1.70 would shift the structure into a final bearish continuation phase. This is a compression-before-explosion setup — and whichever direction breaks first could define the next several months of HNT’s market structure. #HNT #Helium #HNTUSDT #CryptoAnalysis #TechnicalAnalysis #FallingWedge #SupportZone #Breakout #AltcoinSetup #ChartPattern #BullishSetup #CryptoTrader

DePIN Basket (Sep 2025)
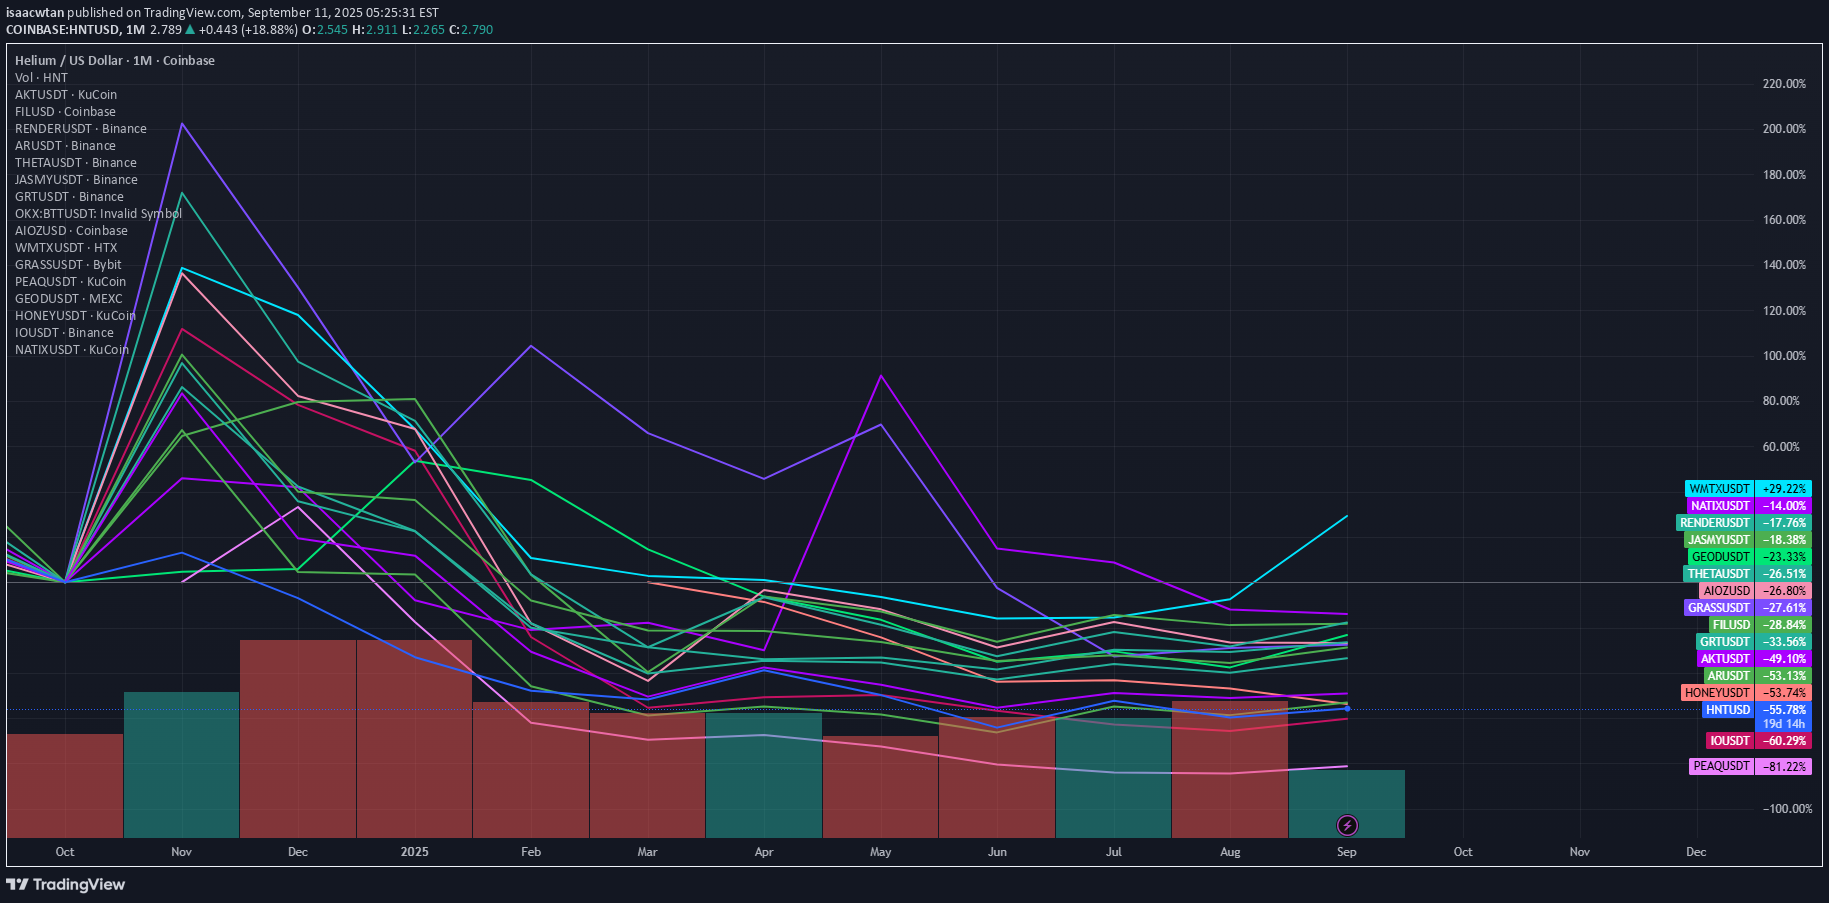
For private use. Tracks a basket of DePIN projects across different verticals Mainly intended to track against the performance of WMTx (Created October 2024)

ama-Beeps
Swing Trade Setup on HNT/USDT

I’ve spotted a potential retracement play on HNT/USDT that aligns with my swing trading plan. 📊 Setup Details: Entry Zone: Near current consolidation after reclaiming local support Target 1: $5.383 (around the 38% Fibonacci retracement) Target 2: Watching closely for a potential push toward the 50.0% Fib level if momentum continues Stop Loss: $2.305 (below the lowest order block) Risk/Reward Ratio: ~4.52 ✅ 🔍 Technical Confluence: Price is bouncing from a key support zone Super Trend Bullish Fib retracement levels (50% & 61.8%) match with prior supply zones 📅 Timeframe: Swing trade (days to weeks) ⚠ Risk Note: This is not financial advice – always DYOR before entering any trade.
DePIN Basket Comparison
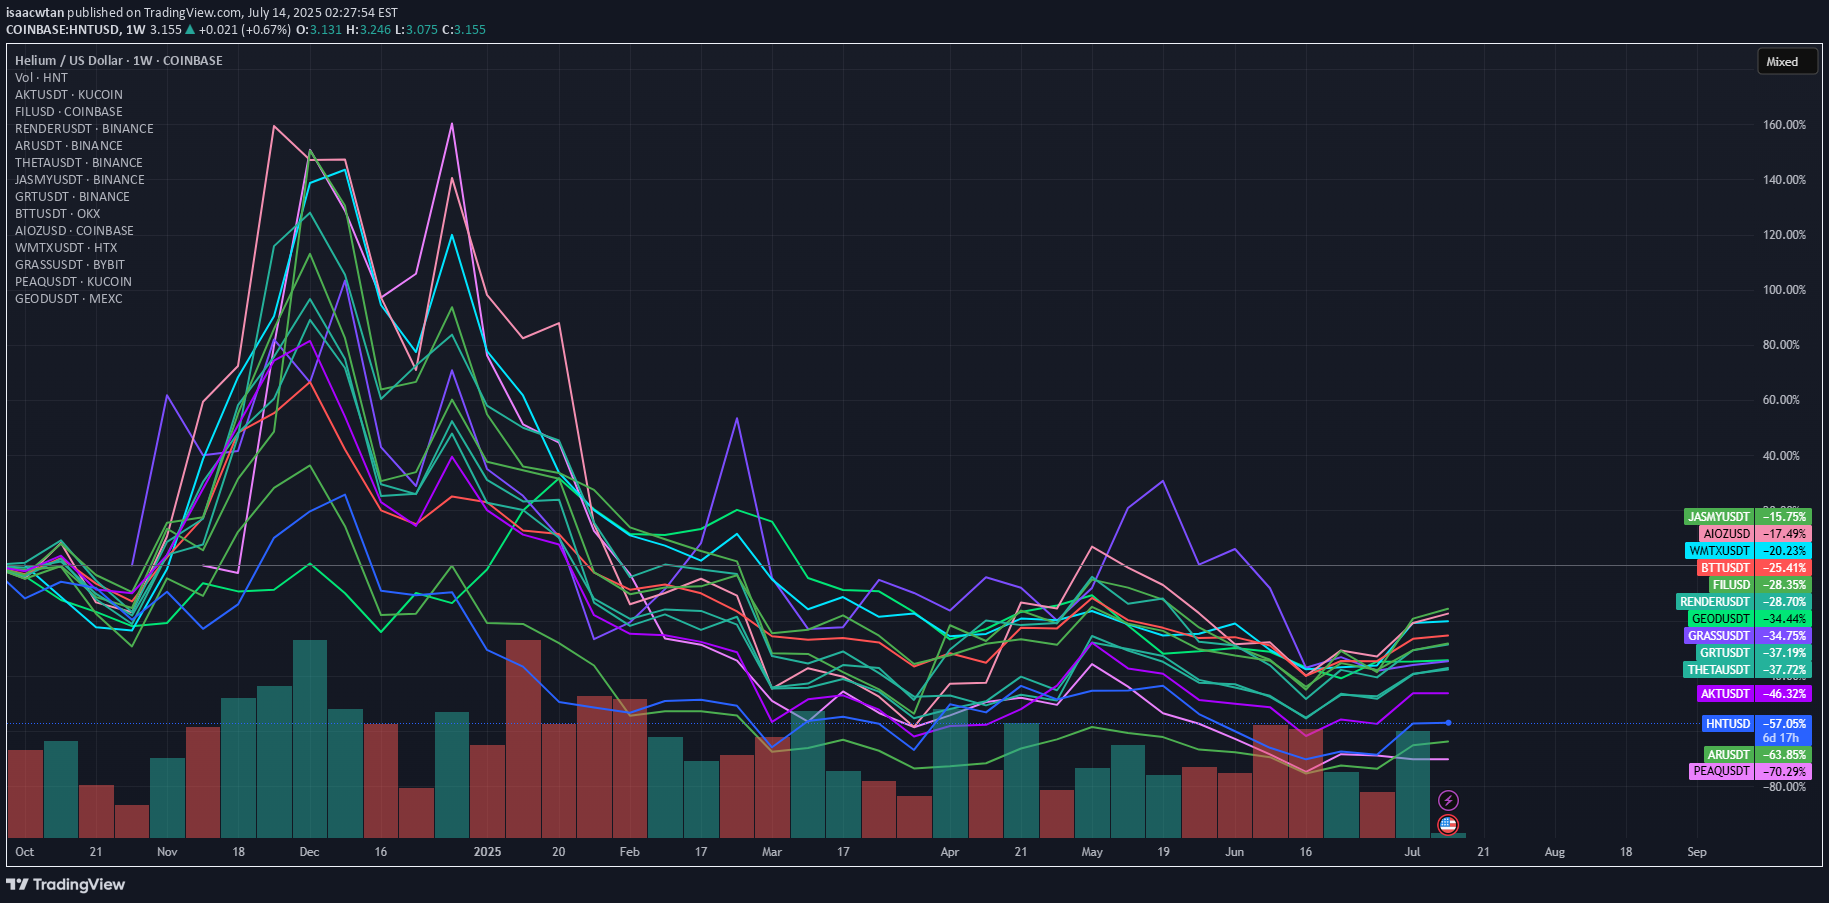
A basket of DePIN projects in the crypto space, including the largest names from previous cycles and the most relevant names in 2025 as well

HNT HELIUM

HNT HELIUM Does it break its old records? My note to myself, YTD.
Disclaimer
Any content and materials included in Sahmeto's website and official communication channels are a compilation of personal opinions and analyses and are not binding. They do not constitute any recommendation for buying, selling, entering or exiting the stock market and cryptocurrency market. Also, all news and analyses included in the website and channels are merely republished information from official and unofficial domestic and foreign sources, and it is obvious that users of the said content are responsible for following up and ensuring the authenticity and accuracy of the materials. Therefore, while disclaiming responsibility, it is declared that the responsibility for any decision-making, action, and potential profit and loss in the capital market and cryptocurrency market lies with the trader.