
HFT
Hashflow
| تریدر | نوع سیگنال | حد سود/ضرر | زمان انتشار | مشاهده پیام |
|---|---|---|---|---|
No results found. | ||||
Price Chart of Hashflow
سود 3 Months :
سیگنالهای Hashflow
Filter
Sort messages by
Trader Type
Time Frame

Bithereum_io
تحلیل تکنیکال HFT/USDT: ورود هیجانانگیز به گوه نزولی؛ سطوح خرید و اهداف انفجاری!
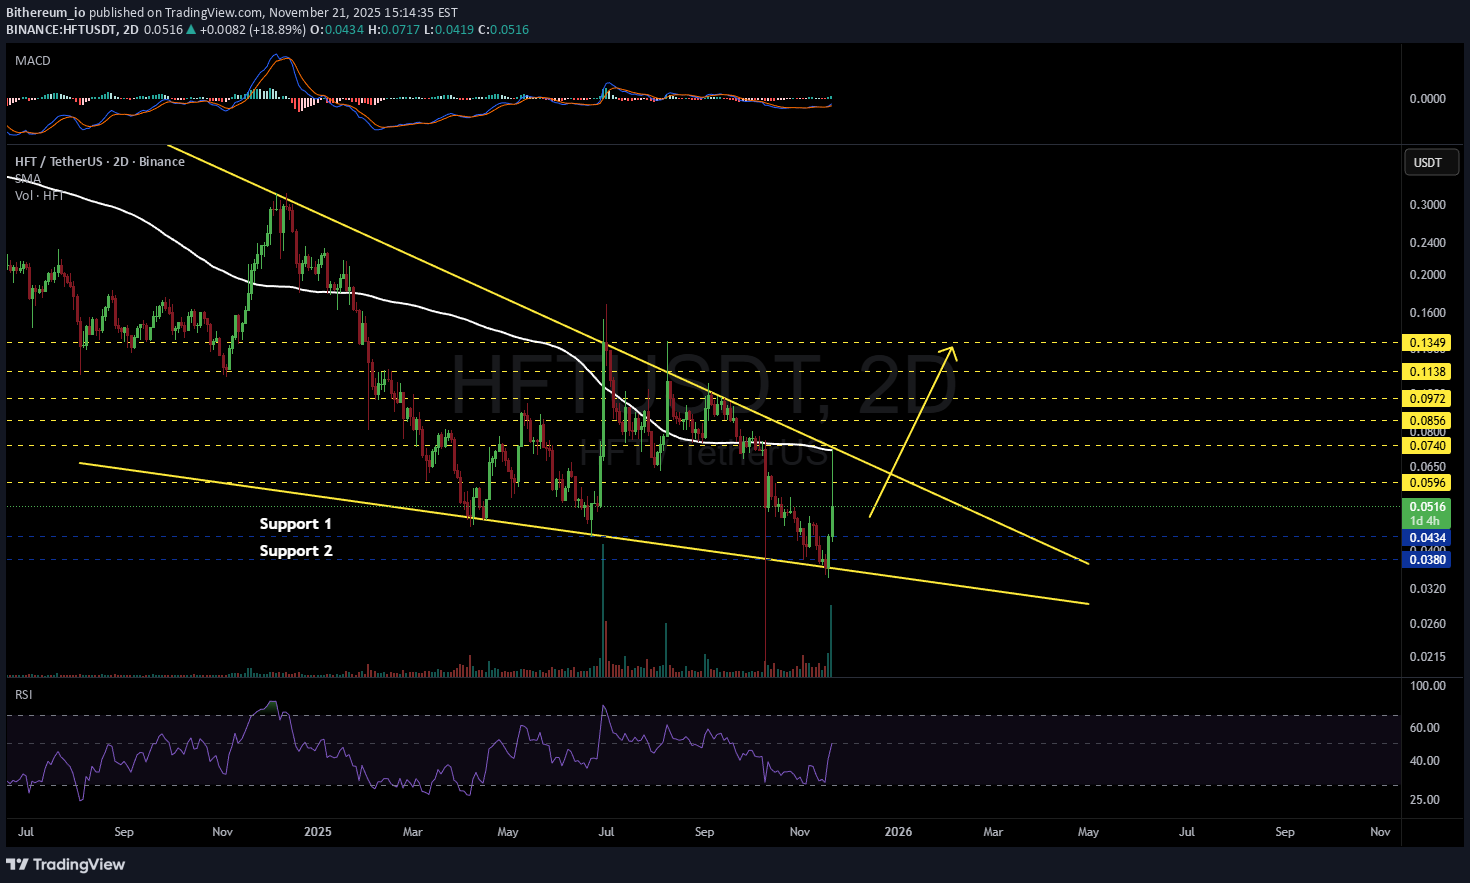
#HFT is moving inside a falling wedge pattern on the 2-day timeframe. It recently made a sharp upward move, but the rally stalled exactly at the confluence of the wedge resistance and the 2-day SMA100. Price tapped that zone and was immediately rejected, sending it back down. Consider buying a small bag here and near the support levels at $0.0434 and $0.0380. In case of a breakout above the wedge, the potential targets are: 🎯 $0.0596 🎯 $0.0740 🎯 $0.0856 🎯 $0.0972 🎯 $0.1138 🎯 $0.1349 ⚠️ Always remember to protect your capital with a proper stop-loss and disciplined risk management.

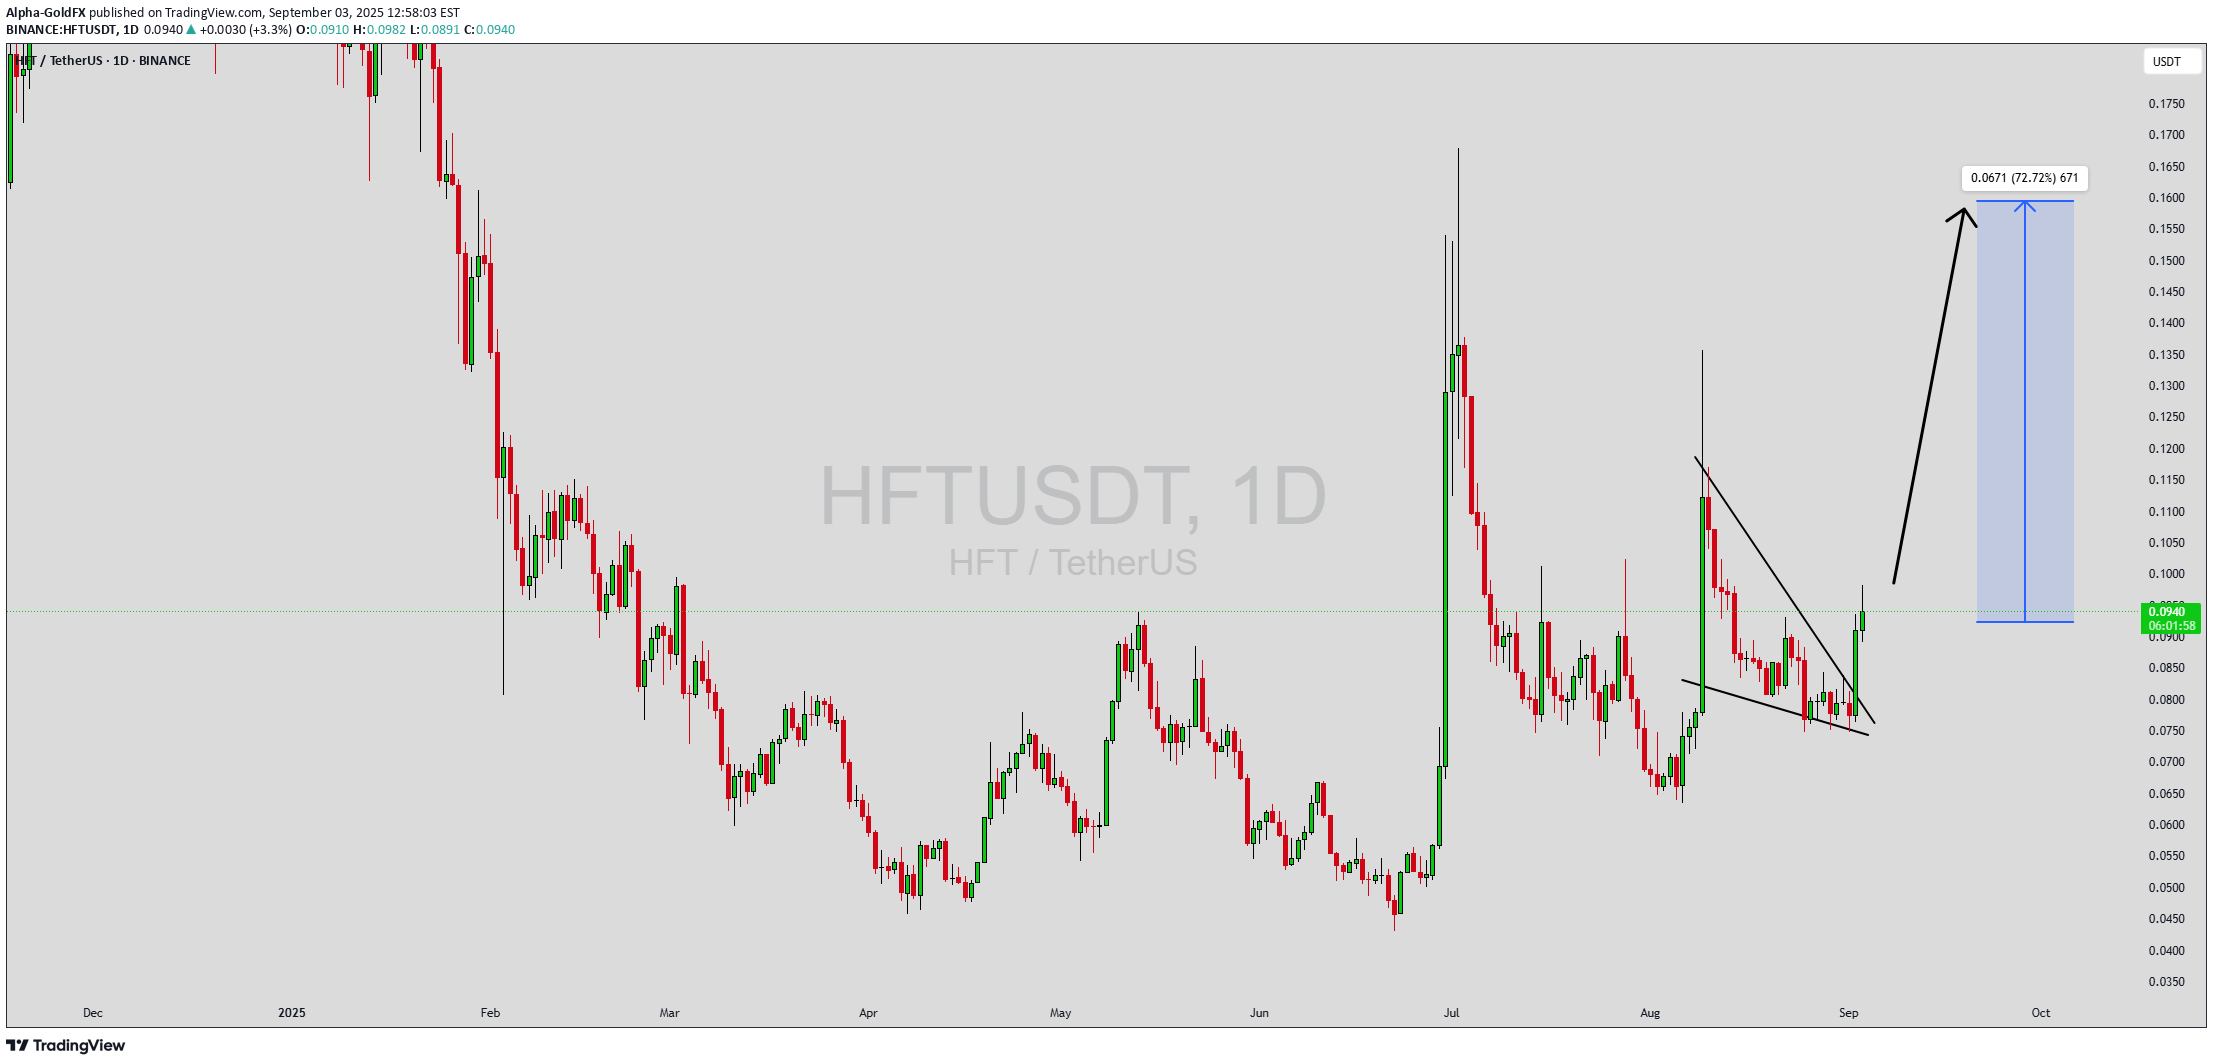
Alpha-GoldFX
الگوی گوه نزولی HFTUSDT: سیگنال انفجاری برای صعود 150 درصدی!
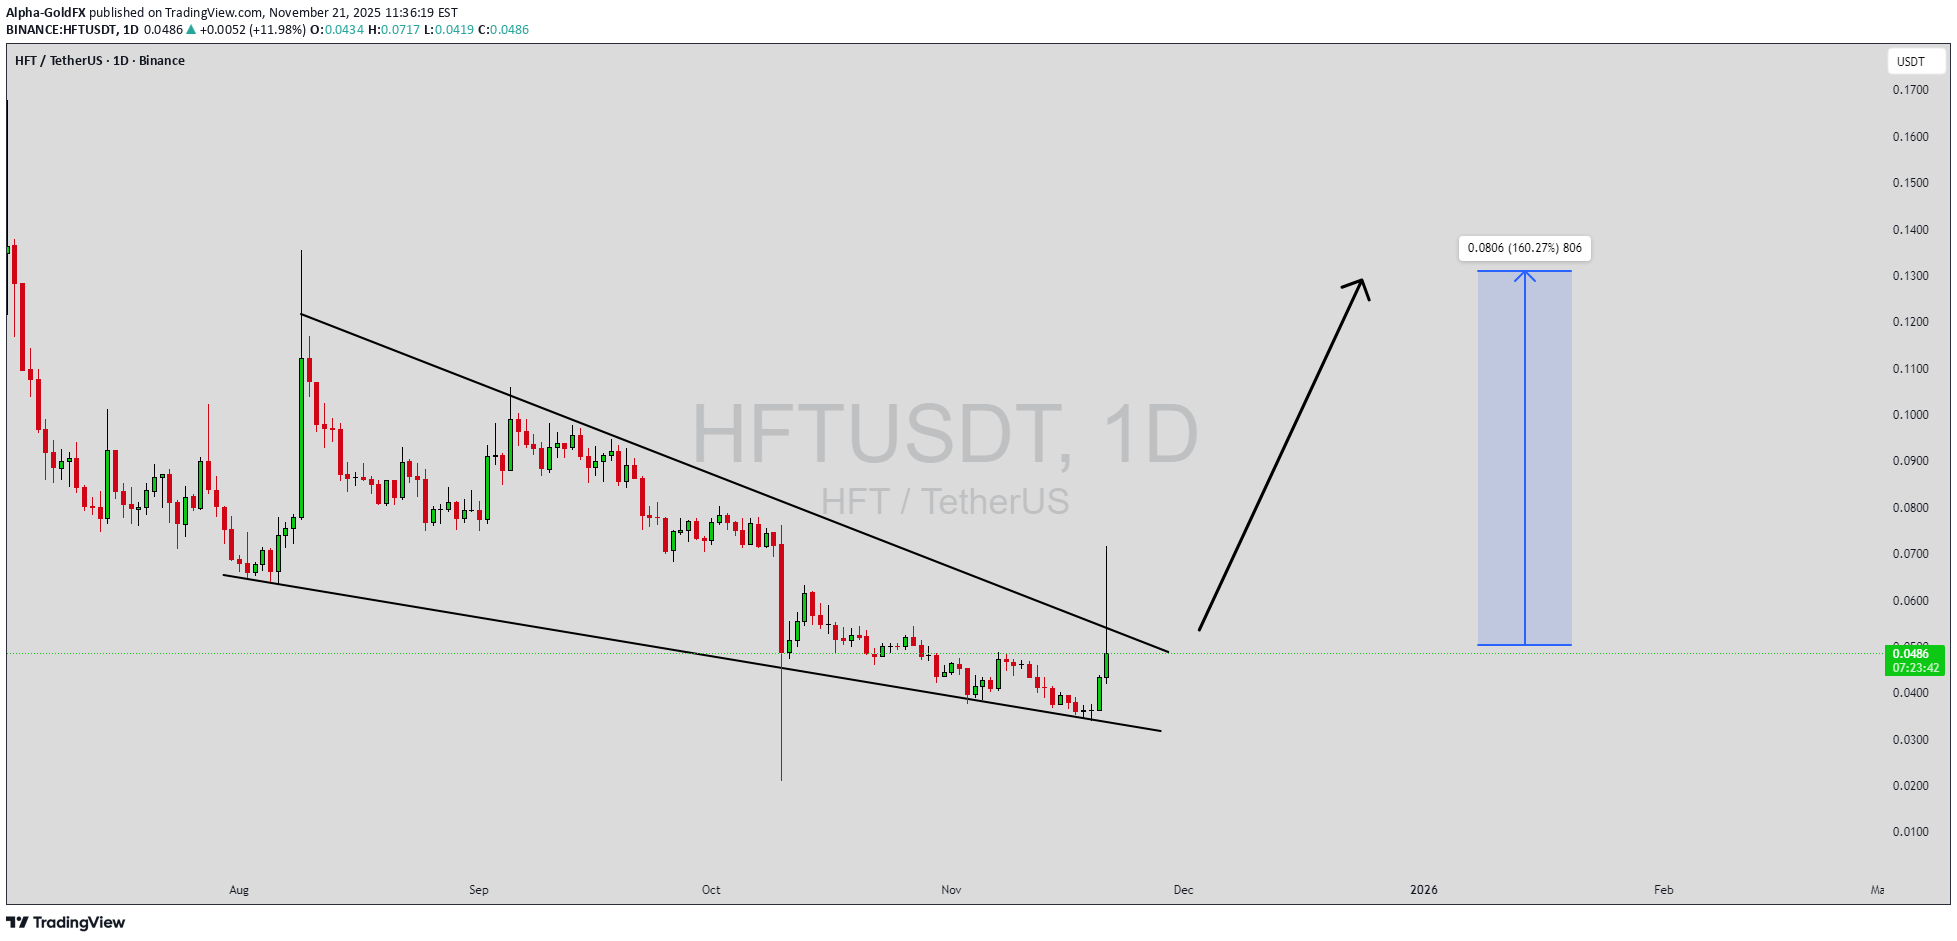
HFTUSDT is forming a classic falling wedge pattern on the daily charts, a reliable bullish reversal signal that's capturing the eye of savvy crypto traders as altcoin season heats up in late 2025. This tightening consolidation phase, with lower highs and higher lows converging toward the $0.045 support, points to fading seller exhaustion and stealthy buyer accumulation, setting the stage for a potential explosive breakout above the $0.050 resistance. Trading volume has been robust at over 12 million USDT in the past 24 hours across major exchanges like Binance and Bybit, underscoring genuine market interest rather than fleeting hype, especially as HFT hovers around $0.046 with RSI bouncing from oversold levels near 40. In the broader DeFi resurgence, Hashflow's intent-based RFQ model is aligning perfectly for cross-chain liquidity plays, making this falling wedge in HFTUSDT a high-probability setup for 140% to 150%+ gains as it eyes targets up to $0.11 in the coming weeks. Delving into the mechanics of this falling wedge pattern, it's a hallmark of corrective downtrends giving way to bullish momentum, often amplified by increasing volume on the upside probes we've seen in HFTUSDT lately—think of it as the market's way of shaking out weak hands before the real rally ignites. Recent price action has respected the wedge's boundaries with textbook precision, from the November low of $0.041 to today's resilient bounce, while MACD histograms flip positive and the 50-day EMA curls upward for that golden cross tease. Traders on platforms like TradingView are buzzing about HFTUSDT's undervalued position amid Solana's ecosystem boom, where Hashflow's bridgeless swaps and zero-slippage execution are drawing in institutional flows from partners like Jump Crypto. This isn't just technical poetry; it's backed by real traction, with the token's market cap holding steady at around $75 million despite broader volatility, positioning HFTUSDT for a sentiment shift as Bitcoin stabilizes post-Fed speech For risk-savvy traders eyeing HFTUSDT, anchor entries near $0.044 with stops below $0.041 for a juicy 1:3+ risk-reward, and scale out at $0.07 and $0.11 on volume spikes to lock in those projected 140%+ moves. While short-term dips like today's 7-12% pullback on exchange summaries add caution, the falling wedge's bullish bias remains intact, amplified by Hashflow's protocol expansions into Monad and major DeFi chains. As cross-chain intents become the norm, HFTUSDT could lead the next wave of DEX innovations, turning this pattern into a portfolio catalyst for Q4 2025 and beyond. ✅ Show your support by hitting the like button and ✅ Leaving a comment below! (What is You opinion about this Coin) Your feedback and engagement keep me inspired to share more insightful market analysis with you!

LedgerTraders
سیگنال خرید طلایی HFT: بازگشت صعودی قوی در تایم فریم یک ساعته!

After a strong breakdown, price has started forming a potential reversal structure on the 1H timeframe. Currently, HFT is respecting the ascending trendline support and showing early signs of strength. A clean breakout above the local resistance could confirm bullish continuation toward the marked supply zone. **Setup Details:** * **Entry:** Around trendline support (~0.051) * **Target:** 0.07370 * **Stop-loss:** 0.04350 * **Risk/Reward Ratio:** 1:3+ * **Bias:** Bullish as long as price stays above the trendline **Notes:** Wait for confirmation candle before entry. If price breaks below the trendline, setup becomes invalid. Perfect setup for swing traders looking for a short-term bullish move.

CryptoNuclear
HFT/USDT — Will Bears Continue, or Will Bulls Take Control?
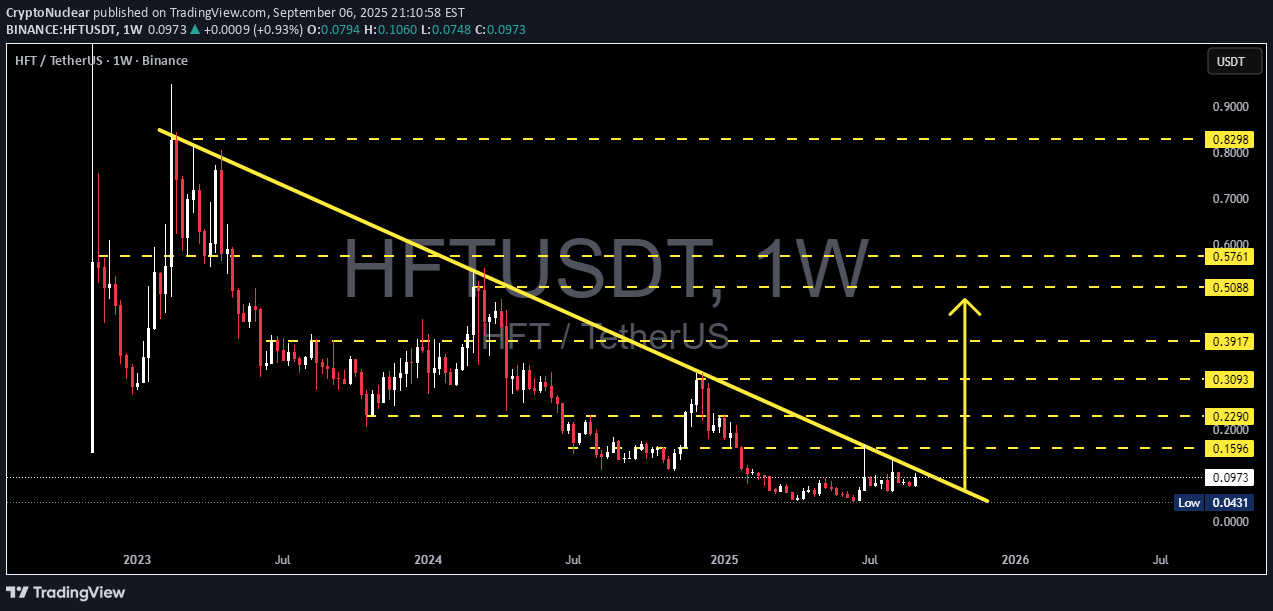
Overview: HFT has been trapped in a long-term downtrend since 2022, defined by the descending yellow trendline. Price is now consolidating at a critical zone, holding above strong support around 0.0431 (Low) while testing the descending trendline near 0.0969. This is a make-or-break moment: will it continue the bearish cycle or start a potential accumulation phase for a major reversal? --- 🔎 Pattern & Market Structure Descending Trendline → pressing the market down with consistent lower highs since 2022. Horizontal Support → 0.0431 has been the main floor, repeatedly tested. Potential Scenarios: Breakdown confirms a descending triangle, continuation of the downtrend. Breakout above the trendline may signal a falling wedge breakout, often leading to strong bullish reversal. --- 🟢 Bullish Scenario 1. Breakout Confirmation: Weekly close above the descending trendline (~0.0969). 2. Healthy Retest: Price flips the trendline into support with strong rejection of the downside. 3. Upside Targets: 0.1596 → first key resistance 0.2290 → strong supply zone 0.3093 – 0.3917 → medium-term bullish targets 4. Extra Signals: Strong breakout volume + bullish RSI divergence would strengthen the setup. --- 🔴 Bearish Scenario 1. Rejection at Trendline: Price fails to break above ~0.0969. 2. Breakdown Below 0.0431: Weekly close under this level confirms bearish continuation. 3. Downside Target: Opens the path for new lows, as historical support becomes invalid. 4. Confirmation: Weakening buying volume + momentum indicators (MACD/RSI) pointing down. --- 📌 Conclusion & Strategy HFT is at a decision zone: either confirm a bullish reversal or extend its long-term bearish cycle. Bullish Path: A breakout with volume could trigger a swing move toward 0.1596 → 0.2290. Bearish Path: A breakdown below 0.0431 validates the descending triangle → continuation to new lows. Risk Management is crucial — this is a high-volatility zone. --- 📢 Trader’s Note Wait for weekly confirmation candles before committing to a position. Aggressive traders may speculate longs near support with tight stops under 0.0431. Conservative traders should wait for a confirmed breakout above the trendline. Remember: low price ≠ cheap — always confirm with structure and volume. --- #HFT #HFTUSDT #CryptoAnalysis #Altcoins #CryptoTrading #Breakout #BearishVsBullish #SupportResistance #Trendline

CryptoWithJames
HFTUSDT Forming Bullish Pennant
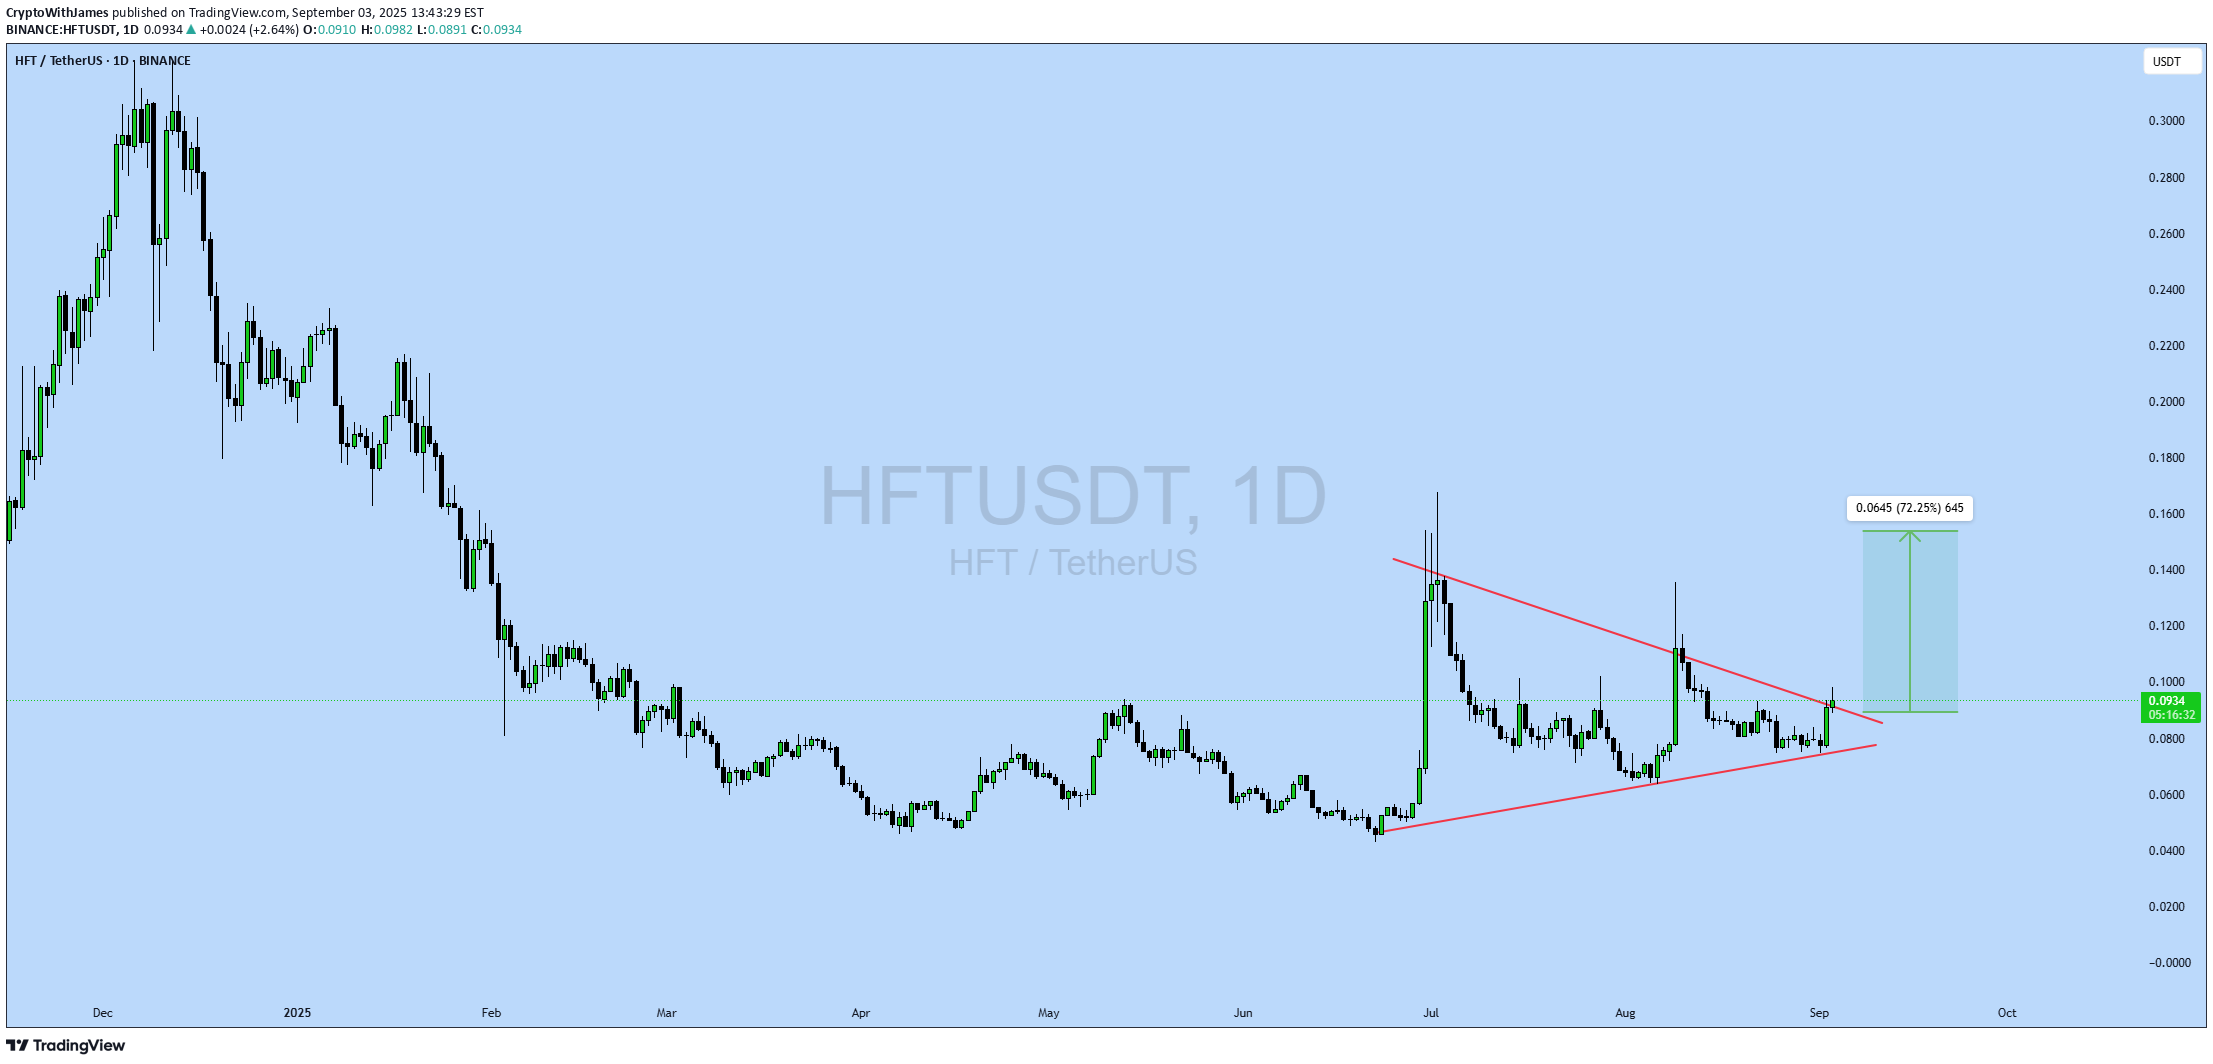
#HFT UPDATE HFT Technical Setup Pattern : Bullish Pennant Pattern Current Price: $0.0937 Target Price: $0.158 Target % Gain: 72.25% Technical Analysis: HFT is forming a bullish pennant on the 1D chart with a breakout attempt supported by recent volume. If the price sustains above the $0.09 breakout zone, continuation toward $0.158 is expected. Time Frame: 1D Risk Management Tip: Always use proper risk management.
CryptoWithJames
HFTUSDT UPDATE
#HFT UPDATE HFT Technical Setup Pattern : Bullish Pennant Pattern Current Price: $0.0937 Target Price: $0.158 Target % Gain: 72.25% Technical Analysis: HFT is forming a bullish pennant on the 1D chart with a breakout attempt supported by recent volume. If the price sustains above the $0.09 breakout zone, continuation toward $0.158 is expected. Time Frame: 1D Risk Management Tip: Always use proper risk management.
Alpha-GoldFX
HFTUSDT Forming Falling Wedge
HFTUSDT is showing a promising setup as it forms a falling wedge pattern, a bullish reversal structure that often signals an upcoming breakout. This pattern develops when price action trends lower while narrowing its range, indicating selling pressure is weakening and buyers are preparing to take control. The presence of good trading volume adds strength to this setup, confirming that investors are actively accumulating positions during this consolidation phase. The technical outlook suggests that once HFTUSDT breaks out of the falling wedge, it could trigger a significant upward rally. Based on historical price behavior, falling wedge breakouts often deliver strong percentage gains, and in this case, an expected move of around 60% to 70%+ looks achievable. The volume profile supports this view, as steady inflows from investors are reinforcing market confidence in the potential upside. Investor interest in HFTUSDT is steadily increasing, which is a positive sign for sustained momentum. Market participants appear to be positioning themselves for a bullish breakout, and this could quickly push the price toward key resistance levels. The falling wedge pattern, combined with solid investor sentiment, creates a strong technical foundation for an upcoming rally. In conclusion, HFTUSDT is presenting one of the more attractive bullish reversal setups in the market. The falling wedge pattern, coupled with good trading volume and growing investor attention, sets the stage for a potential surge. Traders should watch closely for a confirmed breakout, as this could open the door to strong gains in the coming sessions. ✅ Show your support by hitting the like button and ✅ Leaving a comment below! (What is You opinion about this Coin) Your feedback and engagement keep me inspired to share more insightful market analysis with you!

MergicNet
HFTUSDT | Bullish Momentum Gaining Strength!

🚀 Trade Setup Details: 🕯 #HFT/USDT 🔼 Buy | Long 🔼 ⌛️ Timeframe: 4H -------------------- 🛡 Risk Management: 🛡 If Your Account Balance: $1000 🛡 If Your Loss-Limit: 1% 🛡 Then Your Signal Margin: $42.64 -------------------- ☄️ En1: 0.0928 (Amount: $4.26) ☄️ En2: 0.0848 (Amount: $14.92) ☄️ En3: 0.0796 (Amount: $19.19) ☄️ En4: 0.0747 (Amount: $4.26) -------------------- ☄️ If All Entries Are Activated, Then: ☄️ Average.En: 0.0823 ($42.64) -------------------- ☑️ TP1: 0.1153 (+40.1%) (RR:1.71) ☑️ TP2: 0.1356 (+64.76%) (RR:2.76) ☑️ TP3: 0.1667 (+102.55%) (RR:4.37) ☑️ TP4: 0.2167 (+163.3%) (RR:6.96) ☑️ TP5: 0.2896 (+251.88%) (RR:10.74) ☑️ TP6: Open 🔝 -------------------- ❌ SL: 0.063 (-23.45%) (-$10) -------------------- 💯 Maximum.Lev: 2X ⌛️ Trading Type: Swing Trading ‼️ Signal Risk: 🙂 Low-Risk! 🙂 🔎 Technical Analysis Breakdown: This technical analysis is based on Price Action, Elliott waves, SMC (Smart Money Concepts), and ICT (Inner Circle Trader) concepts. All entry points, Target Points, and Stop Losses are calculated using professional mathematical formulas. As a result, you can have an optimal trade setup based on great risk management. 📊 Sentiment & Market Context: The sentiment around HFT/USDT is turning decisively bullish as the market shows strong momentum in favor of upward movement. After a period of consolidation, the coin is poised to break key resistance levels, signaling potential for significant gains. HFT, known for its unique decentralized finance (DeFi) ecosystem, continues to build on strong fundamentals including increasing adoption and strategic partnerships, which are driving investor confidence. With supportive market conditions and solid technical setups, HFT/USDT looks ready to capitalize on the next leg up in this crypto rally. ⚠️ Disclaimer: Trading involves significant risk, and past performance does not guarantee future results. This analysis is for informational purposes only and should not be considered financial advice. Always conduct your research and trade responsibly. 💡 Stay Updated: Like this technical analysis? Follow me for more in-depth insights, technical setups, and market updates. Let's trade smarter together!Entry Points have been activated. Ready to gain profits?

shakatrade1_618
HFT: One Last Pump Before the Dumpster?

🚨 HFTUSD HFTUSDT — Quick Breakdown 🚨 📉 Structure Clear bearish trend: lower lows, lower highs. Every time momentum hits overbought, we get another dump. Altseason? Highly unlikely to save this shitcoin. 📊 Price Action June brought a bounce, but July almost completely erased it. If August closes below its open — expect the downtrend rally to continue. 🌊 Wave Scenario June’s move looks like a potential impulse, so one more upward leg is possible: 🎯 T1: 0.1023 (July high) 🎯 T2: 0.1678 (July 2nd high) 🔝 Max realistic: 0.1800 (monthly imbalance fill) 🦄 Fantasy land: 0.2450 if we get a “fairy-tale” altseason. 💩 Fundamentally — this is a worthless piece of dog sh*t, don’t expect long-term miracles.HFT — update We hit the first target almost immediately; I took profit as the volume spike looked like a classic exit pump. Revisiting the idea now: looks like this shitcoin is in re-accumulation (possible ABCDE triangle). Base plan: one more push up toward target 2.

behdark
HFT Buy/Long Setup (1D)
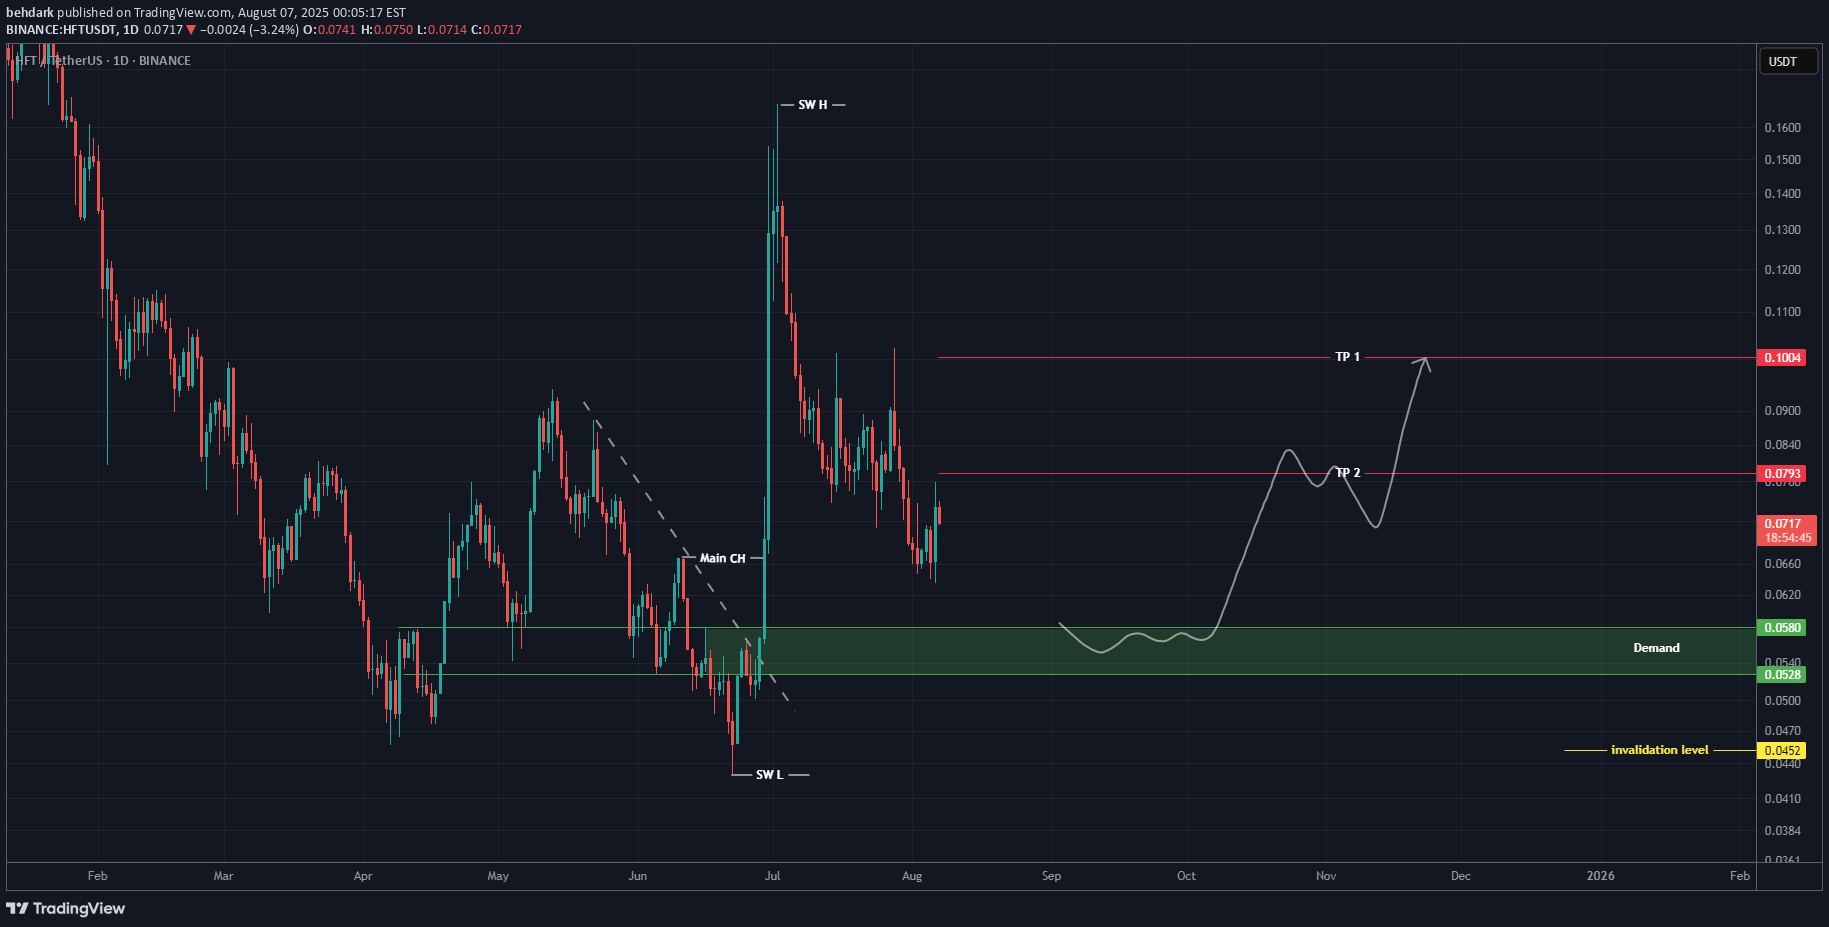
After the downward trendline break and the formation of the main CH (Change of Character), we can look for buy/long positions around the key support zones. A healthy time correction has also formed on the chart, and with price approaching the demand zone, we expect a strong reaction. The support zone and target levels (TPs) are marked on the chart. A daily candle close below the invalidation level will invalidate this analysis. For risk management, please don't forget stop loss and capital management When we reach the first target, save some profit and then change the stop to entry Comment if you have any questions Thank You
Disclaimer
Any content and materials included in Sahmeto's website and official communication channels are a compilation of personal opinions and analyses and are not binding. They do not constitute any recommendation for buying, selling, entering or exiting the stock market and cryptocurrency market. Also, all news and analyses included in the website and channels are merely republished information from official and unofficial domestic and foreign sources, and it is obvious that users of the said content are responsible for following up and ensuring the authenticity and accuracy of the materials. Therefore, while disclaiming responsibility, it is declared that the responsibility for any decision-making, action, and potential profit and loss in the capital market and cryptocurrency market lies with the trader.