
GOAT
Goatseus Maximus
| تریدر | نوع سیگنال | حد سود/ضرر | زمان انتشار | مشاهده پیام |
|---|---|---|---|---|
No results found. | ||||
Price Chart of Goatseus Maximus
سود 3 Months :
سیگنالهای Goatseus Maximus
Filter
Sort messages by
Trader Type
Time Frame

CryptoNuclear
سطح حیاتی GOAT/USDT: آیا زمان برگشت بزرگ یا سقوط عمیق فرا رسیده است؟

GOAT is now sitting at the most critical level since its earlier distribution phase: the price has returned to retest the Primary Structural Base at 0.041–0.035, a zone that previously triggered a major bullish expansion. This area is not just support — it is the battleground that decides the next macro direction. The entire downtrend from the peak has formed a consistent descending wave structure, yet each drop into the 0.041–0.035 block has been met with aggressive buy absorption. This indicates that a large liquidity cluster sits within this zone and may act as the pivot for a significant reversal. --- Pattern & Market Structure Overview Price action is currently forming a low-compression pattern into the key support. This typically ends with either: a strong impulsive reversal, or a high-momentum breakdown into deeper liquidity zones. The latest 2D candle closed right above the upper boundary (0.041), showing buyers are still defending — but the momentum remains fragile. Overhead resistance levels (0.0635 → 0.0885 → 0.114 → 0.150 → 0.1999) form a clean ladder of recovery targets if a bounce is confirmed. --- Bullish Scenario — “Major Accumulation Rebound” This scenario activates if: 1. Price holds and rebounds strongly from 0.041–0.035. 2. A clean 2D close above 0.0635 appears — this zone is the Bullish Trigger. Once confirmed, the market shifts from a downtrend into a recovery structure, with step targets: 0.0635 → Reversal validation 0.0885 → Momentum expansion 0.114–0.150 → Mid-range trend shift 0.1999 → Major structural retest From the support zone to the upper targets, the upside potential can reach +300%, but only with full bullish confirmation. --- Bearish Scenario — “Liquidity Flush Breakdown” A strong breakdown below 0.035 signals buyer exhaustion. If that occurs: Price will likely drop quickly into 0.02684 (previous liquidity wick). If 0.02684 fails, the chart may enter a capitulation phase, opening the path toward the low 0.02 region. This would confirm the continuation of the primary downtrend. --- Core Conclusion GOAT is positioned inside a macro decision zone. The 0.041–0.035 range determines whether we see: the end of the prolonged bearish cycle and the beginning of a major reversal, or the start of a deeper capitulation leg, as the market hunts lower liquidity. This makes the zone both the highest-reward entry area and the highest-risk failure point. #GOATUSDT #GOAT #CryptoAnalysis #PriceAction #SupportZone #Breakout #BullishScenario #BearishScenario #CryptoTA #TechnicalAnalysis

Bithereum_io
GOATUSDT 1D
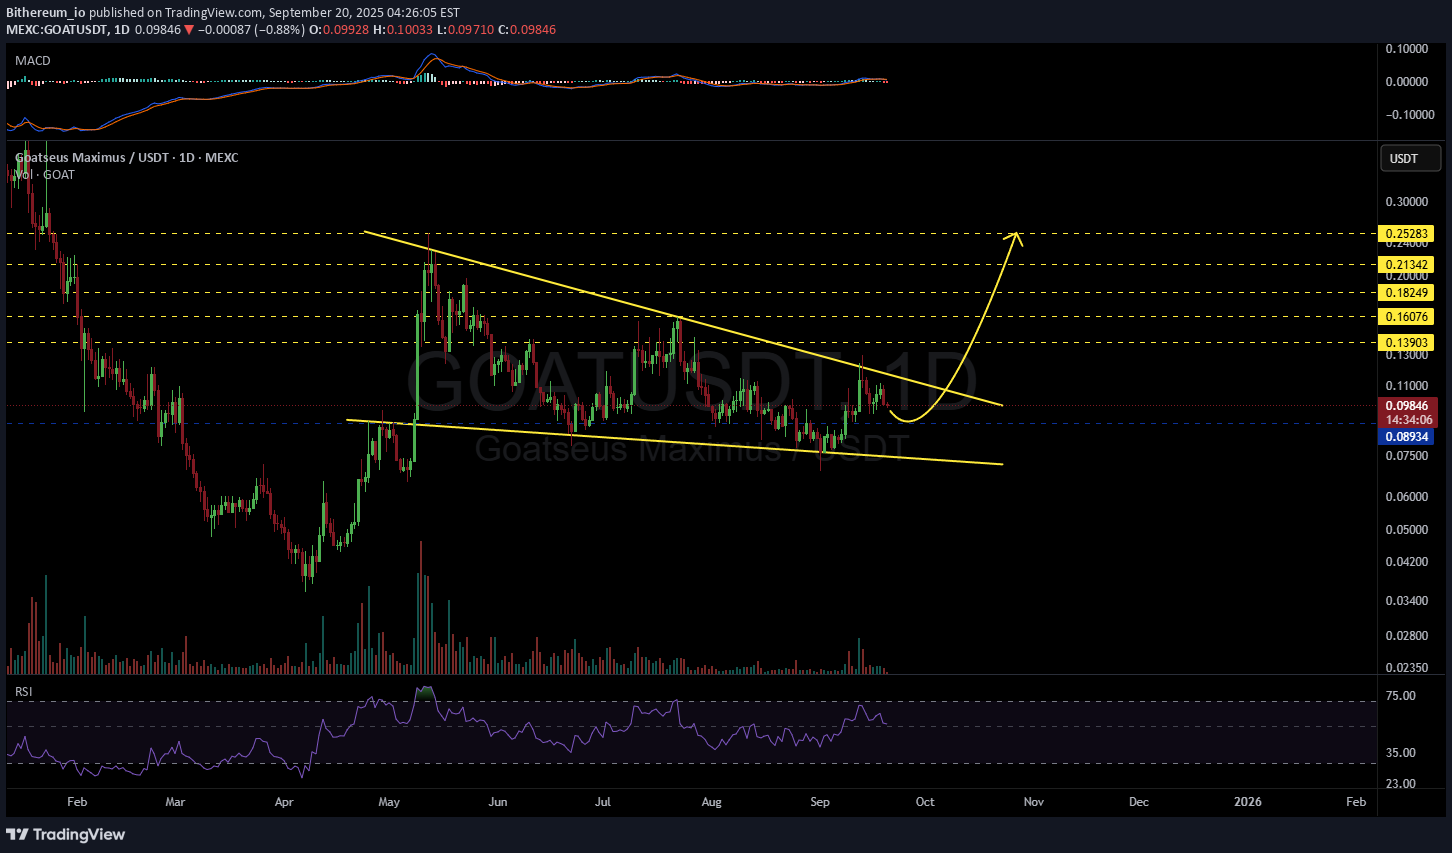
#GOAT is moving inside a falling wedge pattern on the daily chart. In case of a breakout above the wedge resistance, the potential targets are: 🎯 $0.13903 🎯 $0.16076 🎯 $0.18249 🎯 $0.21342 🎯 $0.25283 ⚠️ Always remember to use a tight stop-loss and follow proper risk management.

Cryptojobs

Cryptojobs


mehdishirian
GOAT LONG
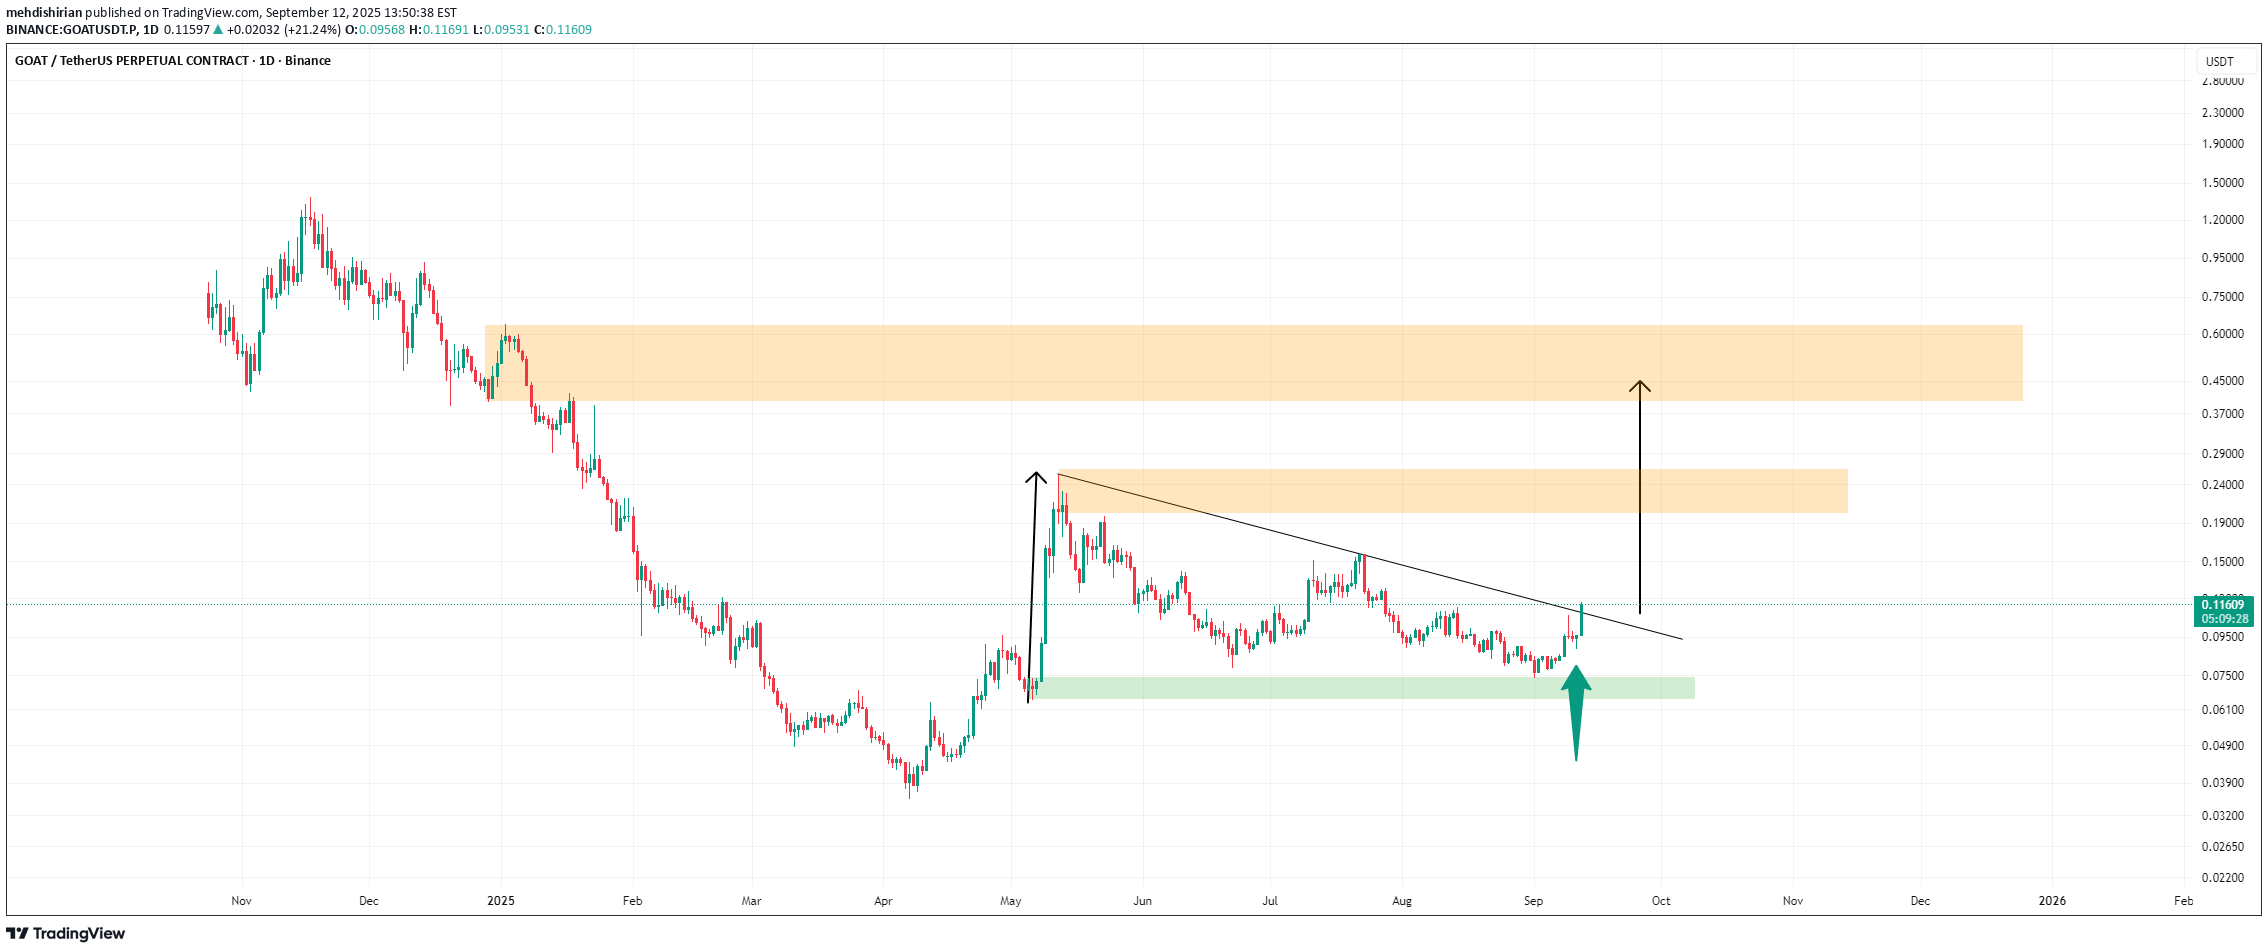
Hello friends 💖 It seems that the GOAT-USDT cryptocurrency has taken a very good bullish guard and can move up to the orange targets I seriously suggest you keep this cryptocurrency on your watchlist 🔥 To support me, I would appreciate it if you boost the analysis and share it with your friends so that I can analyze it with more energy for you, my dears. Thank you all. 💖

HexaTrades
GOATUSDT: 1000%+ Potential!
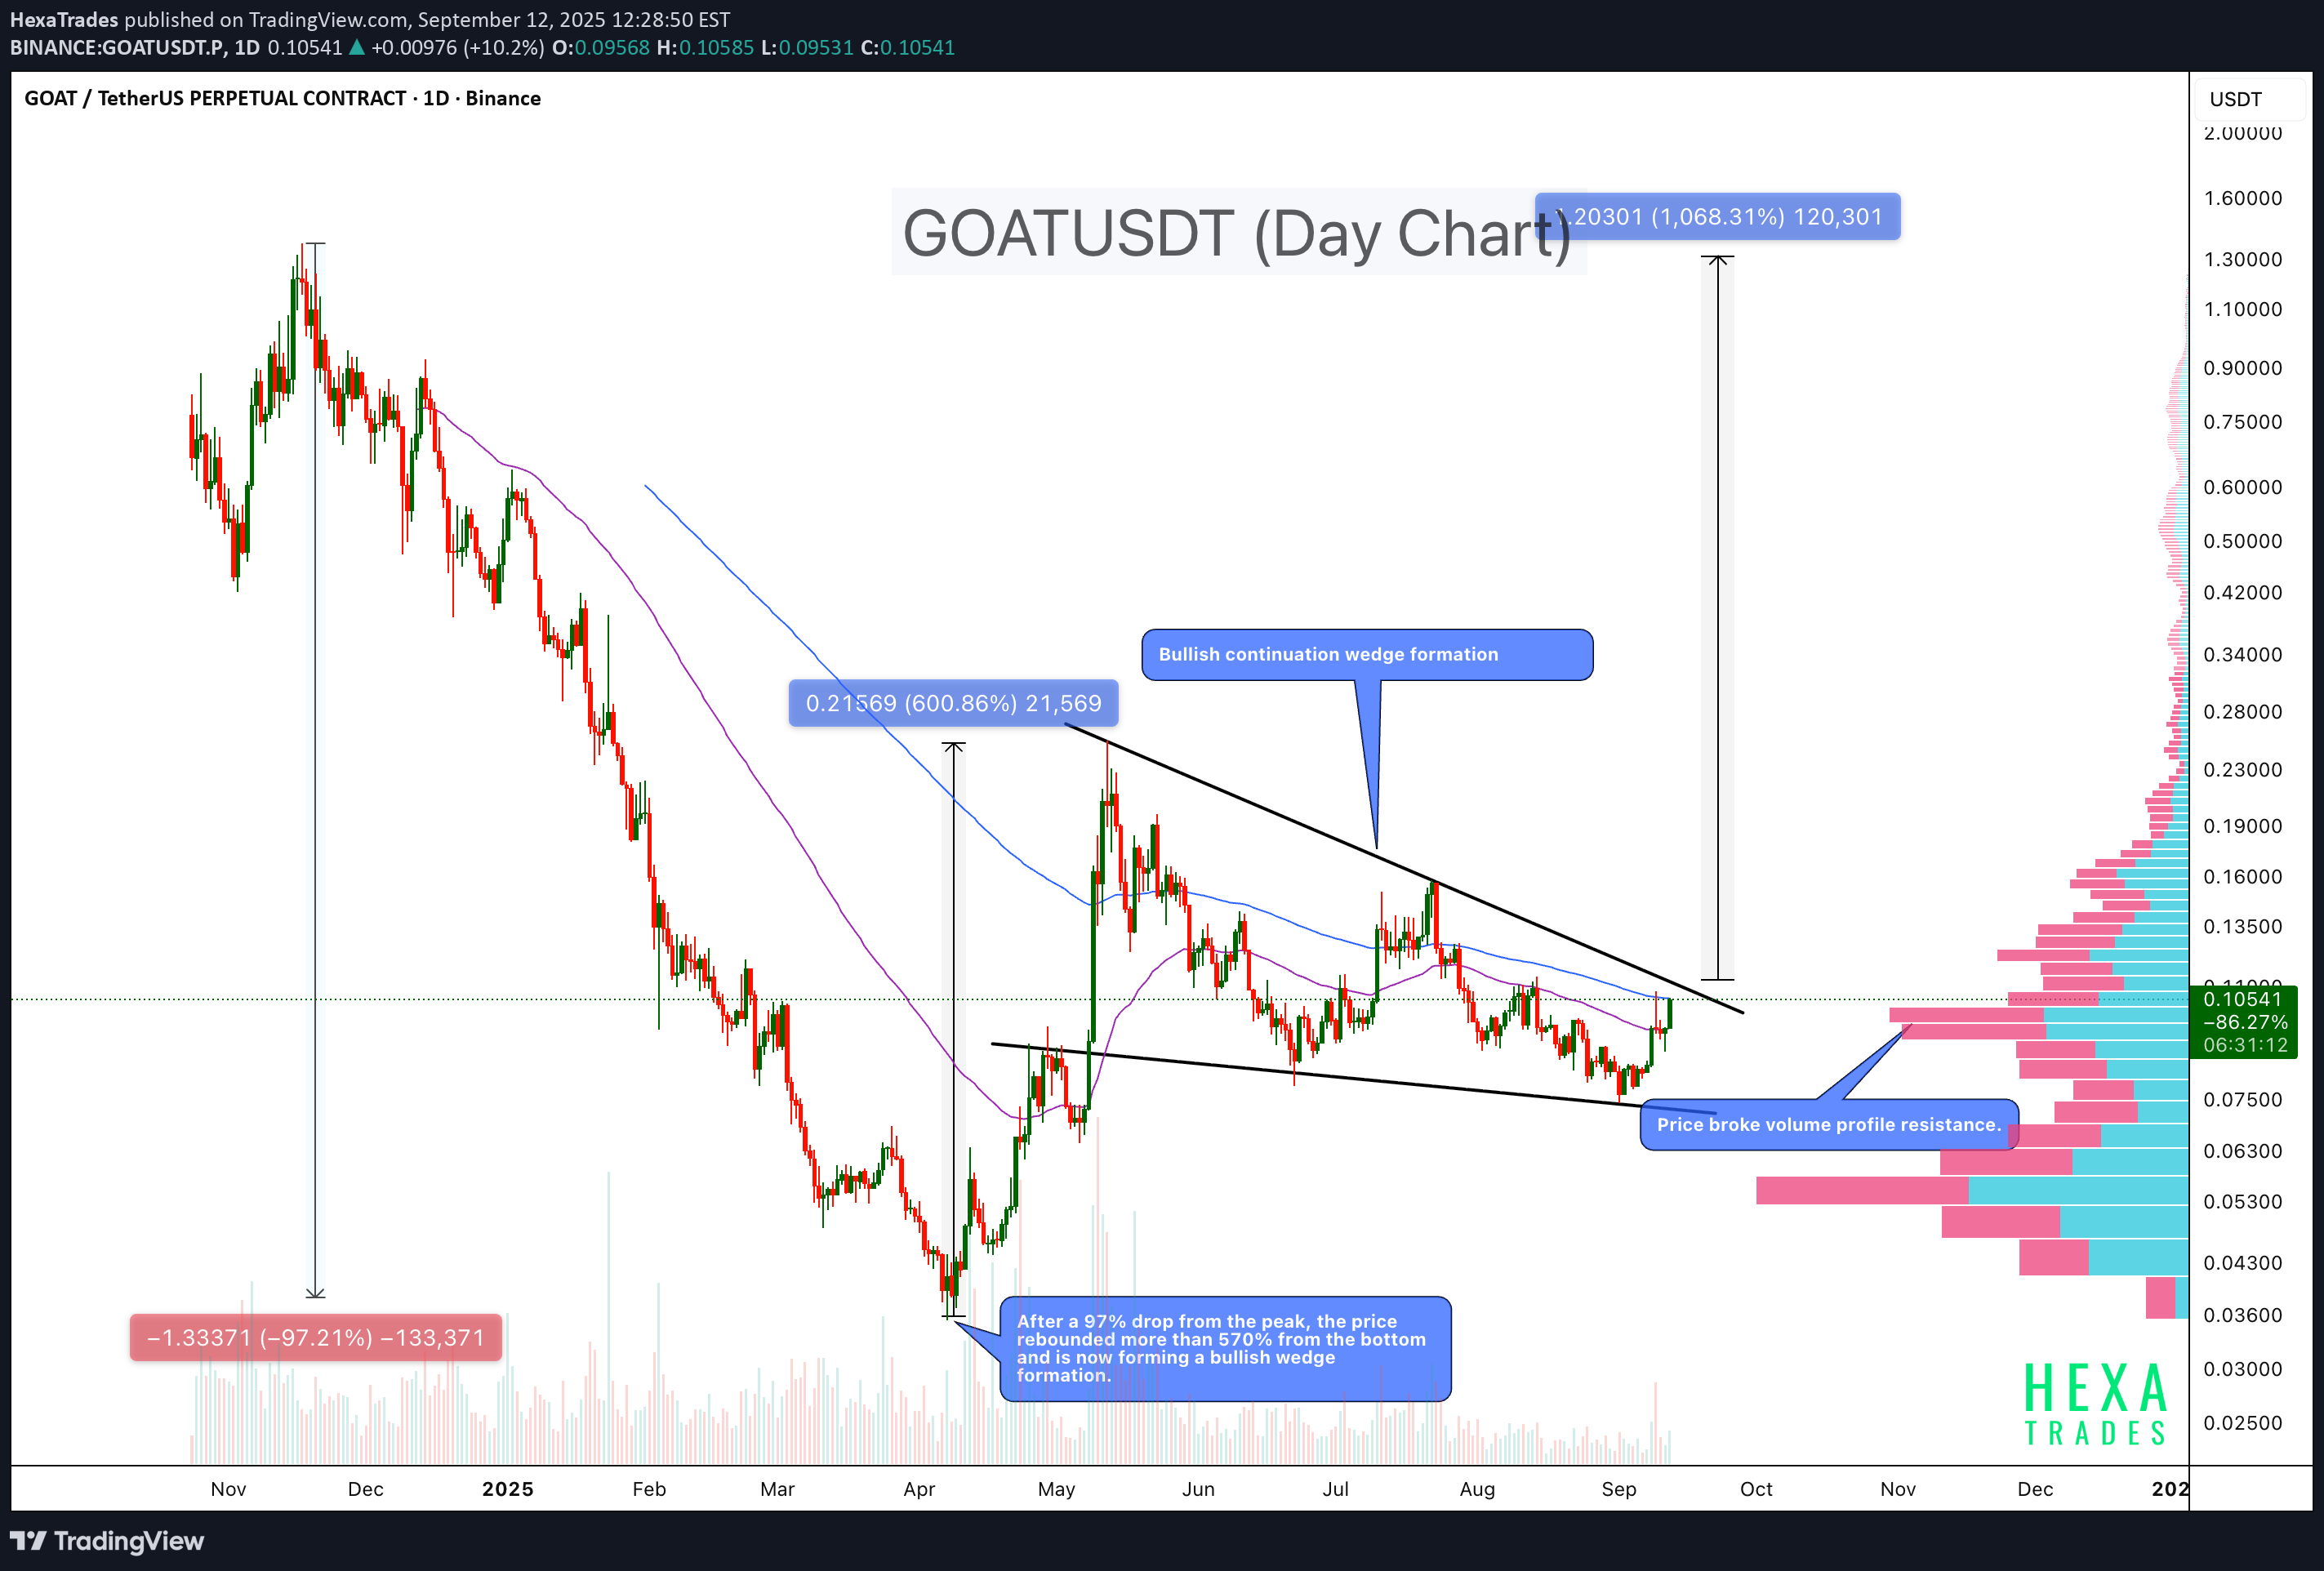
GOAT has seen extreme volatility over the past year. After a massive 97% drop from the peak, the price staged a strong recovery of over 570% from the bottom. Now, the chart is showing a bullish continuation wedge formation, suggesting momentum may be shifting again. Key Highlights Structure: Price consolidating inside a bullish wedge pattern. Volume Profile: Recent move broke through a key resistance zone, showing buyers stepping in. Moving Averages: Price reclaiming EMAs will act as dynamic support. Upside Potential: Technical projection points to a strong continuation move if the wedge breakout confirms. 📈 Trading Plan Entry Zone: Above $0.11. Target (TP): 300%- 1000% Stop-Loss (SL): Below $0.074 support Cheers Hexa

janisberzins130
GOAT USD backtested the downtrend line, UP from here. Higher!

The downtrend line that we broke above 3 days back has now been backtested and was bough back up instantly. Could be taken as a signal that we go higher from here
janisberzins130
GOATUSDT break out

Goat has broken out above the down trend line. If this holds, continuation possible

GOAT Analysis

Our team has been closely monitoring GOAT and based on the current chart structure, a clear setup is forming. The technical indicators suggest potential trading opportunities that align with our strategy, and the price action confirms our outlook. While we won’t reveal all details here, the setup and our short-term forecast are visible on the chart provided. Stay tuned — execution levels and risk management remain key. Analysis by SarmayeDigital Team

stewdamus
Goatseus Maximus Hooves the Dust. Ready to Buck Up Soon!

Goatseus Maximus looks like an entry win here. Check out that long accumulation period. Bullish, or should I say, "GOATish"? Additionally, I have a signal to buy from my proprietary indicator. I will be a bit more aggressive on this one with a 1:4 rrr, targeting around .16 cents and stopping out at around .07. On this one, I may sell half a little earlier. Once we reach that ascending trendline, I will be watching price action closely. Keep an eye on my trade tracker for more.
Disclaimer
Any content and materials included in Sahmeto's website and official communication channels are a compilation of personal opinions and analyses and are not binding. They do not constitute any recommendation for buying, selling, entering or exiting the stock market and cryptocurrency market. Also, all news and analyses included in the website and channels are merely republished information from official and unofficial domestic and foreign sources, and it is obvious that users of the said content are responsible for following up and ensuring the authenticity and accuracy of the materials. Therefore, while disclaiming responsibility, it is declared that the responsibility for any decision-making, action, and potential profit and loss in the capital market and cryptocurrency market lies with the trader.