
FTT
FTX Token
| تریدر | نوع سیگنال | حد سود/ضرر | زمان انتشار | مشاهده پیام |
|---|---|---|---|---|
No results found. | ||||
Price Chart of FTX Token
سود 3 Months :
سیگنالهای FTX Token
Filter
Sort messages by
Trader Type
Time Frame

A_R_T_vs_A_R_T
FTX/USDT - LONG

A project that requires a significant amount of time, about five years. This post is more relevant than ever. The FTX project deserves your attention in the next 5-6 months. After that, focus on other matters. (This is not an investment recommendation).

FTT – Potential Reversal Structure 2$->8$
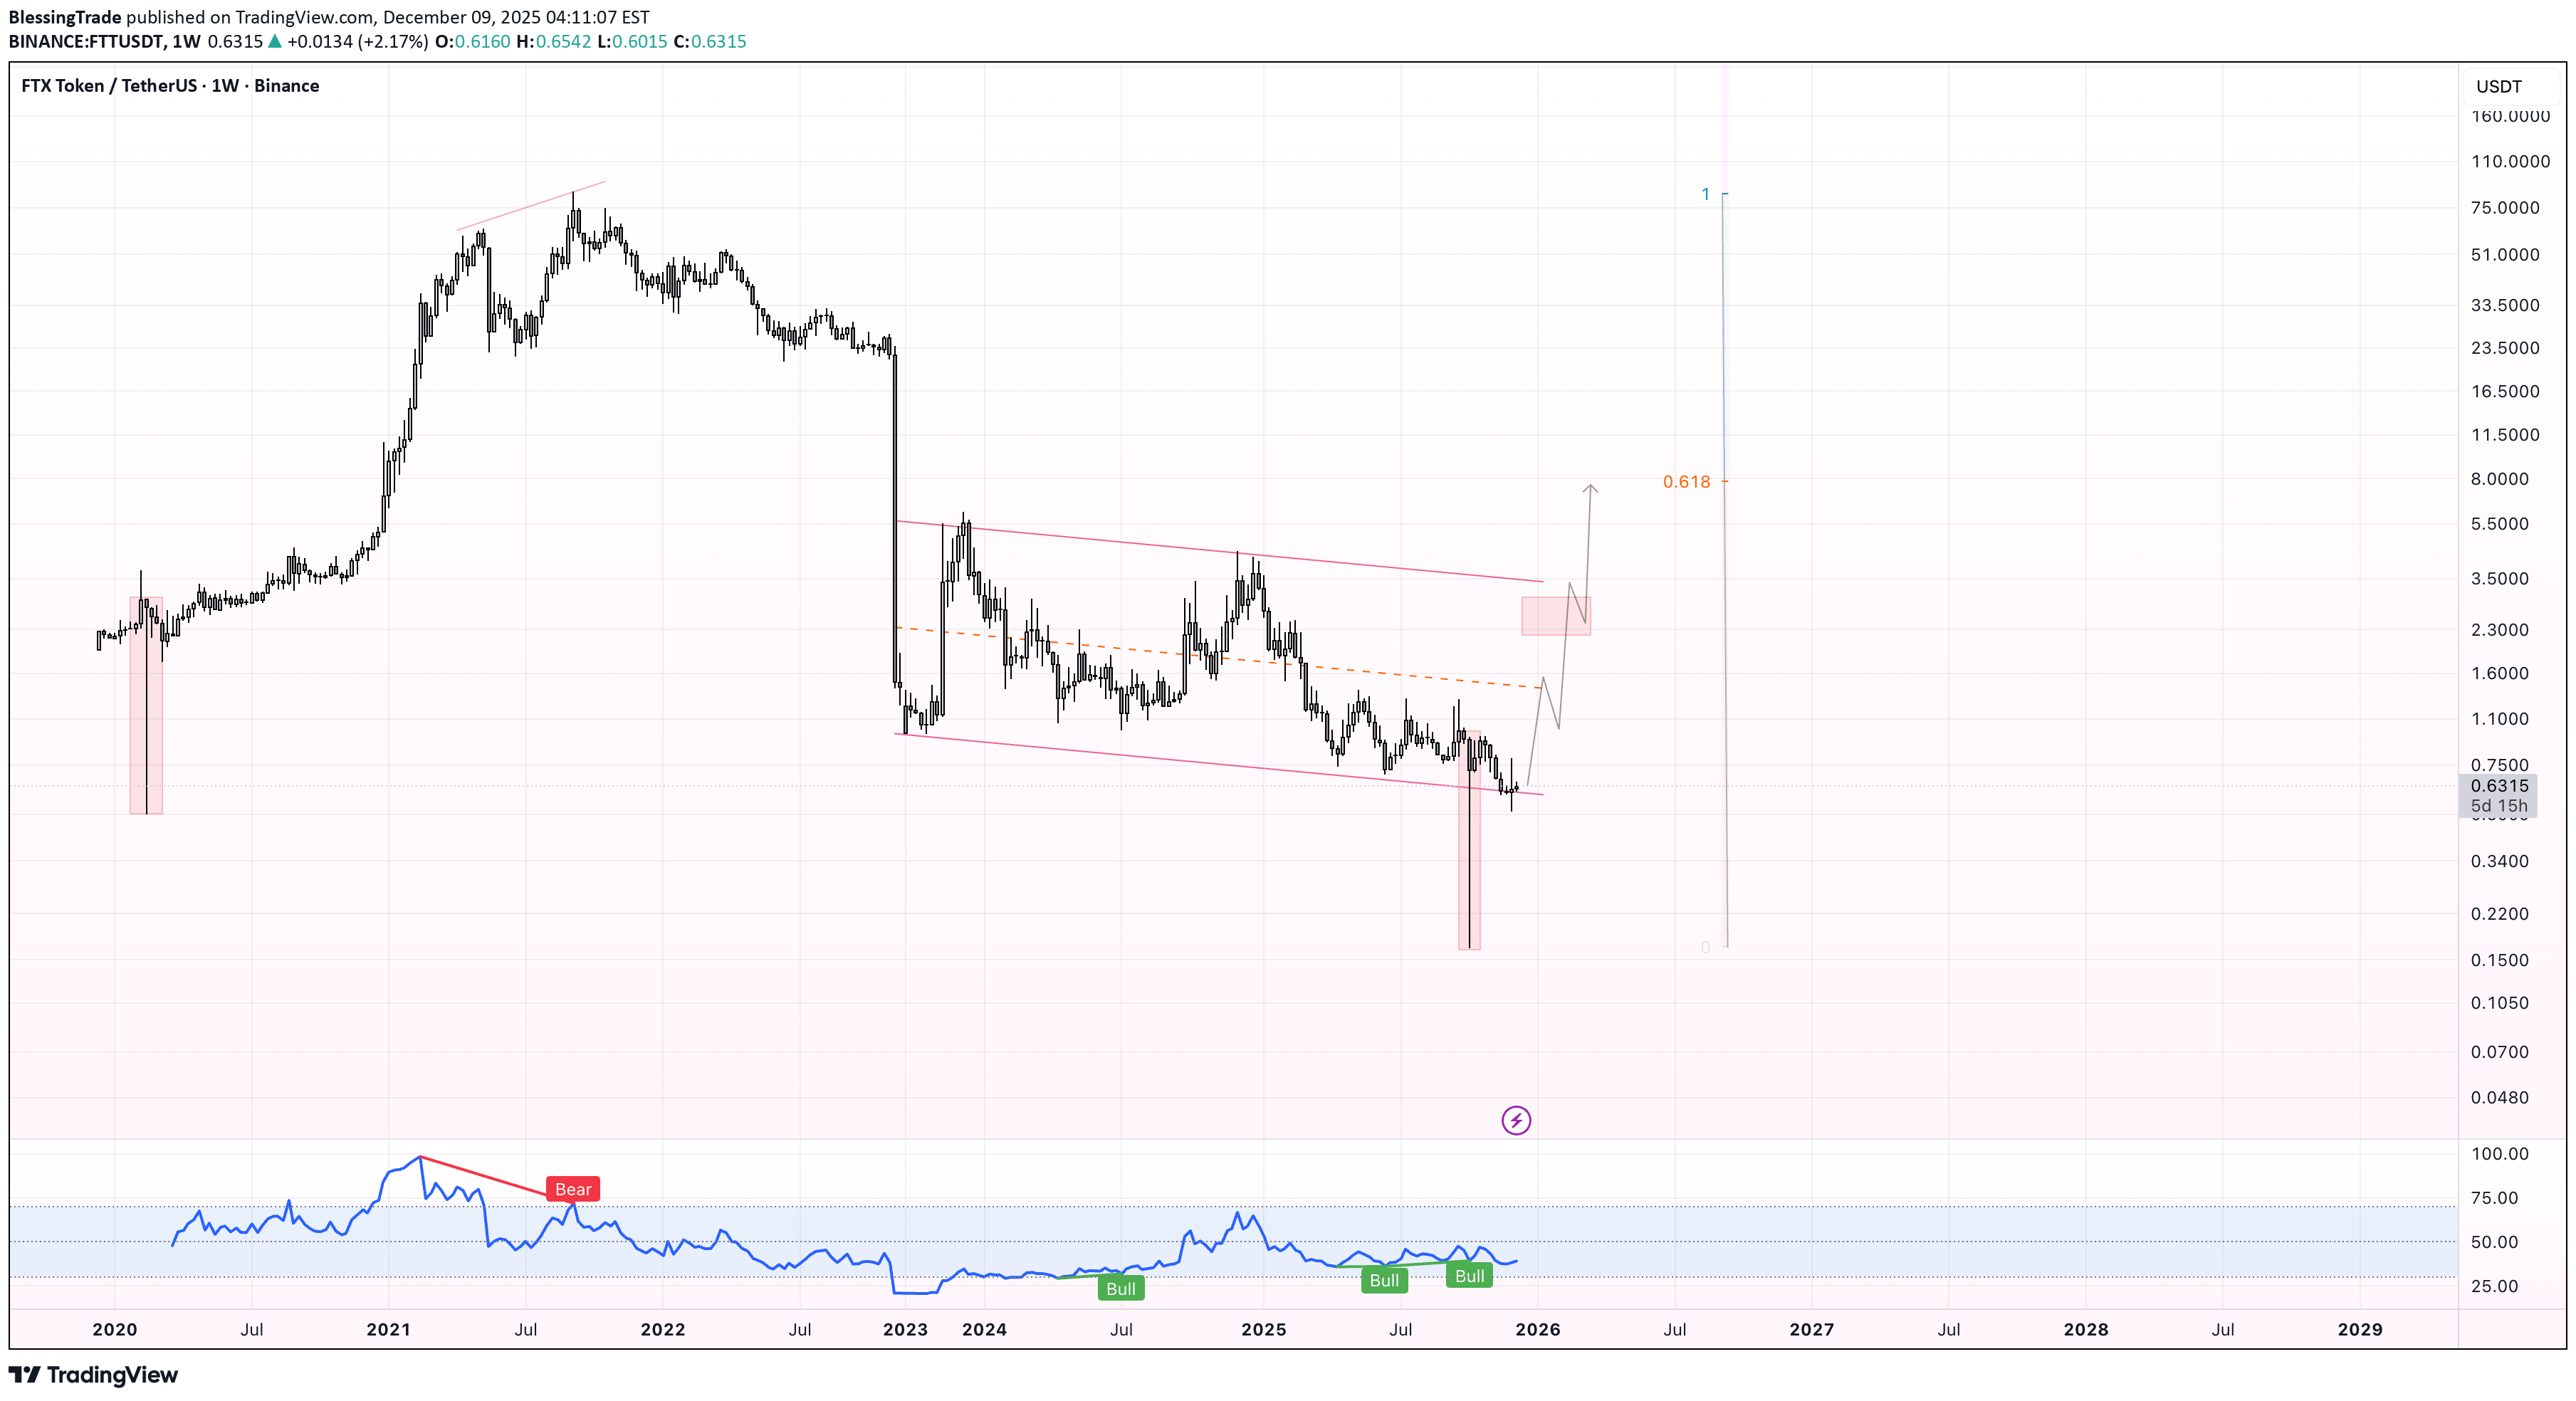
The chart shows a clear bullish divergence forming on the weekly timeframe, which aligns with the structure seen during the major 2020 shakeout. Once again, the price was pushed below the long-term descending channel, triggering an aggressive stop-hunt before quickly reclaiming the range — a classic deviation pattern. If the asset still hasn’t been delisted despite everything that happened, it suggests that there may be underlying reasons for keeping the token alive. Markets often move ahead of headlines, so a sudden fundamental catalyst shouldn’t be ruled out. Some traders even speculate about potential legal or regulatory news related to the former FTX leadership, which could shock the market if it appears unexpectedly. Whether this materializes or not, the technical structure alone remains notable. From a TA perspective: Price has printed a bullish divergence on the weekly RSI. A long-term falling channel remains intact, with price bouncing off its lower boundary. A shakeout similar to 2020 may have cleared late sellers and leveraged shorts. If momentum continues, the first target zone sits around $2–3, aligning with local resistance. The main structural target is a retest of the 0.618 Fibonacci retracement of the major decline from $8 — a level that often acts as a magnet in recovery phases. This setup remains speculative and highly volatile, but the technical picture suggests a potential medium-term relief rally if the market continues to absorb sell pressure.

Bithereum_io
پیشبینی انفجار قیمت FTT: آیا این الگوی نموداری طلسم شده است؟

#FTT is moving inside a falling wedge pattern on the daily chart. It has just bounced off the wedge support. In case of a breakout above the pattern resistance, the potential targets are: 🎯 $0.9398 🎯 $1.2029 🎯 $1.4155 🎯 $1.6281 🎯 $1.9309 ❌ Invalidation: a daily candle closing below the wedge. ⚠️ Always remember to use a tight stop-loss and maintain proper risk management.

VIPROSE
آیا قیمت FTT به زودی سقف جدید میزند؟ پیشبینی صعود بزرگ پس از برخورد به منطقه طلایی
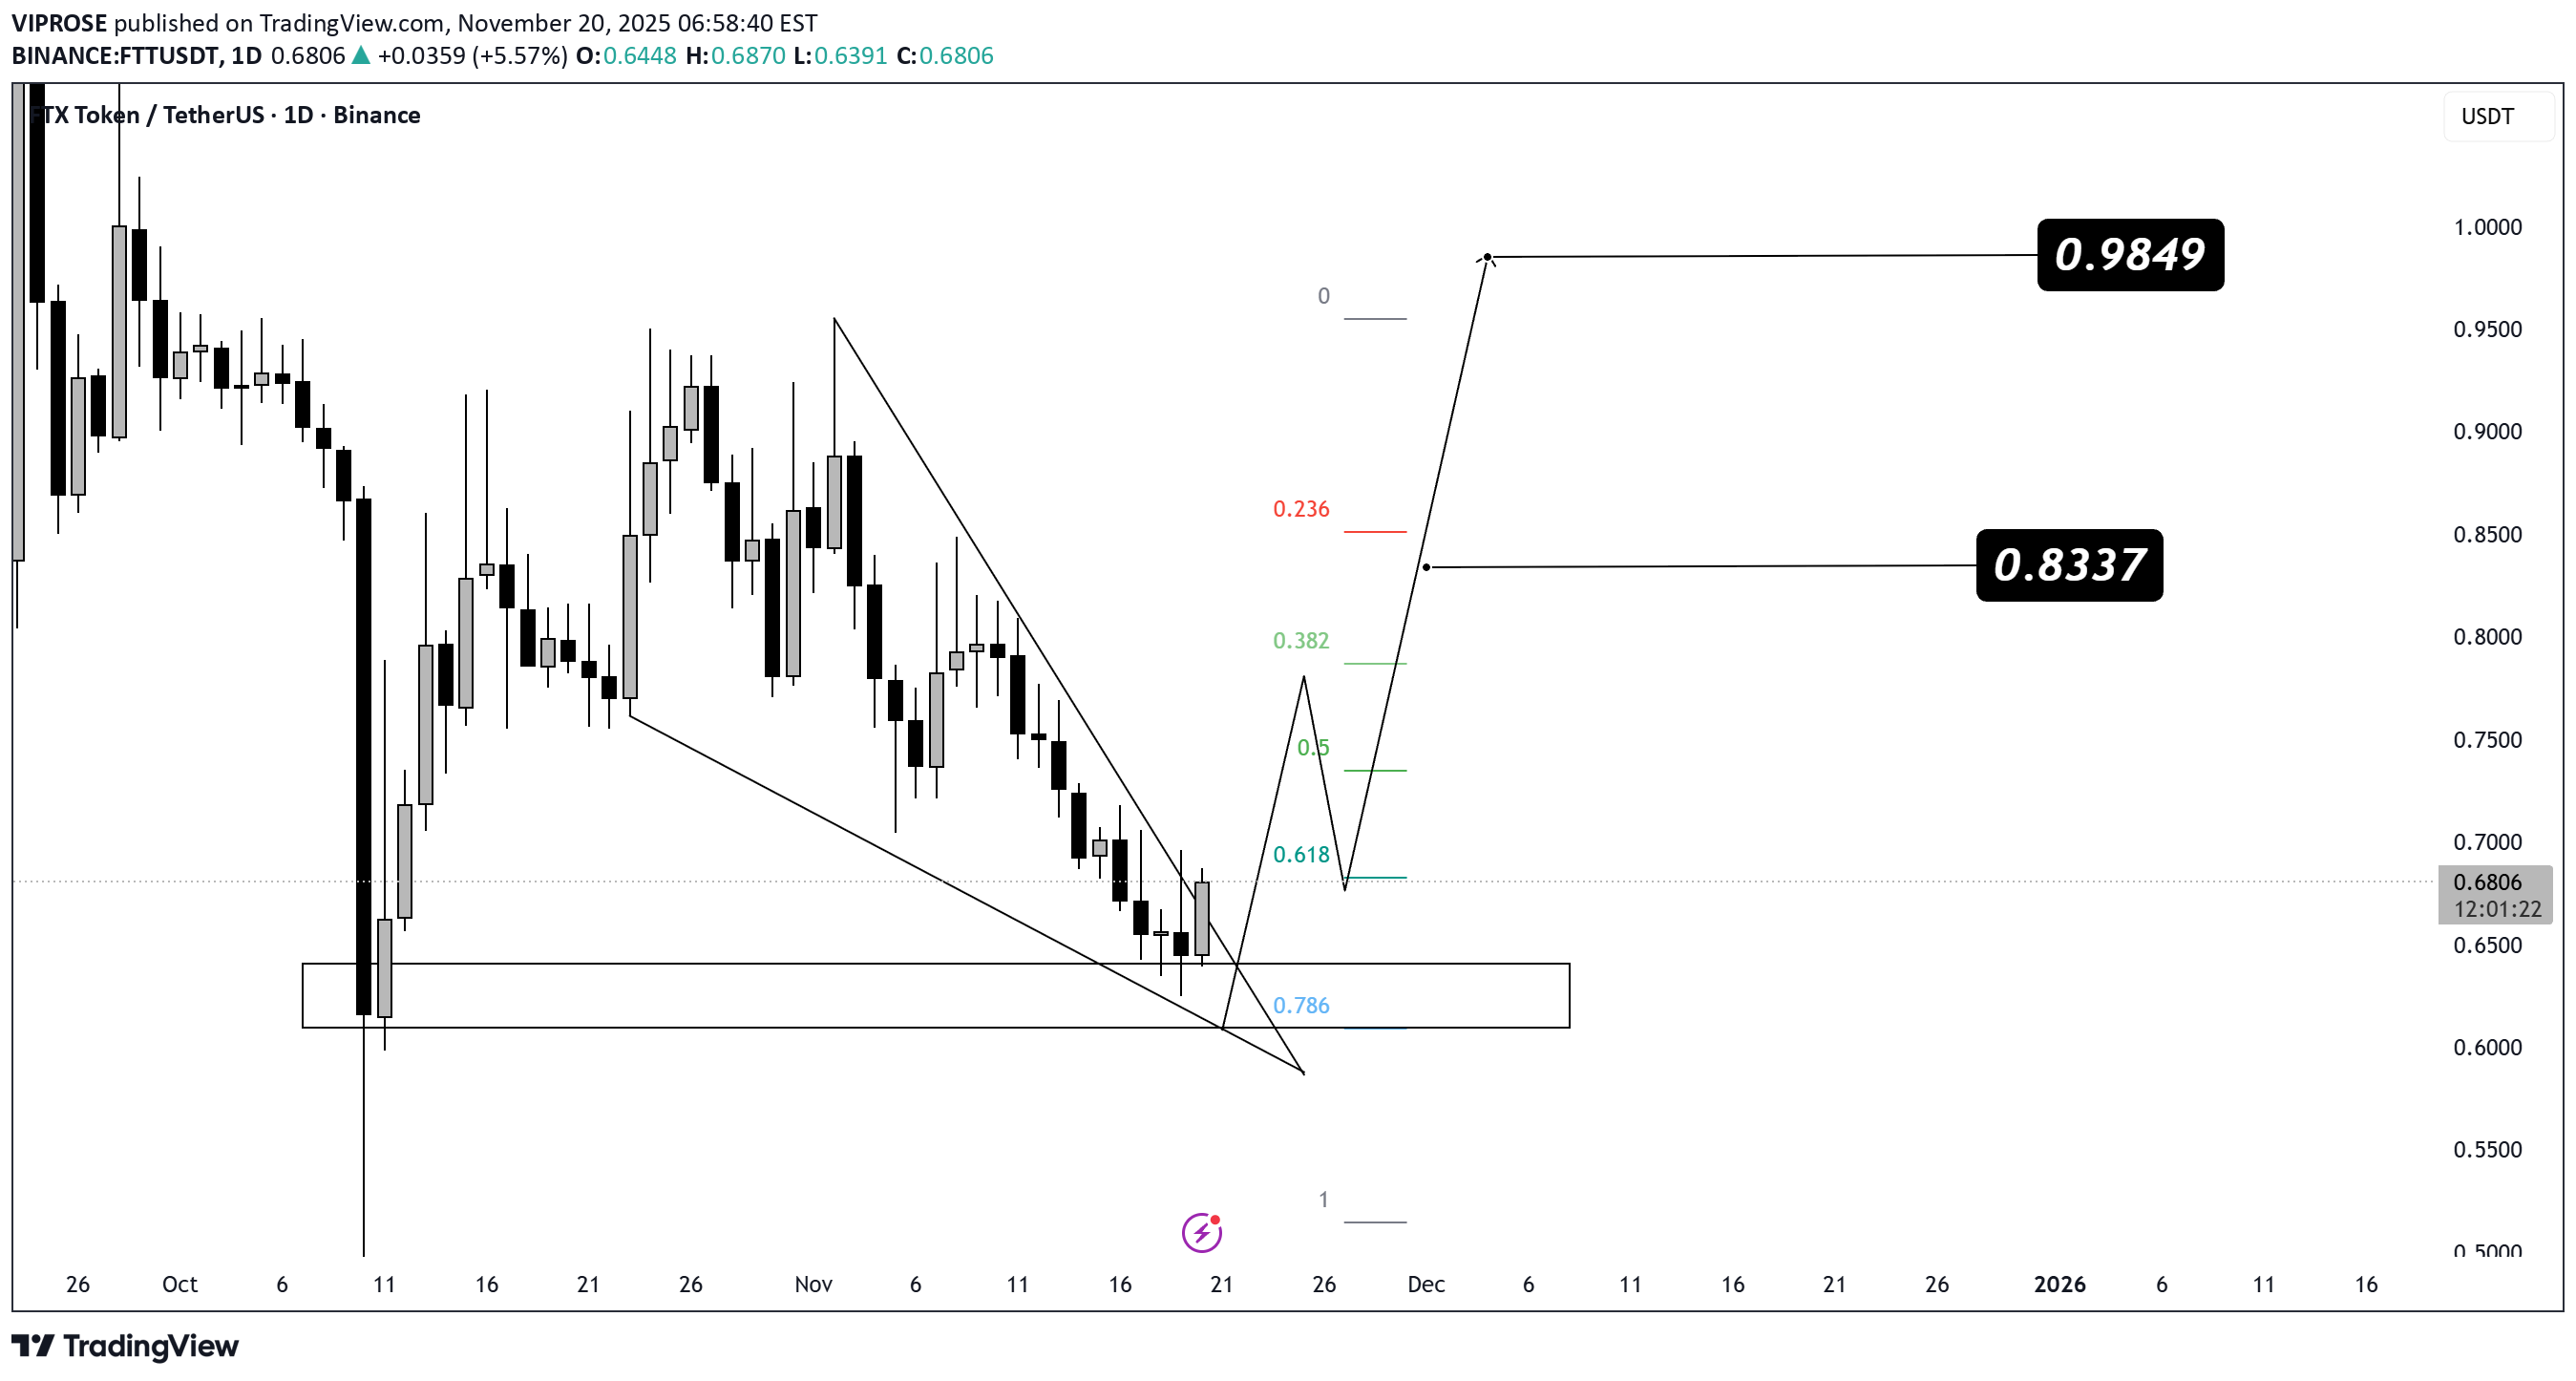
🔥 #FTT Update : FTT is moving inside a falling wedge, and it has just tapped a very strong demand zone near the 0.786 Fibonacci level — a classic area for big reversals. First bounce target: $0.8337 Main upside target: $0.9849 As long as FTT holds above the marked demand zone, a bullish reversal is the most likely outcome 📈🔥

CryptoNuclear
آخرین فرصت خرید FTT؟ منطقه حیاتی که تعیینکننده صعود بزرگ بعدی است!
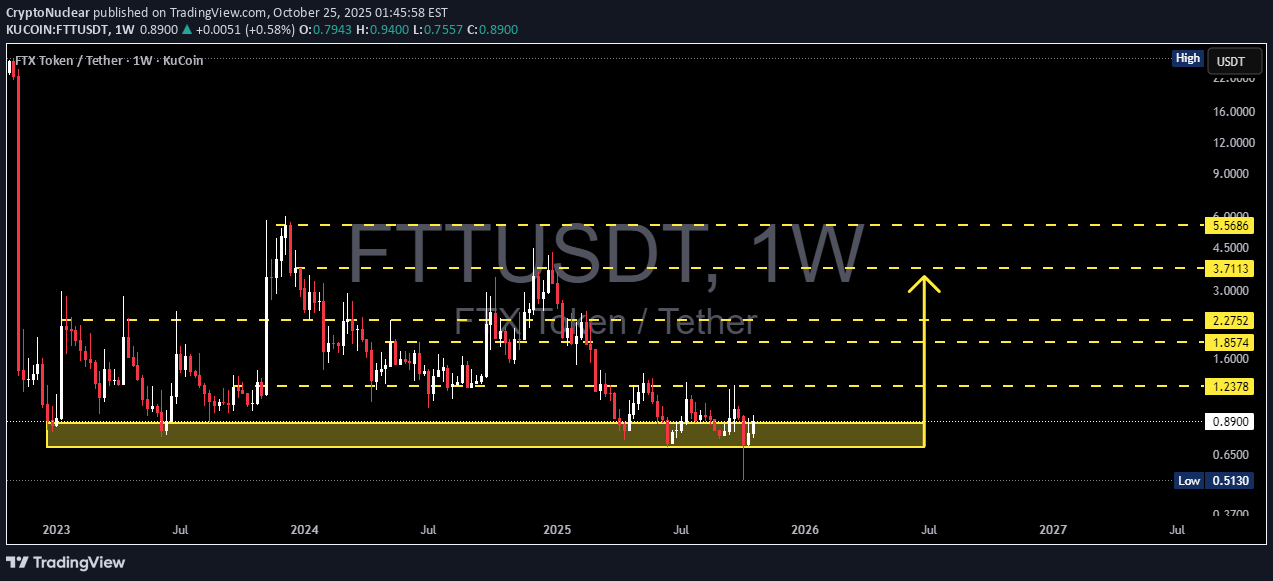
FTT’s price is once again testing the critical support zone (0.88–0.70), which has served as the final stronghold for buyers for more than a year. Each touch of this area has triggered a bounce, yet the strength of each rebound has weakened over time — signaling consistent selling pressure from the upper levels. The lower-high structure formed since 2024 highlights medium-term bearish dominance. However, the most recent weekly candle closed back above the demand area after briefly dipping to 0.5130 — a strong indication of massive liquidity absorption from weak hands. This suggests that the yellow zone is not just a technical support level, but rather a psychological battlefield between capitulating sellers and silent accumulators. --- Technical Structure and Pattern A Range Base Pattern has formed at the bottom, where price remains trapped between the 1.23 supply zone and the 0.88–0.70 demand area. A False Breakdown (Spring Phase) is clearly visible — potentially marking the beginning of a re-accumulation phase. However, as long as the price fails to break and close above 1.2378, the overall structure remains neutral with a bearish bias. --- Bullish Scenario If FTT successfully breaks and closes above 1.2378 on the weekly timeframe, it could signal a medium-term trend reversal. Layered upside targets could extend toward: 1.8574 → 2.2752 → 3.7113 → 5.5686 A confirmed breakout above 1.23 would also mark the transition from a distribution phase to a bullish expansion phase, opening room for a potential recovery rally similar to the one seen in 2023–2024. --- Bearish Scenario However, if selling pressure intensifies and the weekly candle closes below 0.70, it would confirm a loss of structural support, opening the door to a deeper downside move. A breakdown below 0.70 could drive price toward the extreme liquidity zone below 0.35, where new buyers might emerge for a possible long-term bottom reaccumulation. --- Conclusion FTT currently stands at the most critical equilibrium zone in its historical price action. Each weekly candle in this area carries the potential for a major reaction — either as the beginning of a new recovery, or the final descent before long-term restructuring. Momentum is building quietly. Those who hold through this zone might witness the early stages of a major shift, while latecomers may only watch the rebound from afar. --- #FTT #FTTUSDT #CryptoAnalysis #MarketStructure #SwingSetup #WeeklyChart #AltcoinAnalysis #AccumulationZone #BreakoutWatch #LiquiditySweep #CryptoTechnicalAnalysis

Alpha-GoldFX
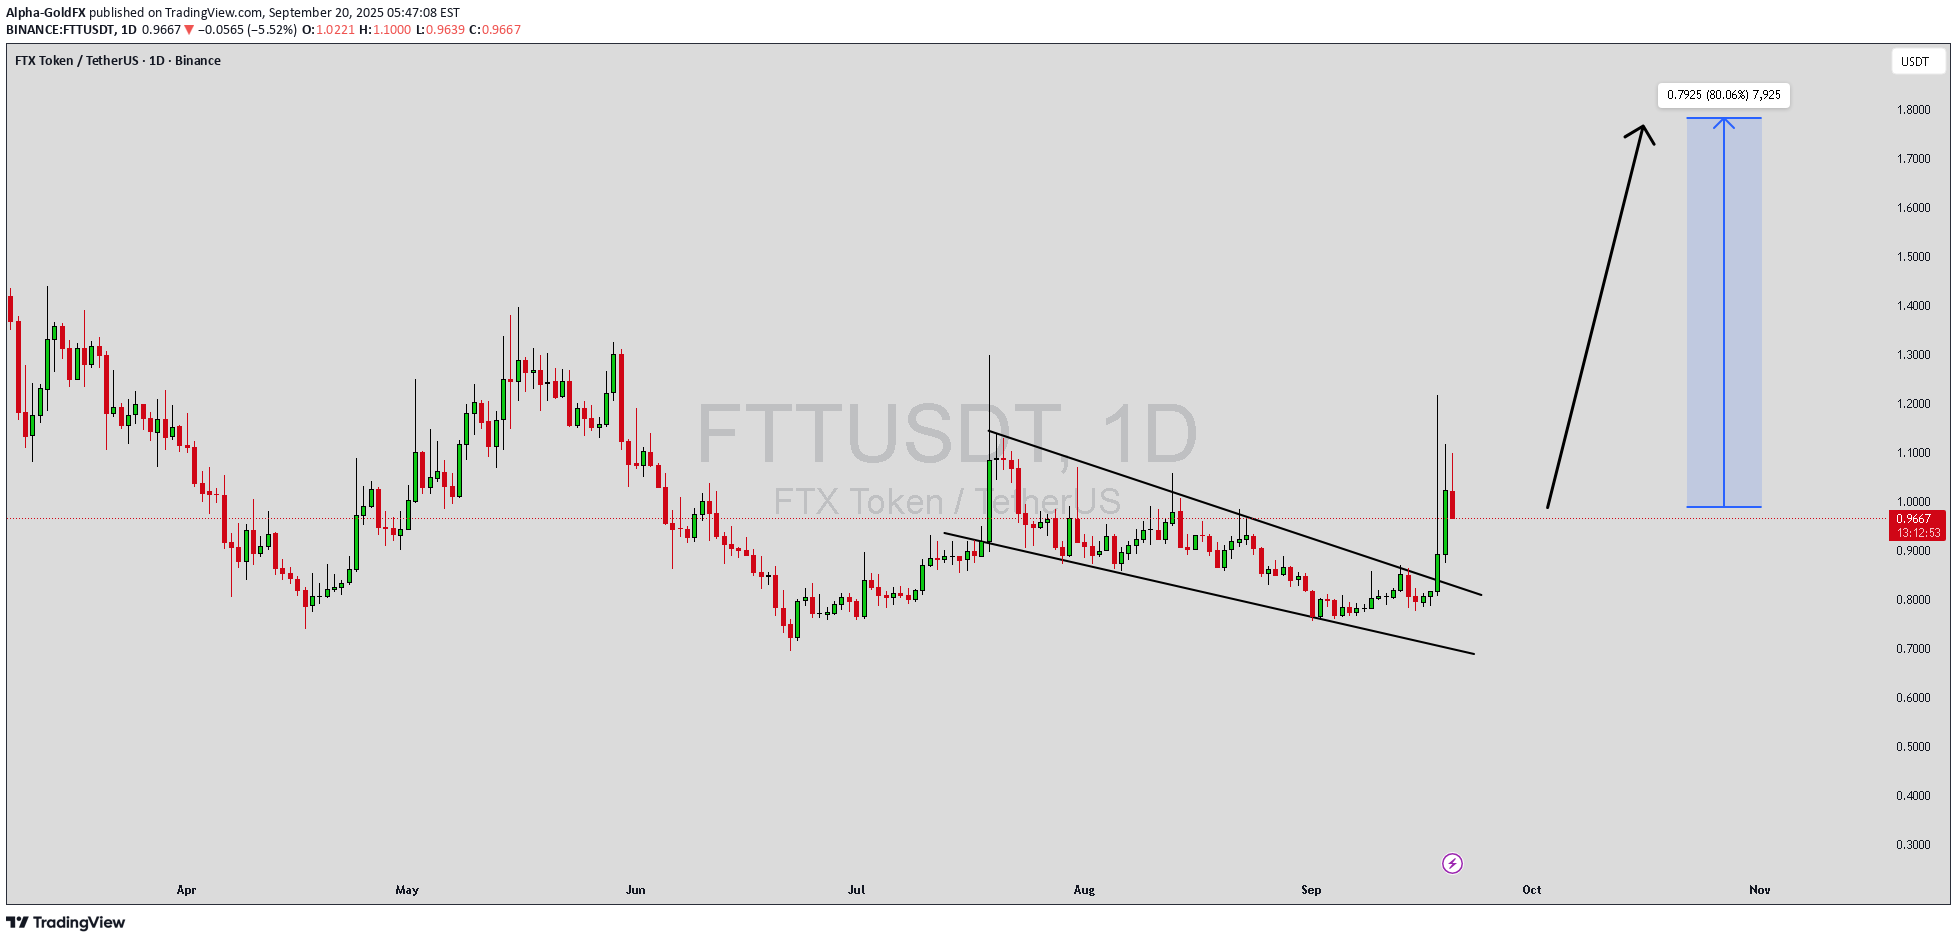
فرصت طلایی صعود ۹۰٪ در ارز FTTUSDT: راز الگوی گوه نزولی لو رفت!
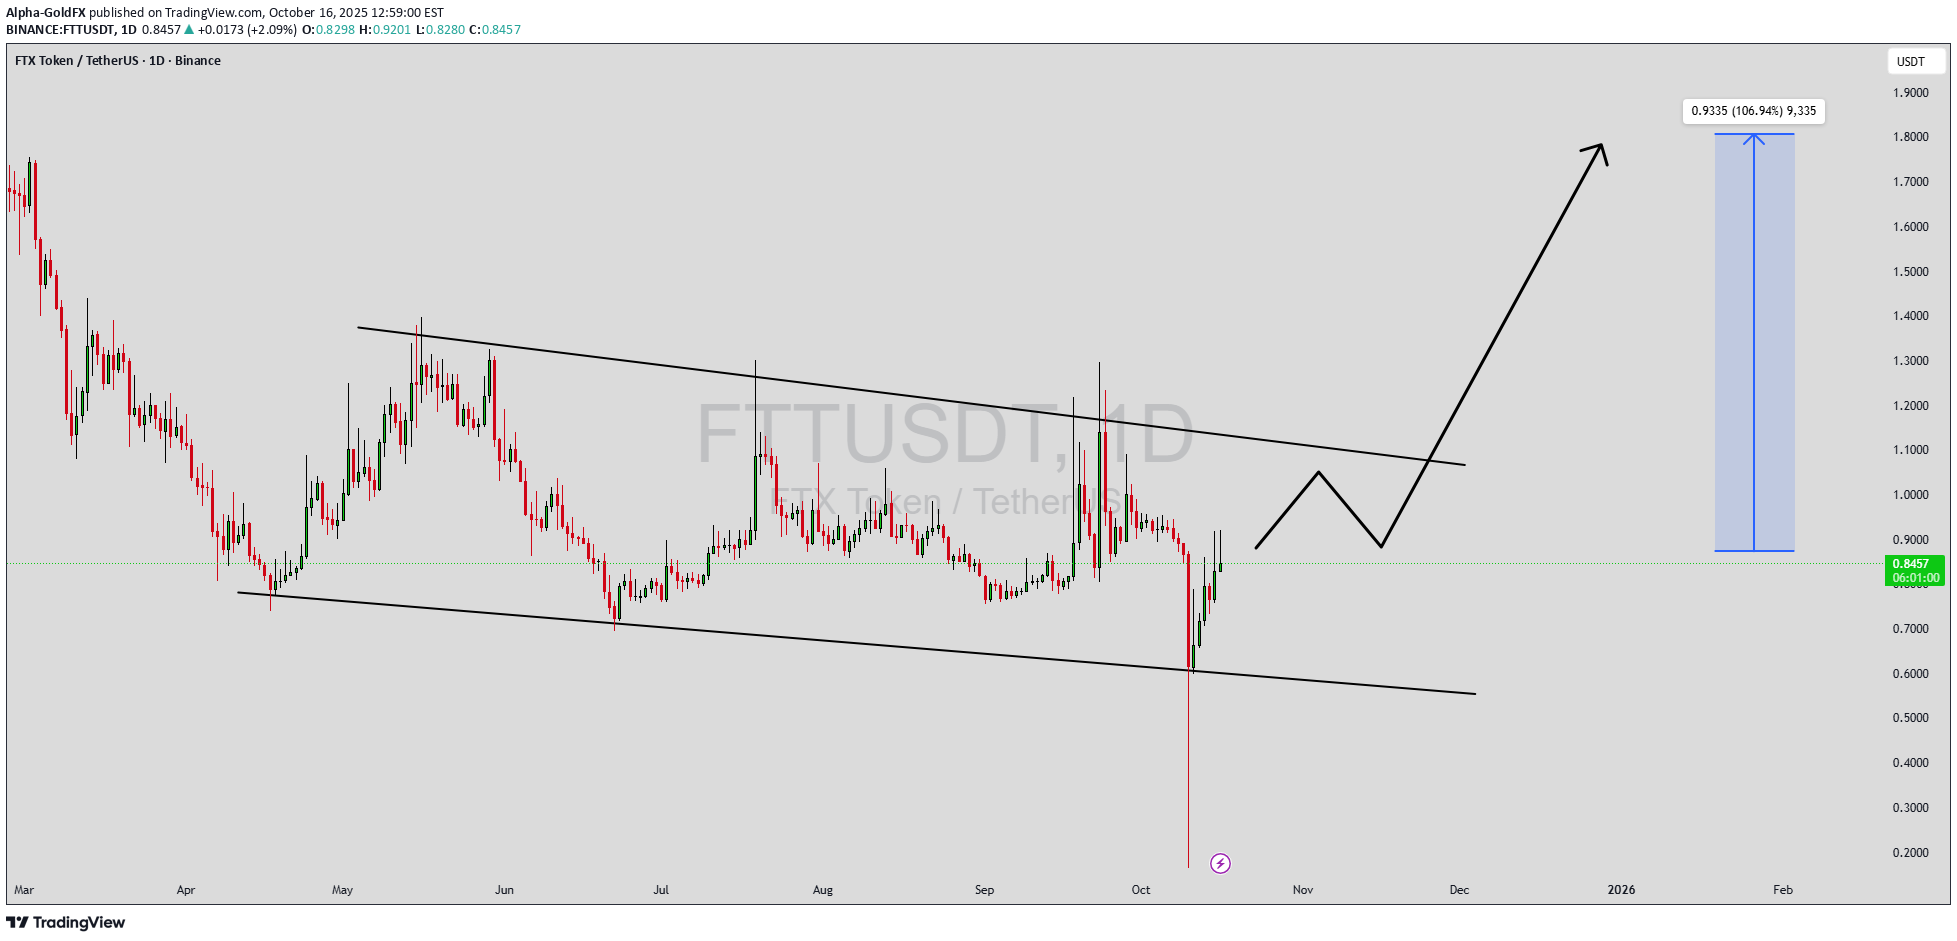
FTTUSDT is currently forming a falling wedge pattern, a bullish reversal setup that often signals a strong breakout ahead. This pattern indicates that selling pressure is fading, while buyers are gradually regaining control. The price has been consolidating within a narrowing range, and with good trading volume returning to the market, the setup looks primed for a potential breakout to the upside. If the momentum continues, a 90% to 100%+F gain could be achievable in the coming weeks. The falling wedge formation on FTTUSDT suggests that accumulation may already be underway, with smart money positioning early before the next major move. Once the resistance trendline is broken with strong volume confirmation, the pair could experience a surge in bullish momentum. Traders are closely monitoring this zone, as the breakout could mark the start of a fresh uptrend, reversing the previous downtrend that dominated the chart. Investor interest in FTTUSDT has been steadily growing as optimism returns to the broader crypto market. Technical indicators are showing encouraging signs, with volume expansion hinting at increased participation. If market sentiment remains positive, this setup could offer an excellent opportunity for swing and position traders aiming to capitalize on the next strong bullish leg. ✅ Show your support by hitting the like button and ✅ Leaving a comment below! (What is You opinion about this Coin) Your feedback and engagement keep me inspired to share more insightful market analysis with you!

CryptoWithJames
پیشبینی انفجاری FTT: هدف جدید ۶۰٪ صعودی در این الگوی قیمتی!

#FTT UPDATE FTT Technical Setup Pattern: Bullish falling wedge pattern Current Price: $0.870 Target Price: $1.523 Target % Gain: 60.73% FTT is breaking out of a bullish falling wedge pattern on the 1D timeframe. Current price is $0.870 with a potential target near $1.523, showing around 60% upside potential. The breakout suggests growing bullish pressure and possible continuation toward higher resistance levels. Time Frame: 1D Risk Management Tip: Always use proper risk management.

CryptoAnalystSignal
تحلیل تکنیکال FTT/USDT: نقشه راه صعودی با اهداف جذاب!

#FTT The price is moving within a descending channel on the 1-hour frame, adhering well to it, and is heading for a strong breakout and retest. We have a bearish trend on the RSI indicator that is about to be broken and retested, which supports the upward breakout. There is a major support area in green at 0.8890, representing a strong support point. We are heading for consolidation above the 100 moving average. Entry price: 0.9360 First target: 0.9681 Second target: 1.000 Third target: 1.0580 Don't forget a simple matter: capital management. When you reach the first target, save some money and then change your stop-loss order to an entry order. For inquiries, please leave a comment. Thank you.
Alpha-GoldFX
FTTUSDT Forming Falling Wedge
FTTUSDT is showing a falling wedge pattern, which is considered one of the strongest bullish reversal setups in technical analysis. This pattern often appears after a downtrend, where price narrows down between two converging trendlines, eventually leading to a breakout to the upside. With good trading volume supporting this structure, the technical outlook suggests that FTT could be preparing for a strong recovery rally. The expected gain of 70% to 80%+ makes this setup particularly attractive for traders watching for momentum-driven breakouts. A confirmed breakout above the wedge resistance could trigger a sharp move higher, allowing FTTUSDT to reclaim important price levels and potentially spark renewed investor confidence in the market. Investor interest is already building around this project, and the combination of bullish chart structure with positive sentiment adds to the probability of a breakout. If volume continues to support the move, the upward momentum could accelerate, making FTTUSDT a coin to keep on close watch. ✅ Show your support by hitting the like button and ✅ Leaving a comment below! (What is You opinion about this Coin) Your feedback and engagement keep me inspired to share more insightful market analysis with you!

TheHunters_Company
FTT BUY!!!
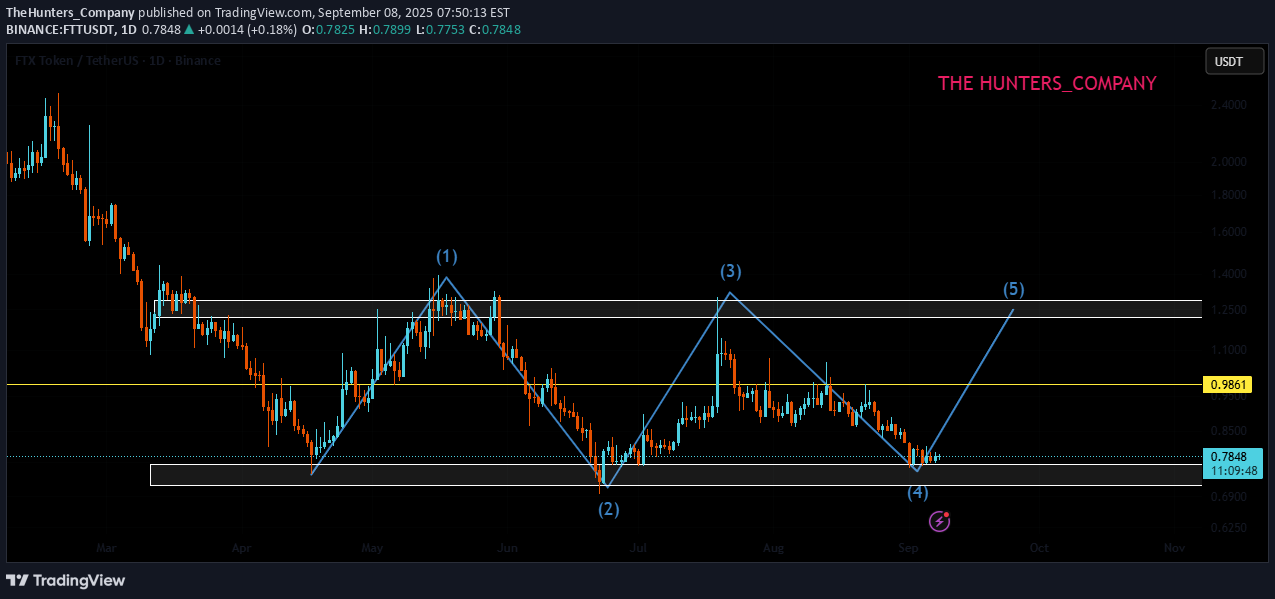
Hello friends According to the market cycle that has been drawn for you, from here according to the cycle we expect a return to the ceiling. *Trade safely with us*
Disclaimer
Any content and materials included in Sahmeto's website and official communication channels are a compilation of personal opinions and analyses and are not binding. They do not constitute any recommendation for buying, selling, entering or exiting the stock market and cryptocurrency market. Also, all news and analyses included in the website and channels are merely republished information from official and unofficial domestic and foreign sources, and it is obvious that users of the said content are responsible for following up and ensuring the authenticity and accuracy of the materials. Therefore, while disclaiming responsibility, it is declared that the responsibility for any decision-making, action, and potential profit and loss in the capital market and cryptocurrency market lies with the trader.