Technical analysis by CryptoNuclear about Symbol FTT: Buy recommendation (10/25/2025)

CryptoNuclear
آخرین فرصت خرید FTT؟ منطقه حیاتی که تعیینکننده صعود بزرگ بعدی است!
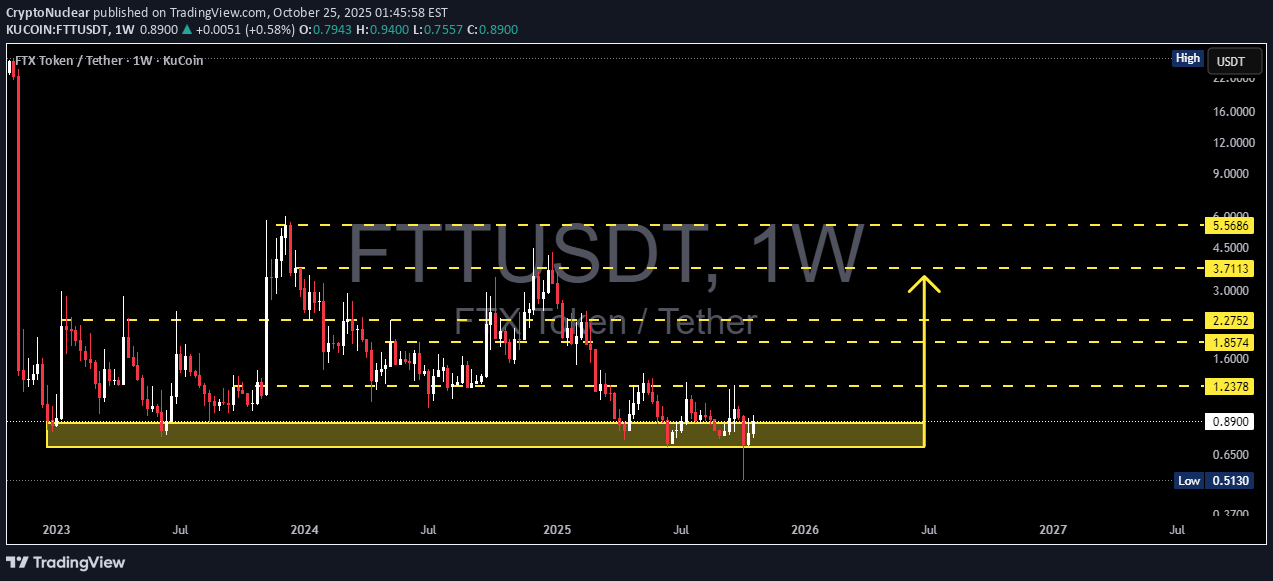
FTT’s price is once again testing the critical support zone (0.88–0.70), which has served as the final stronghold for buyers for more than a year. Each touch of this area has triggered a bounce, yet the strength of each rebound has weakened over time — signaling consistent selling pressure from the upper levels. The lower-high structure formed since 2024 highlights medium-term bearish dominance. However, the most recent weekly candle closed back above the demand area after briefly dipping to 0.5130 — a strong indication of massive liquidity absorption from weak hands. This suggests that the yellow zone is not just a technical support level, but rather a psychological battlefield between capitulating sellers and silent accumulators. --- Technical Structure and Pattern A Range Base Pattern has formed at the bottom, where price remains trapped between the 1.23 supply zone and the 0.88–0.70 demand area. A False Breakdown (Spring Phase) is clearly visible — potentially marking the beginning of a re-accumulation phase. However, as long as the price fails to break and close above 1.2378, the overall structure remains neutral with a bearish bias. --- Bullish Scenario If FTT successfully breaks and closes above 1.2378 on the weekly timeframe, it could signal a medium-term trend reversal. Layered upside targets could extend toward: 1.8574 → 2.2752 → 3.7113 → 5.5686 A confirmed breakout above 1.23 would also mark the transition from a distribution phase to a bullish expansion phase, opening room for a potential recovery rally similar to the one seen in 2023–2024. --- Bearish Scenario However, if selling pressure intensifies and the weekly candle closes below 0.70, it would confirm a loss of structural support, opening the door to a deeper downside move. A breakdown below 0.70 could drive price toward the extreme liquidity zone below 0.35, where new buyers might emerge for a possible long-term bottom reaccumulation. --- Conclusion FTT currently stands at the most critical equilibrium zone in its historical price action. Each weekly candle in this area carries the potential for a major reaction — either as the beginning of a new recovery, or the final descent before long-term restructuring. Momentum is building quietly. Those who hold through this zone might witness the early stages of a major shift, while latecomers may only watch the rebound from afar. --- #FTT #FTTUSDT #CryptoAnalysis #MarketStructure #SwingSetup #WeeklyChart #AltcoinAnalysis #AccumulationZone #BreakoutWatch #LiquiditySweep #CryptoTechnicalAnalysis