
FRAX
Frax (prev. FXS)
| تریدر | نوع سیگنال | حد سود/ضرر | زمان انتشار | مشاهده پیام |
|---|---|---|---|---|
No results found. | ||||
Price Chart of Frax (prev. FXS)
سود 3 Months :
سیگنالهای Frax (prev. FXS)
Filter
Sort messages by
Trader Type
Time Frame

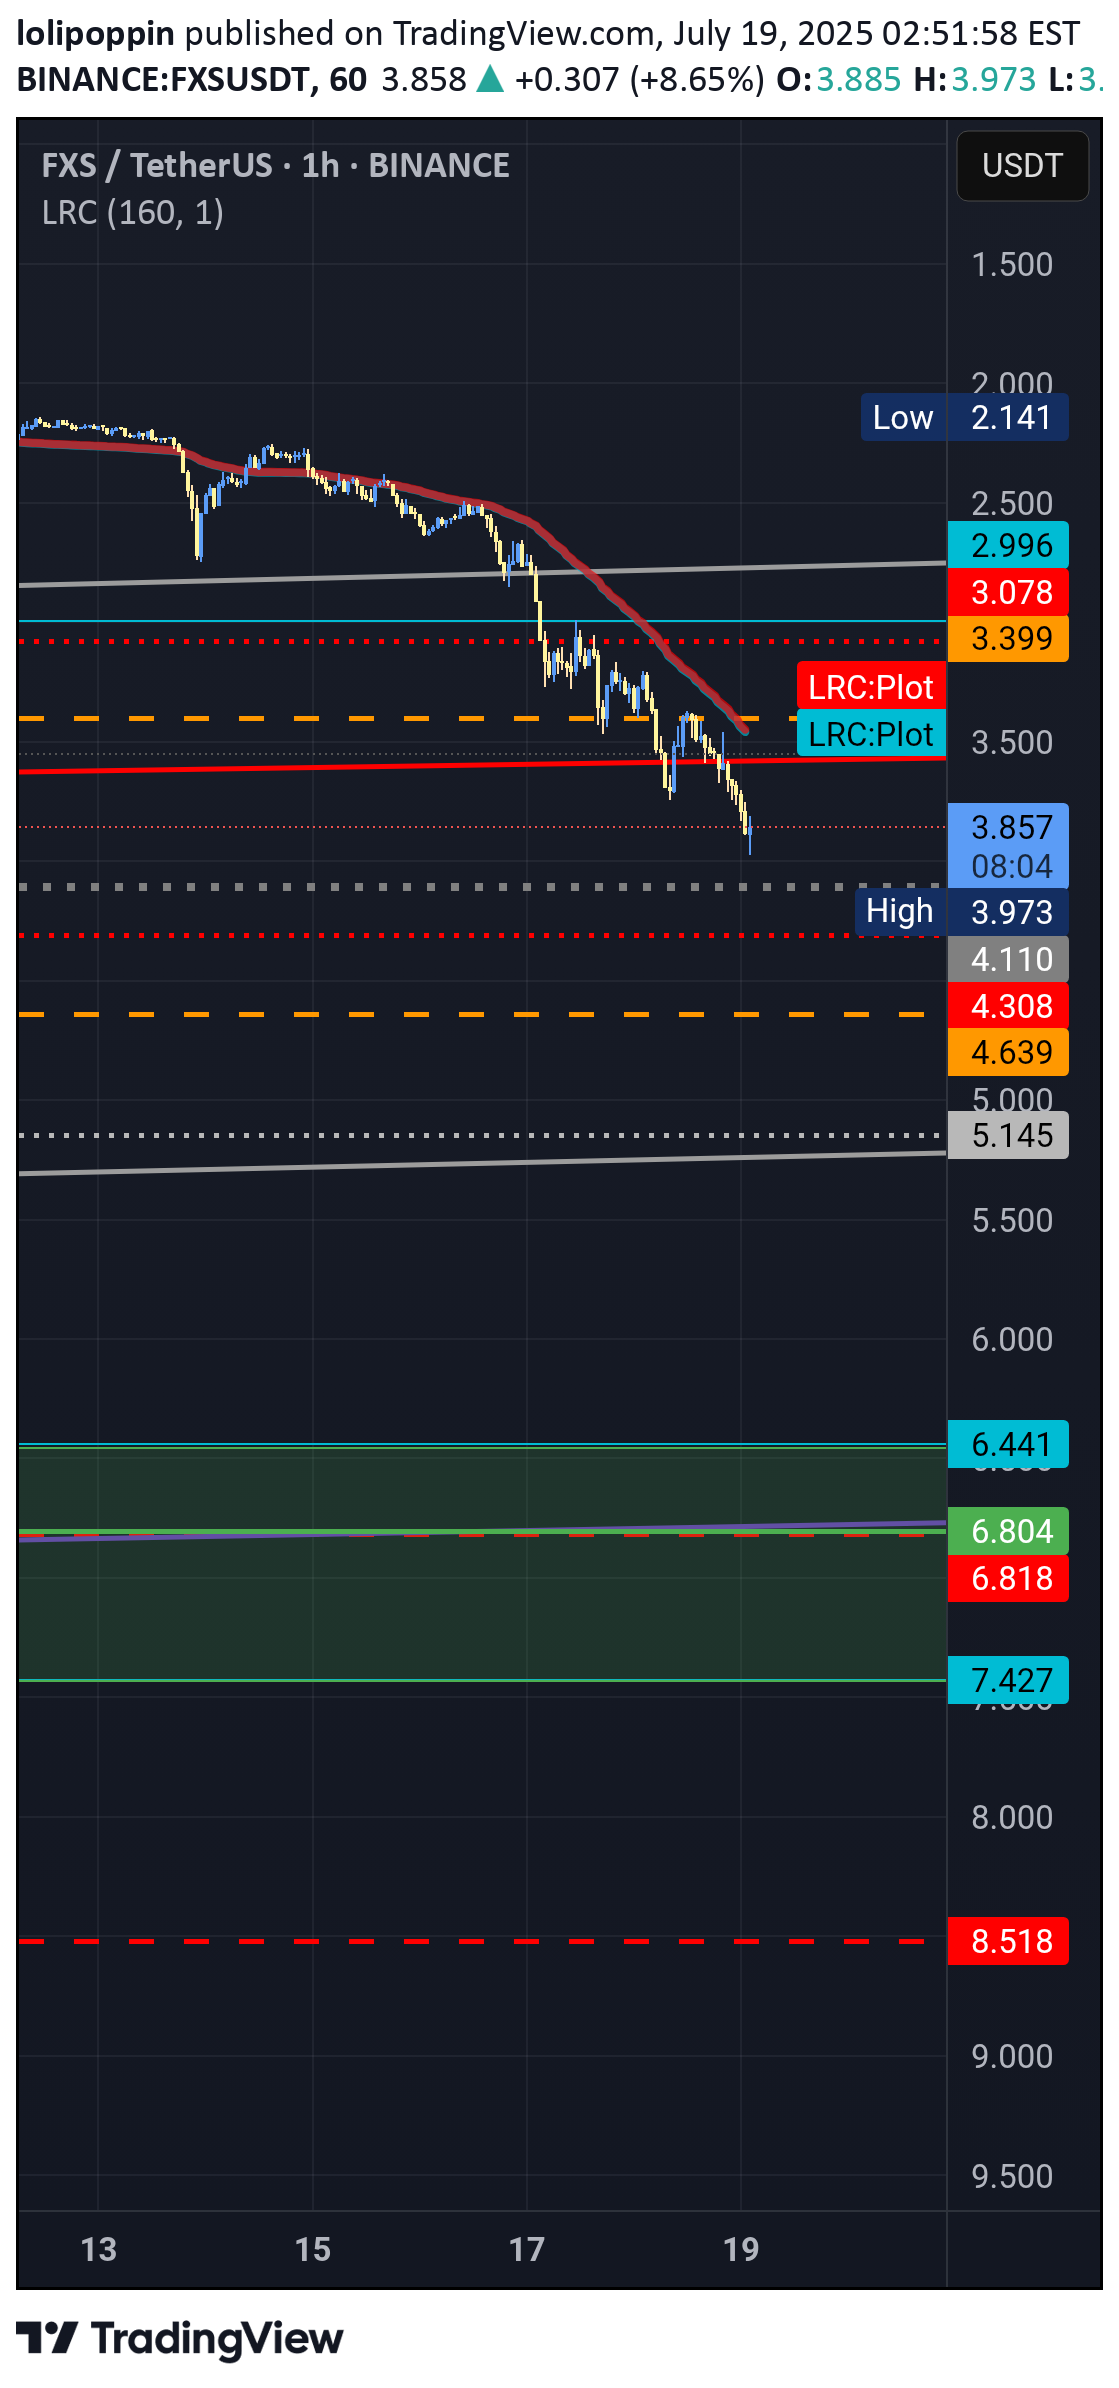
Nothing lasts forever, Not even this Idea
I would short now, but I'd also put my Stop-loss close, and my TP open, and shift my Stop-loss gradually. this position is risky, but hey no trade is too expensive when you are learning constantly, and acting accordingly.

lolipoppin
Bumpy road to 13$ (4$ - 5$ - 6$ - 7$)
According to the information available about #fxs and, market's overall situation which experienced knows about; the real worth for FXS is higher than these prices. The value increase for FXS will happen one way or another; but, the real question is... if it will be able to hold on to that price level or not? And, the answer to that lies on it's developers and, wether they'll be able to constantly improve this project and resolve future and remaining challenges and obstacles in this project and, develope it's potential to attract more investment, and keep their current investors.

MasterAnanda
Frax Share 1,104% Target Explained · Scam Wick & More
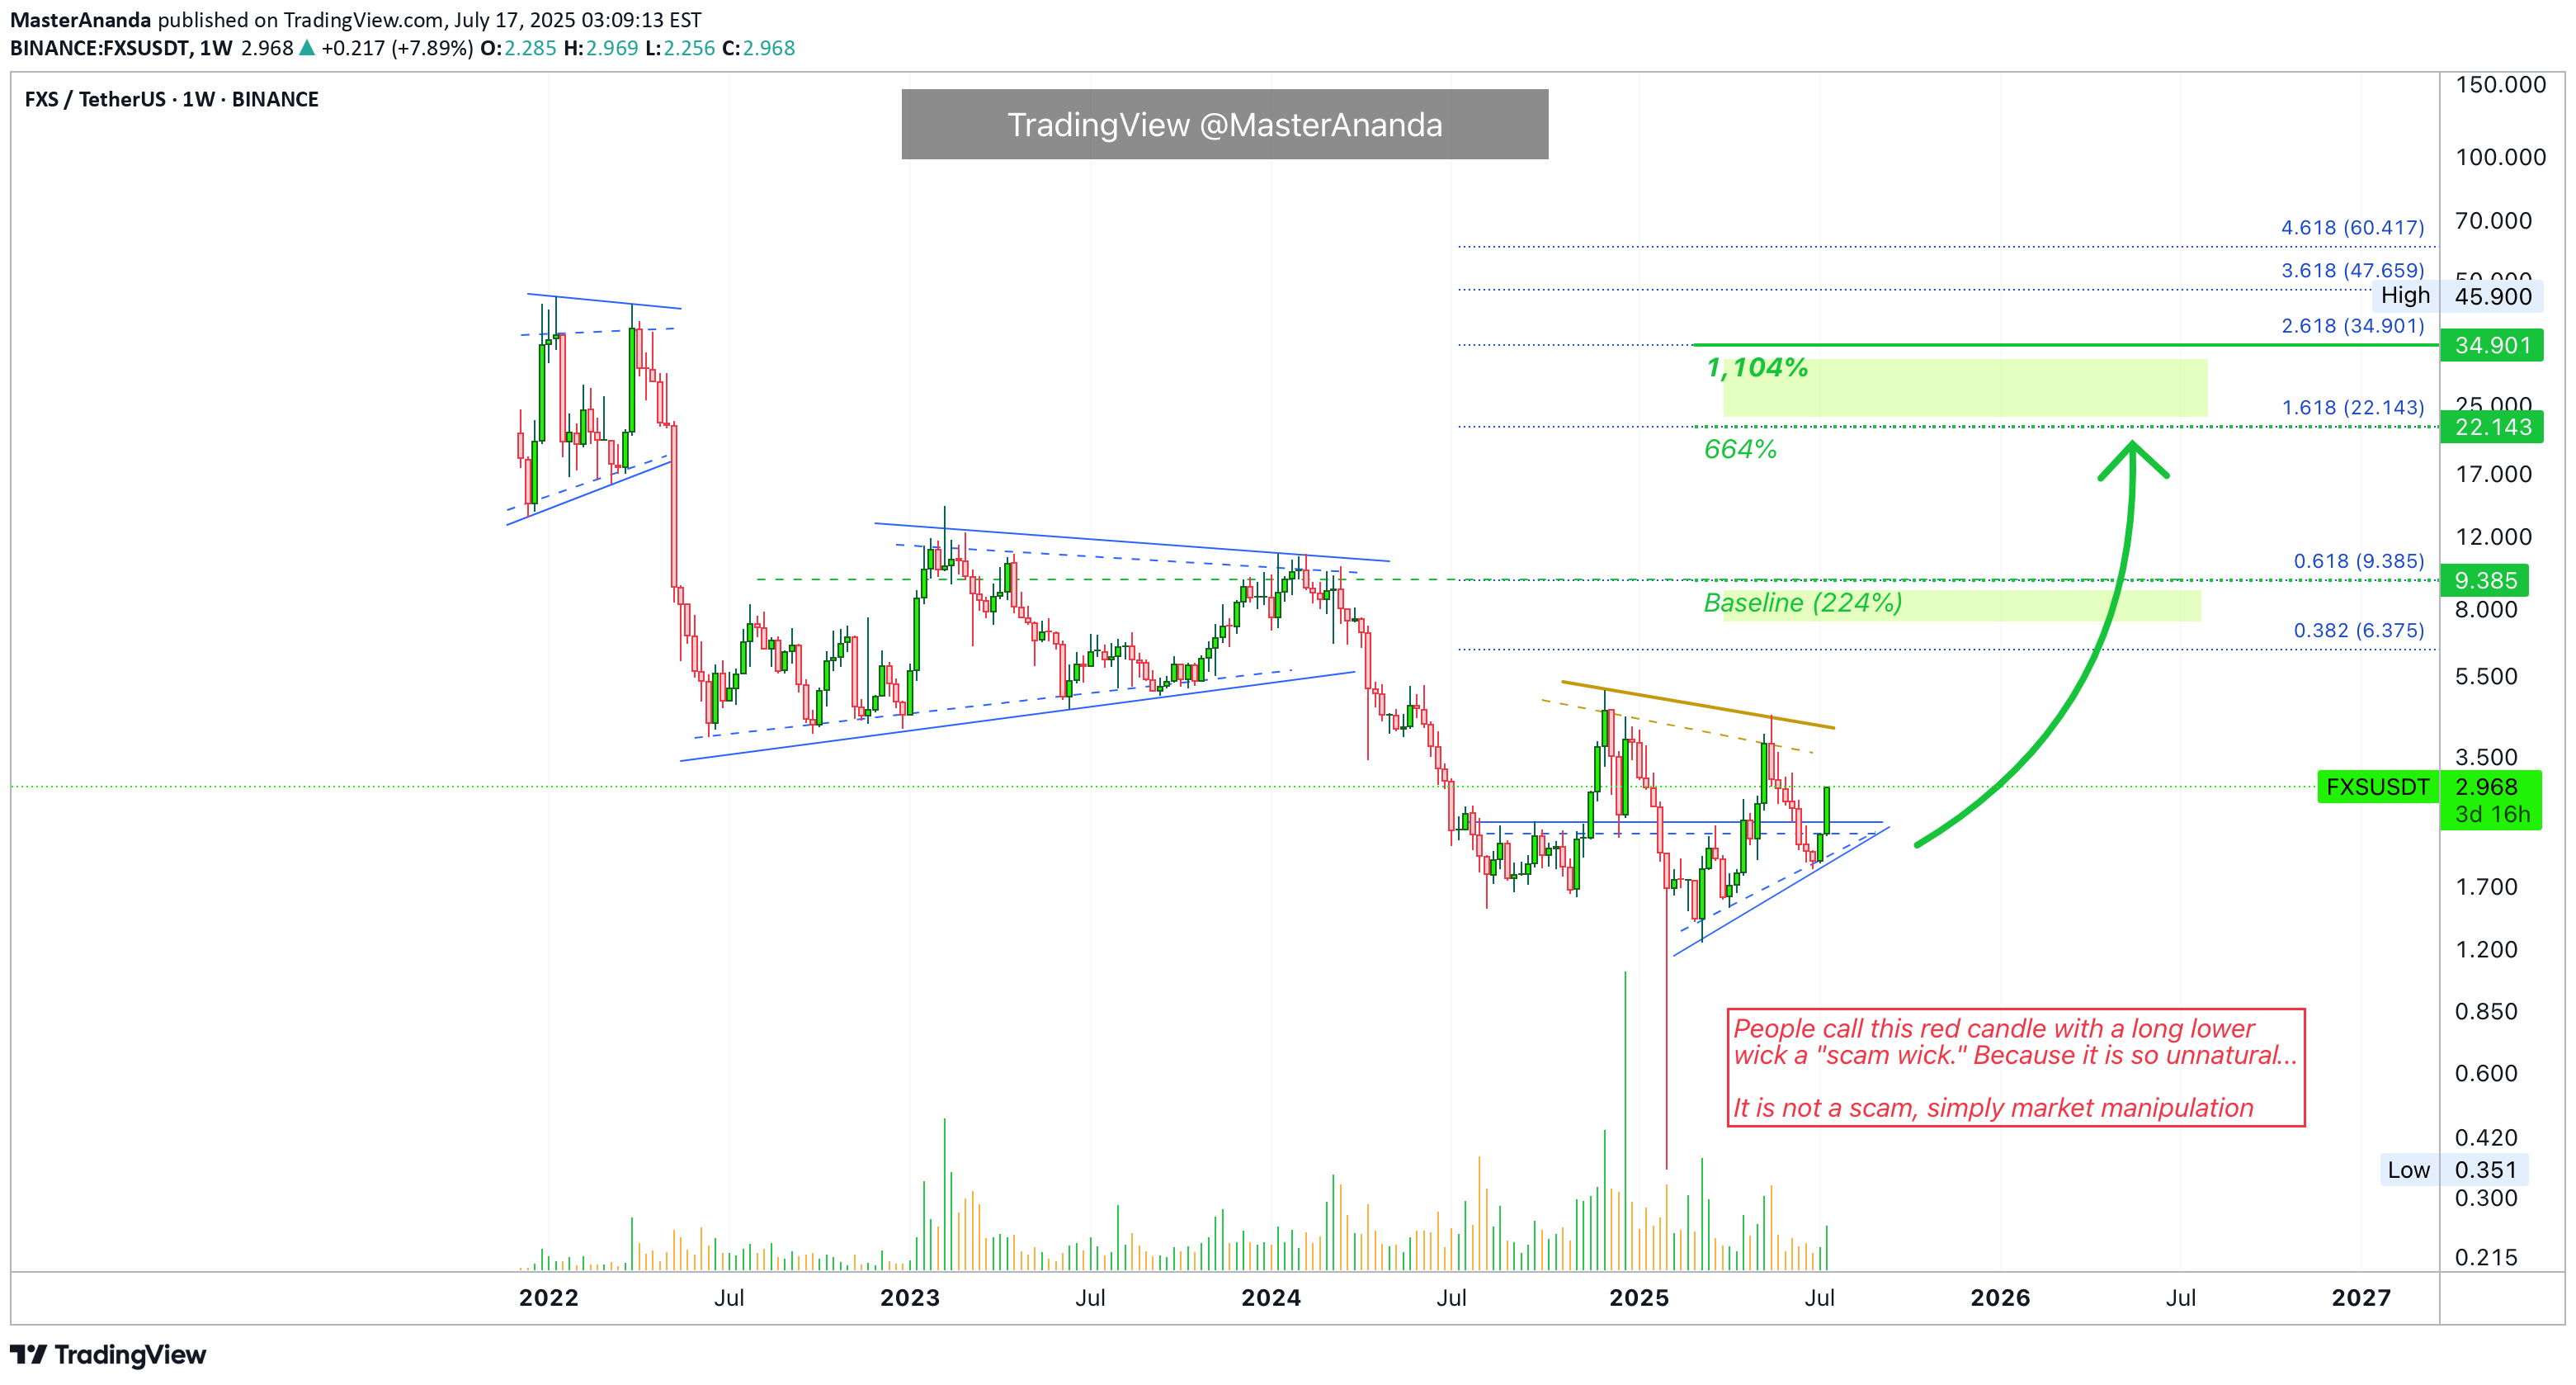
Frax Share is starting to recover with strong bullish momentum. The low for this pair was set 3-February with what many people call a "scam wick." Higher lows since. A higher low in March then again in April and June. Only a few pairs completed their lows in February and this is good. The scam wick was so strong that you can be certain there is no need for prices to go lower again. From now on, we can witness sustained long-term growth. The "back to baseline" level opens up an easy 224% potential profits. This is the level where you can say, "Ok, I want to triple this Bitcoin with very low risk." And it works like a charm because the action will end up much higher. This is the kind of move that cannot fail. We use spot of course as the whole strategy becomes a simple wait —buy and hold. The next target gives us 664% and requires the highest prices since May 2022, more than three years. This one is good but some resistance will need to be conquered to get there. The final target that is mapped on this chart opens 1,104%. This is a strong target but is also do-able. When all is set and done, we can end up with an even higher target. These are only conservative projections and hard to miss. I cannot say with a high level of certainty how far up Frax Share will go, the chart is a bit strange, but I can say with 100% level of certainty that we are entering a major bullish wave. 500% to 1,000% growth is an easy guess. Anything extra is welcomed and accepted. Thank you for reading. Namaste.

CryptoNuclear
FXS/USDT – Long-Term Accumulation Base Ready for Takeoff
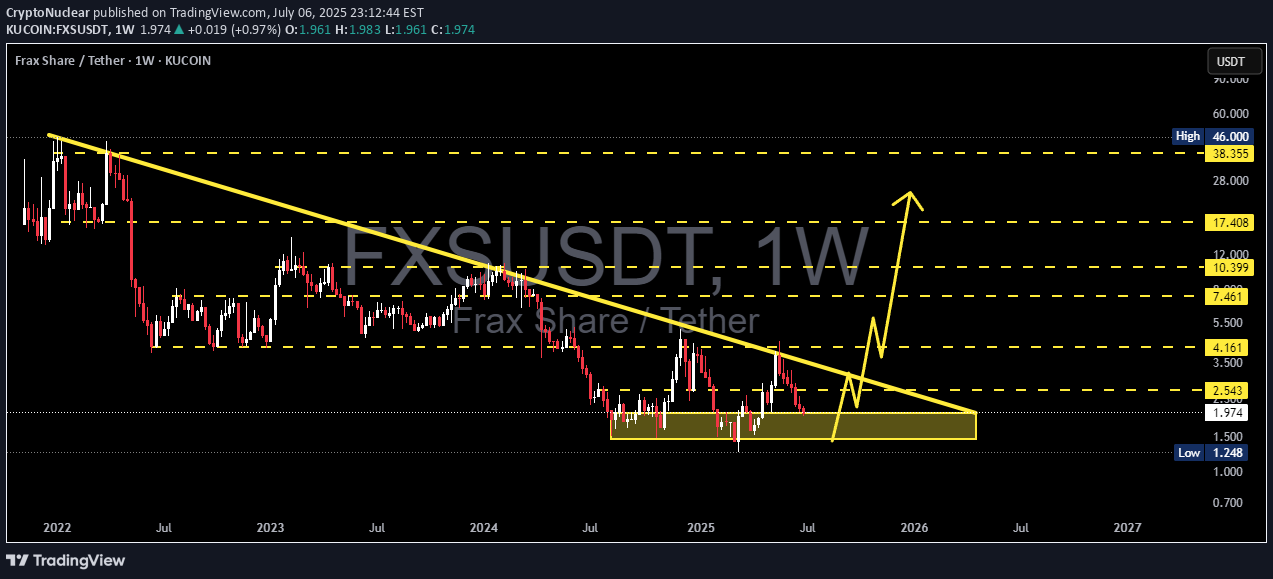
🧠 Overview:Frax Share (FXS) has been consolidating in a long-term accumulation phase, forming a strong base in the $1.24 – $2.54 zone for over a year. This prolonged sideways movement suggests institutional accumulation and a potential macro reversal, especially as the price is tightening near a major descending trendline that has acted as dynamic resistance since early 2022.The chart is setting up for what could be a massive bullish breakout, with multiple confluences aligning technically and psychologically.🧱 Technical Structure & Pattern Analysis:Pattern: The chart shows signs of a falling wedge combined with a horizontal accumulation base, which is typically a bullish reversal structure.Descending Trendline: The yellow diagonal trendline has been respected for over 2 years. Price is now coiling below it, hinting at a potential volatility expansion.Accumulation Range: Price has consistently respected the $1.24 – $2.54 support range (highlighted in yellow), forming a multi-touch base, which strengthens the validity of this demand zone.Volume: While volume isn't shown, such long consolidations often coincide with volume contraction, followed by explosive moves when volume returns.🟢 Bullish Scenario (High Probability):1. Breakout Above $2.54 confirms exit from the accumulation range.2. Initial targets:$4.16 – Previous resistance + psychological round level$7.46 – Major horizontal S/R flip$10.39 – Weekly supply zone3. Mid to Long-Term Targets:$17.40 – Pre-breakdown support from 2022$38.35 and even $46.00 – Full bullish cycle potential (ATH zone)📌 Catalyst: A weekly candle close above $2.54 with increased volume could trigger a cascade of bullish momentum and possibly attract large buyers or breakout traders.🔴 Bearish Scenario (Low Probability but Must Consider):1. Breakdown below $1.24 would invalidate the base and potentially lead to:Retesting uncharted lows near $1.00 or lowerLoss of investor confidence in the short to mid term2. Such a move could suggest distribution rather than accumulation, but this currently lacks confirmation from price action.🧠 Strategic Insight:This chart is a textbook example of “High Risk, High Reward”. Smart traders and swing investors often hunt for assets in deep accumulation zones with favorable reward-to-risk setups — and FXS fits this criterion perfectly.Entering on retests above $2.54 or accumulating in the current zone with tight stop-losses below $1.24 offers compelling upside with controlled downside.📊 Key Technical Levels to Watch:Level Description$1.24 - $2.54 Demand Zone / Accumulation Base$2.54 Breakout Confirmation Level$4.16 First Key Resistance$7.46 Major Resistance$10.39 Mid-Term Bull Target$17.40 Pre-breakdown Zone$38.35 - $46 Long-Term Bull Cycle Target🧭 Conclusion:FXS is quietly preparing for a major breakout move, and the current chart setup indicates that patient accumulation might soon pay off. Whether you're a technical trader, long-term investor, or a crypto strategist, FXS deserves a spot on your watchlist right now.This could be one of those “before the hype” moments — don’t miss it.#FXS #FXSUSDT #CryptoBreakout #AltcoinSetup #TechnicalAnalysis #Accumulation #FallingWedge #BullishCrypto #CryptoChart #FXSTechnical #SwingTrade
CryptoNuclear
FXSUSDT 1W Analysis


Ren_MomentumTrader
FXS/USDT

Key Level Zone: 2.8080 - 2.8350HMT v8.1 detected. The setup looks promising, supported by a previous upward/downward trend with increasing volume and momentum, presenting an excellent reward-to-risk opportunity.HMT (High Momentum Trending):HMT is based on trend, momentum, volume, and market structure across multiple timeframes. It highlights setups with strong potential for upward movement and higher rewards.Whenever I spot a signal for my own trading, I’ll share it. Please note that conducting a comprehensive analysis on a single timeframe chart can be quite challenging and sometimes confusing. I appreciate your understanding of the effort involved.Important Note :Role of Key Levels:- These zones are critical for analyzing price trends. If the key level zone holds, the price may continue trending in the expected direction. However, momentum may increase or decrease based on subsequent patterns.- Breakouts: If the key level zone breaks, it signals a stop-out. For reversal traders, this presents an opportunity to consider switching direction, as the price often retests these zones, which may act as strong support-turned-resistance (or vice versa).My Trading RulesRisk Management- Maximum risk per trade: 2.5%.- Leverage: 5x.Exit StrategyProfit-Taking:- Sell at least 70% on the 3rd wave up (LTF Wave 5).- Typically, sell 50% during a high-volume spike.- Adjust stop-loss to breakeven once the trade achieves a 1.5:1 reward-to-risk ratio.- If the market shows signs of losing momentum or divergence, ill will exit at breakeven.The market is highly dynamic and constantly changing. HMT signals and target profit (TP) levels are based on the current price and movement, but market conditions can shift instantly, so it is crucial to remain adaptable and follow the market's movement.If you find this signal/analysis meaningful, kindly like and share it.Thank you for your support~Sharing this with love!HMT v2.0:- Major update to the Momentum indicator- Reduced false signals from inaccurate momentum detection- New screener with improved accuracy and fewer signalsHMT v3.0:- Added liquidity factor to enhance trend continuation- Improved potential for momentum-based plays- Increased winning probability by reducing entries during peaksHMT v3.1:- Enhanced entry confirmation for improved reward-to-risk ratiosHMT v4.0:- Incorporated buying and selling pressure in lower timeframes to enhance the probability of trending moves while optimizing entry timing and scalingHMT v4.1:- Enhanced take-profit (TP) target by incorporating market structure analysisHMT v5 :Date: 23/01/2025- Refined wave analysis for trending conditions- Incorporated lower timeframe (LTF) momentum to strengthen trend reliability- Re-aligned and re-balanced entry conditions for improved accuracyHMT v6 :Date : 15/02/2025- Integrated strong accumulation activity into in-depth wave analysisHMT v7 :Date : 20/03/2025- Refined wave analysis along with accumulation and market sentimentHMT v8 :Date : 16/04/2025- Fully restructured strategy logicHMT v8.1 :Date : 18/04/2025- Refined Take Profit (TP) logic to be more conservative for improved win consistency

stanleycrypto_1
$FXS Setup Heating Up

FXS Setup Heating Up 🔥FXSUSD is holding strong above the breakout zone near $3 after a clean retest.As long as it stays above this support, the setup looks bullish with a potential 100% move toward $6.20. Momentum is building, one to keep an eye on!DYRO, NFA

CryptoAnalystSignal
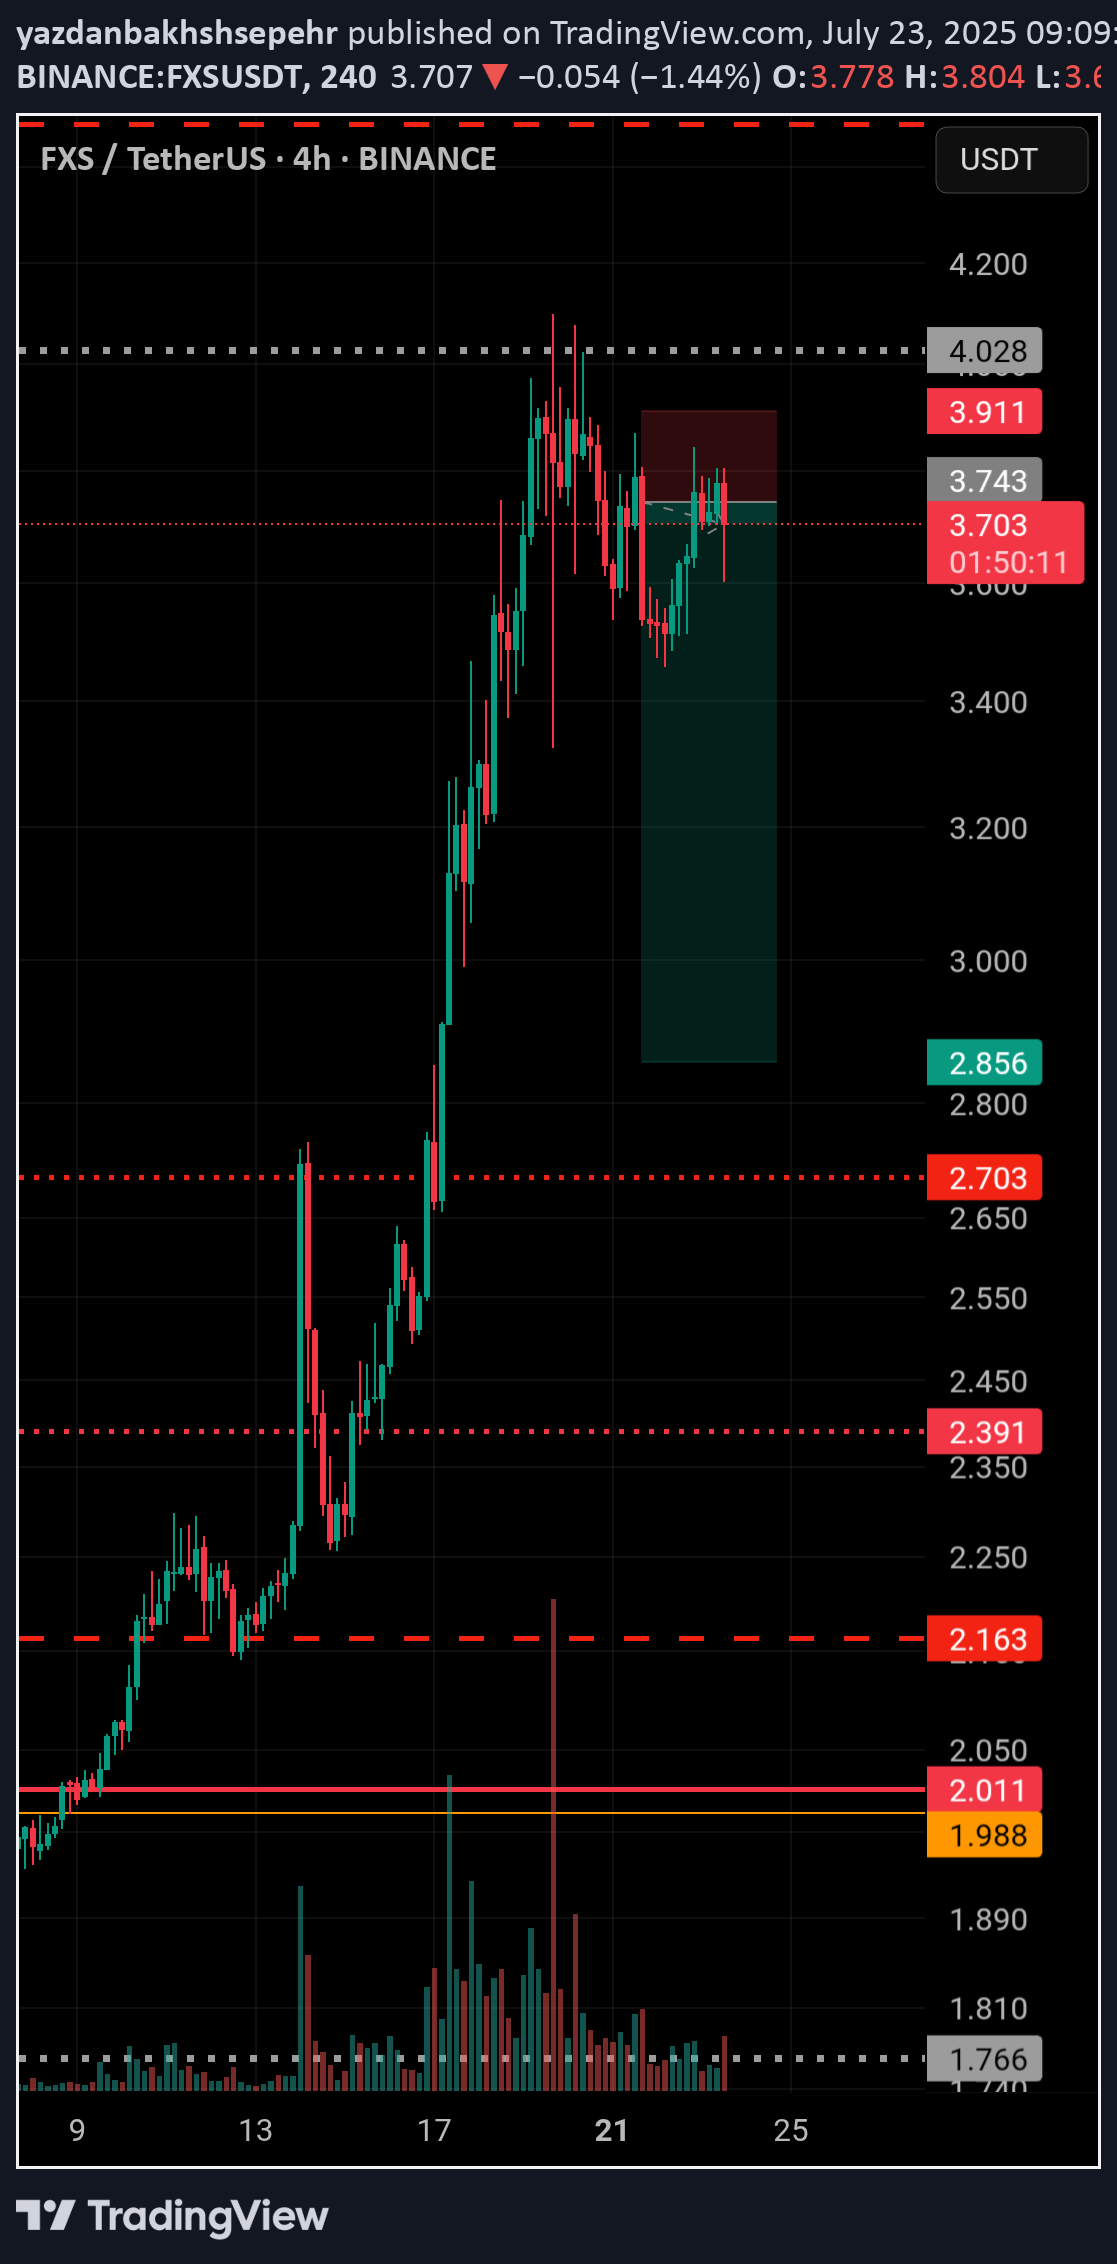
#FXS/USDT

#FXSThe price is moving within a descending channel on the 1-hour frame, adhering well to it, and is heading for a strong breakout and retest.We are experiencing a rebound from the lower boundary of the descending channel, which is support at 3.70.We are experiencing a downtrend on the RSI indicator, which is about to break and retest, supporting the upward trend.We are looking for stability above the 100 Moving Average.Entry price: 3.75First target: 3.96Second target: 4.13Third target: 4.37

Bithereum_io

MasterAnanda
Frax Share On The Way Up (PP: 270%)

The low here happened 11-March rather than 7-April, 7-April was a higher low. The action is strongly bullish and the rising channel has been broken, the upper boundary. From this we can deduct that the next higher high will be a really strong one.Frax Share is on the way up.The $11.33 target with 270% potential on the chart gives 809% potential when taken from the 11-March low. This is the projected size of this first 2025 bull market advance. Of course it can happen that the peak reaches $7.47. The first peak can be $7.47 or $11.33 doesn't matter. After the higher high is in, we are likely to experience a retrace or correction followed by additional growth. This "additional growth" will result in something really huge. It will be awesome.Prepare now, many Altcoins are still trading at bottom prices.Plan before buying. When will you sell if prices start to rise after you bought?How much will you sell?If you don't sell everything, what will you do with the remaining tokens?If you sell everything, what will you do with the free capital? Use a portion to enter a new trade while securing some profits? Go all in a new trade or split between multiple pairs?Plan for all scenarios.Create your own scenarios. This way you can win big.Namaste.
Disclaimer
Any content and materials included in Sahmeto's website and official communication channels are a compilation of personal opinions and analyses and are not binding. They do not constitute any recommendation for buying, selling, entering or exiting the stock market and cryptocurrency market. Also, all news and analyses included in the website and channels are merely republished information from official and unofficial domestic and foreign sources, and it is obvious that users of the said content are responsible for following up and ensuring the authenticity and accuracy of the materials. Therefore, while disclaiming responsibility, it is declared that the responsibility for any decision-making, action, and potential profit and loss in the capital market and cryptocurrency market lies with the trader.