Technical analysis by CryptoNuclear about Symbol FRAX: Buy recommendation (7/7/2025)

CryptoNuclear
FXS/USDT – Long-Term Accumulation Base Ready for Takeoff
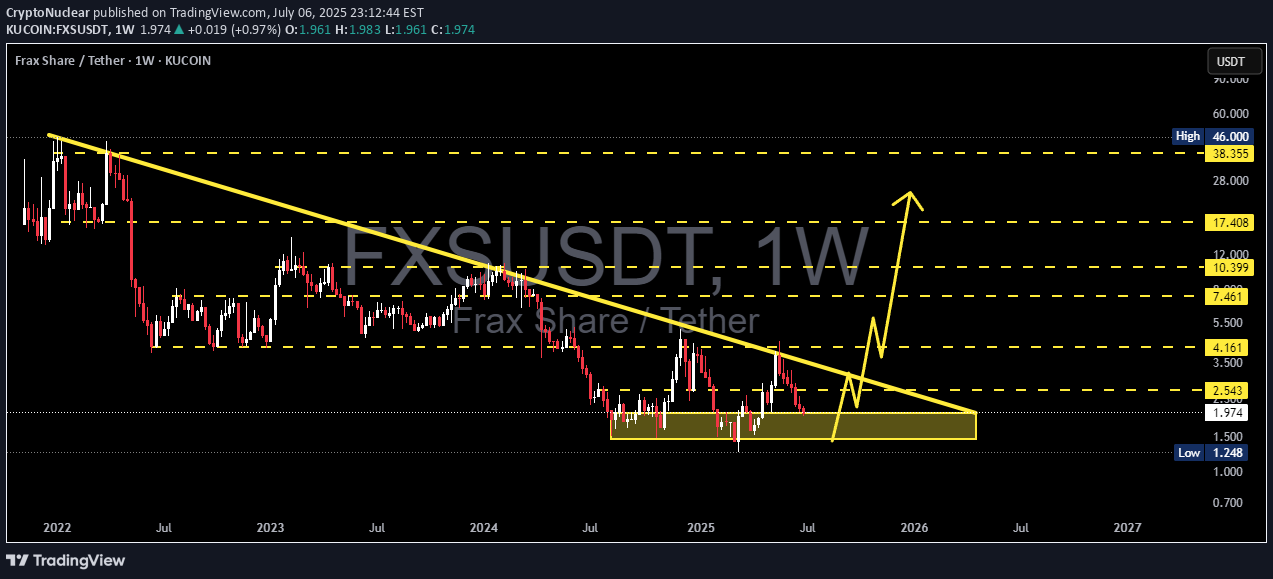
🧠 Overview:Frax Share (FXS) has been consolidating in a long-term accumulation phase, forming a strong base in the $1.24 – $2.54 zone for over a year. This prolonged sideways movement suggests institutional accumulation and a potential macro reversal, especially as the price is tightening near a major descending trendline that has acted as dynamic resistance since early 2022.The chart is setting up for what could be a massive bullish breakout, with multiple confluences aligning technically and psychologically.🧱 Technical Structure & Pattern Analysis:Pattern: The chart shows signs of a falling wedge combined with a horizontal accumulation base, which is typically a bullish reversal structure.Descending Trendline: The yellow diagonal trendline has been respected for over 2 years. Price is now coiling below it, hinting at a potential volatility expansion.Accumulation Range: Price has consistently respected the $1.24 – $2.54 support range (highlighted in yellow), forming a multi-touch base, which strengthens the validity of this demand zone.Volume: While volume isn't shown, such long consolidations often coincide with volume contraction, followed by explosive moves when volume returns.🟢 Bullish Scenario (High Probability):1. Breakout Above $2.54 confirms exit from the accumulation range.2. Initial targets:$4.16 – Previous resistance + psychological round level$7.46 – Major horizontal S/R flip$10.39 – Weekly supply zone3. Mid to Long-Term Targets:$17.40 – Pre-breakdown support from 2022$38.35 and even $46.00 – Full bullish cycle potential (ATH zone)📌 Catalyst: A weekly candle close above $2.54 with increased volume could trigger a cascade of bullish momentum and possibly attract large buyers or breakout traders.🔴 Bearish Scenario (Low Probability but Must Consider):1. Breakdown below $1.24 would invalidate the base and potentially lead to:Retesting uncharted lows near $1.00 or lowerLoss of investor confidence in the short to mid term2. Such a move could suggest distribution rather than accumulation, but this currently lacks confirmation from price action.🧠 Strategic Insight:This chart is a textbook example of “High Risk, High Reward”. Smart traders and swing investors often hunt for assets in deep accumulation zones with favorable reward-to-risk setups — and FXS fits this criterion perfectly.Entering on retests above $2.54 or accumulating in the current zone with tight stop-losses below $1.24 offers compelling upside with controlled downside.📊 Key Technical Levels to Watch:Level Description$1.24 - $2.54 Demand Zone / Accumulation Base$2.54 Breakout Confirmation Level$4.16 First Key Resistance$7.46 Major Resistance$10.39 Mid-Term Bull Target$17.40 Pre-breakdown Zone$38.35 - $46 Long-Term Bull Cycle Target🧭 Conclusion:FXS is quietly preparing for a major breakout move, and the current chart setup indicates that patient accumulation might soon pay off. Whether you're a technical trader, long-term investor, or a crypto strategist, FXS deserves a spot on your watchlist right now.This could be one of those “before the hype” moments — don’t miss it.#FXS #FXSUSDT #CryptoBreakout #AltcoinSetup #TechnicalAnalysis #Accumulation #FallingWedge #BullishCrypto #CryptoChart #FXSTechnical #SwingTrade