
FORM
Four
| تریدر | نوع سیگنال | حد سود/ضرر | زمان انتشار | مشاهده پیام |
|---|---|---|---|---|
 Alpha-GoldFXRank: 32207 | خرید | حد سود: تعیین نشده حد ضرر: تعیین نشده | 12/17/2025 | |
 asilturkRank: 32058 | خرید | حد سود: تعیین نشده حد ضرر: تعیین نشده | 12/16/2025 |
Price Chart of Four
سود 3 Months :
سیگنالهای Four
Filter
Sort messages by
Trader Type
Time Frame
Alpha-GoldFX
FORMUSDT Forming Falling Wedge

FORMUSDT is forming a clear falling wedge pattern, a classic bullish reversal signal that often indicates an upcoming breakout. The price has been consolidating within a narrowing range, suggesting that selling pressure is weakening while buyers are beginning to regain control. With consistent volume confirming accumulation at lower levels, the setup hints at a potential bullish breakout soon. The projected move could lead to an impressive gain of around 140% to 150% once the price breaks above the wedge resistance. This falling wedge pattern is typically seen at the end of downtrends or corrective phases, and it represents a potential shift in market sentiment from bearish to bullish. Traders closely watching FORMUSDT are noting the strengthening momentum as it nears a breakout zone. The good trading volume adds confidence to this pattern, showing that market participants are positioning early in anticipation of a reversal. Investors’ growing interest in FORMUSDT reflects rising confidence in the project’s long-term fundamentals and current technical strength. If the breakout confirms with sustained volume, this could mark the start of a fresh bullish leg. Traders might find this a valuable setup for medium-term gains, especially as the wedge pattern completes and buying momentum accelerates. ✅ Show your support by hitting the like button and ✅ Leaving a comment below! (What is your opinion about this Coin?) Your feedback and engagement keep me inspired to share more insightful market analysis with you!
asilturk
FORM Sert Yukselisler Gelebilir
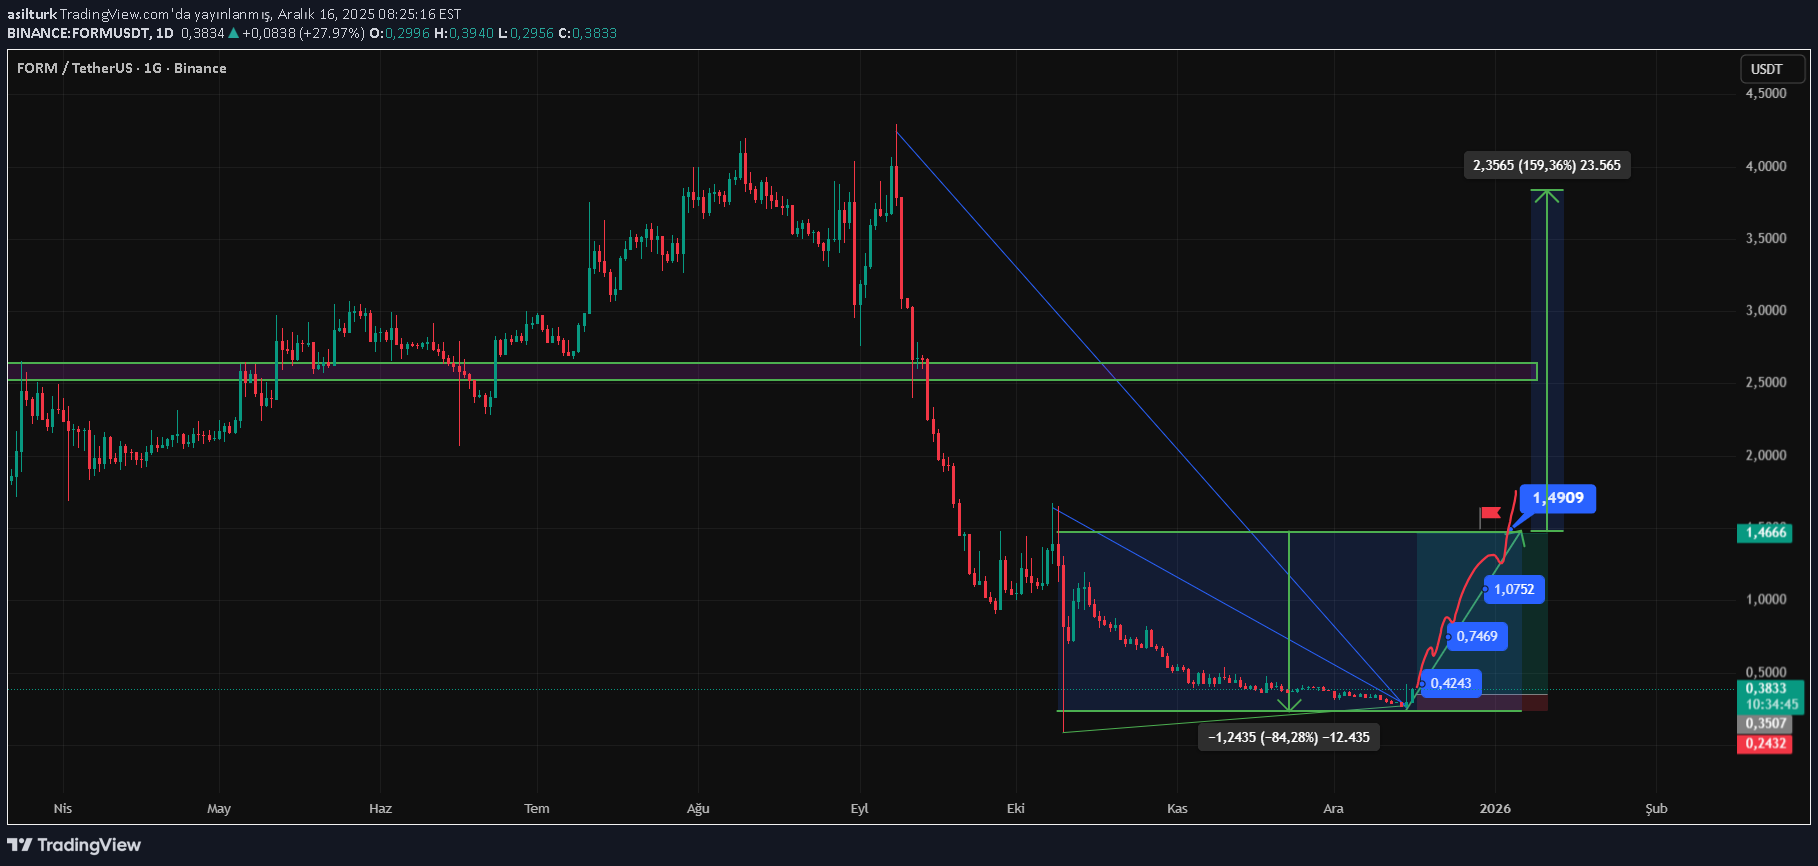
Another crypto that we will add to the portfolio today is FORM (four&bnx), market value is 220 Million $, platform concentration value is over 24, extreme volatility and total maximum circulation is 580 Million units and the largest shares are in 5 wallets in total... It needs to be careful. I wish you good luck.
Alpha-GoldFX
FORMUSDT Forming Falling Wedge

FORMUSDT is forming a clear falling wedge pattern, a classic bullish reversal signal that often indicates an upcoming breakout. The price has been consolidating within a narrowing range, suggesting that selling pressure is weakening while buyers are beginning to regain control. With consistent volume confirming accumulation at lower levels, the setup hints at a potential bullish breakout soon. The projected move could lead to an impressive gain of around 140% to 150% once the price breaks above the wedge resistance. This falling wedge pattern is typically seen at the end of downtrends or corrective phases, and it represents a potential shift in market sentiment from bearish to bullish. Traders closely watching FORMUSDT are noting the strengthening momentum as it nears a breakout zone. The good trading volume adds confidence to this pattern, showing that market participants are positioning early in anticipation of a reversal. Investors’ growing interest in FORMUSDT reflects rising confidence in the project’s long-term fundamentals and current technical strength. If the breakout confirms with sustained volume, this could mark the start of a fresh bullish leg. Traders might find this a valuable setup for medium-term gains, especially as the wedge pattern completes and buying momentum accelerates. ✅ Show your support by hitting the like button and ✅ Leaving a comment below! (What is your opinion about this Coin?) Your feedback and engagement keep me inspired to share more insightful market analysis with you!

پشتیبانی کشفنشده در 0.0631 سنت: آیا بازار به این نقطه حساس میرسد؟
Identified a potential capitulation support in the uncharted area at 0.0631 cents, which may be tested if the market or BTC declines. This message is for educational purposes only. Always DYOR. Based on historical graph analysis from Gate.io chart

sladkamala123
سقوط آزاد قیمت: تحلیل روند نزولی شدید (افت بیش از 85 درصد!)
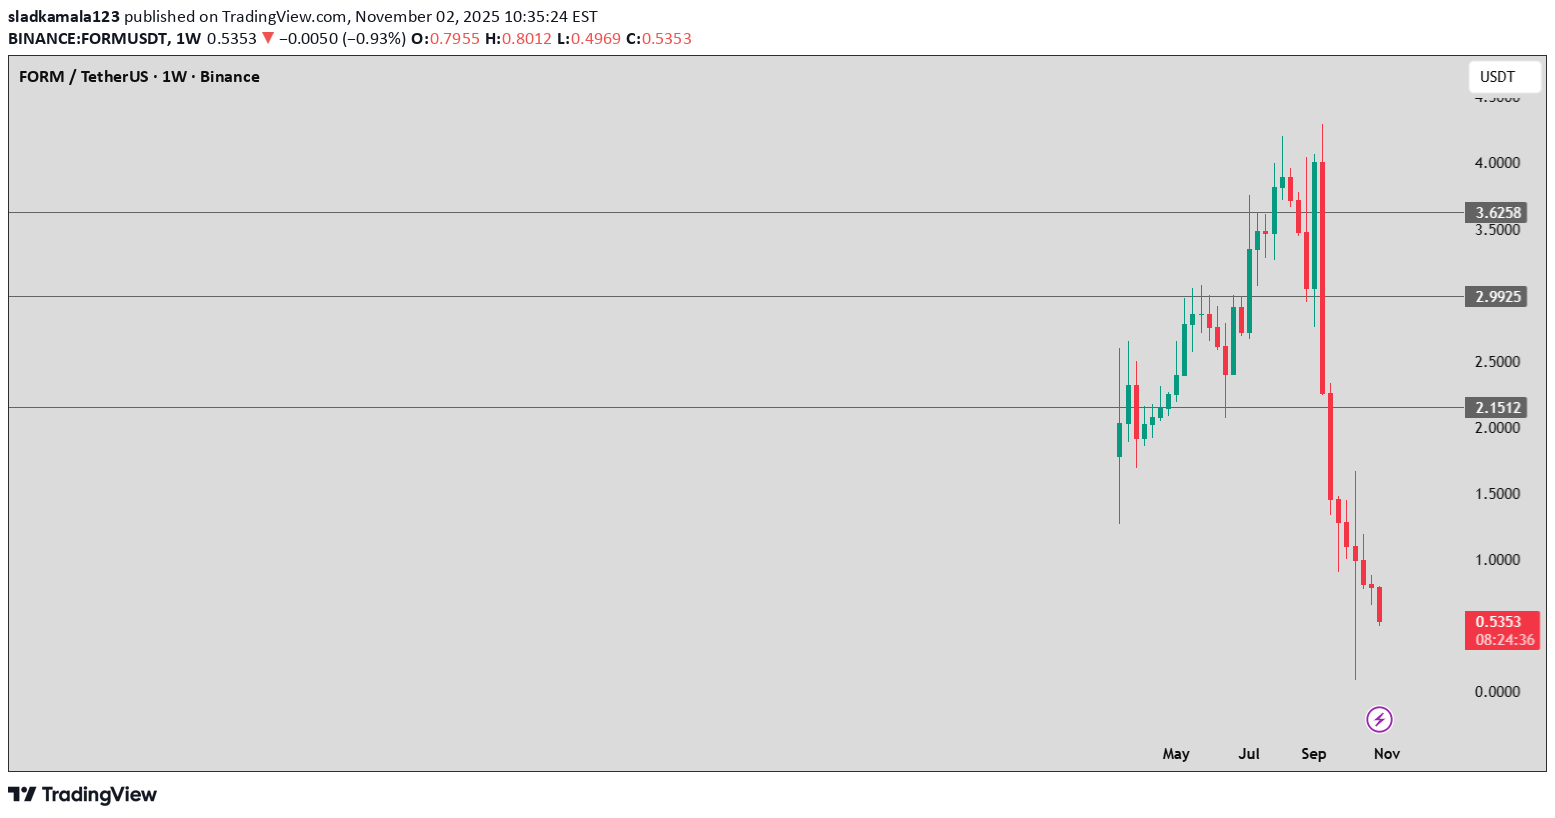
The chart shows a clear bearish downtrend. After a strong uoward move where the price reached the area around 3,8-4,0USDT , a rapid decline followed with several consecutive red condles. The current price is around 0,53 USDT meaning it has lost more than 85% of its value from the peak - a clear sing of dominant selling pressure.

ULYSSESTRADER
پیشبینی ریزش بزرگ قیمت FORM/USDT: ورود به معامله فروش (شورت) با ریسک کنترل شده

1. Chart Context Pair: FORM/USDT Timeframe: 1h Current Price: ≈ 0.9868 USDT The market recently dropped from resistance zones and is now retesting. 2. Trade Setup This is a short entry, expecting the price to fall again after rejection: Entry Zone: Around 0.98–0.99 USDT (current consolidation area). Stop Loss (SL): 1.0458 USDT (top of the red box). If the price rises above this, the short setup fails. Take Profit (TP): 0.9191 USDT (bottom of the green box). The trader is targeting the next support level. 3. Risk/Reward Ratio Risk (SL distance): ~0.059 USDT Reward (TP distance): ~0.068 USDT R:R ratio ≈ 1.15:1 A moderate setup, with slightly more reward than risk. 4. Support & Resistance Resistance Zones: 1.05 and higher (price struggled to hold above these levels). Support Zone: Around 0.92 USDT (clear demand zone marked by green box). The trade idea is that price will reject the retest of resistance and return to support.
Alpha-GoldFX
سیگنال انفجاری: FORMUSDT در آستانه رالی ۲۰۰ درصدی! (الگوی صعودی قوی)

FORMUSDT is forming a classic bullish continuation pattern, often seen as a strong bullish reversal signal. This pattern typically represents a period of consolidation before a major upward breakout, and FORM appears to be nearing that crucial breakout zone. The price action has shown decreasing volatility within the wedge, while volume remains steady — a sign that accumulation may be underway. With good trading volume backing the move, a breakout could trigger a potential rally of around 190% to 200%+, offering an attractive opportunity for swing and position traders. Investors are increasingly showing confidence in FORM, as seen in the recent uptick in participation and interest across multiple trading platforms. The bullish continuation structure, combined with growing investor enthusiasm, supports the idea that the asset could be entering a new bullish phase. This setup often leads to a rapid price recovery once resistance levels are breached, with the potential to attract momentum traders seeking strong technical confirmation. If the breakout is confirmed with strong volume and follow-through candles, FORMUSDT could experience a significant trend reversal, pushing the price into higher resistance zones and setting the tone for a sustained bullish trend. The technical outlook remains positive, with the chart signaling a favorable risk-to-reward setup for traders closely watching this pair. ✅ Show your support by hitting the like button and ✅ Leaving a comment below! (What is You opinion about this Coin) Your feedback and engagement keep me inspired to share more insightful market analysis with you!

Bithereum_io
فرصت خرید طلایی: تحلیل FORM و اهداف قیمتی انفجاری در نمودار روزانه!

Alpha-GoldFX
سیگنال صعودی بزرگ: آیا FORMUSDT با الگوی گُوِه نزولی آماده جهش 150 درصدی است؟

FORMUSDT is displaying a powerful **falling wedge pattern**, a formation often recognized as one of the most reliable bullish reversal indicators in technical analysis. After a period of consolidation and gradual price compression, the pair seems ready to break out from this structure with increasing momentum. The volume profile supports this setup, showing steady accumulation from investors who anticipate a major upside reversal. The current price action indicates growing buyer confidence as the coin continues to test the upper trendline of the wedge. Once a confirmed breakout occurs with sustained volume, FORMUSDT could potentially deliver a strong upward rally, aligning with the projected **140% to 150% gain**. The narrowing wedge structure reflects a market scenario where sellers are losing control and buyers are gradually stepping in to shift the trend direction. Investor sentiment toward FORMUSDT has been improving, as seen by the consistent inflows and renewed attention from traders looking for undervalued opportunities. The coin’s structure suggests that a bullish phase could emerge soon, supported by healthy market interest and momentum building across the broader crypto sector. ✅ Show your support by hitting the like button and ✅ Leaving a comment below! (What is You opinion about this Coin) Your feedback and engagement keep me inspired to share more insightful market analysis with you!

westautocomua
قیمت توکن FORM سقوط کرد؛ آیا زمان خرید برای رسیدن به ۳ دلار است؟

The FORM token has pulled back quite a bit but seems to be holding strong above the $0.90 level. I believe it has potential to make a move up to around $3, though I’ll be satisfied closing the position once it reaches that target. As always — everyone trades at their own risk. I share my trades purely for personal tracking and transparency, not as financial advice.
Disclaimer
Any content and materials included in Sahmeto's website and official communication channels are a compilation of personal opinions and analyses and are not binding. They do not constitute any recommendation for buying, selling, entering or exiting the stock market and cryptocurrency market. Also, all news and analyses included in the website and channels are merely republished information from official and unofficial domestic and foreign sources, and it is obvious that users of the said content are responsible for following up and ensuring the authenticity and accuracy of the materials. Therefore, while disclaiming responsibility, it is declared that the responsibility for any decision-making, action, and potential profit and loss in the capital market and cryptocurrency market lies with the trader.