
ULYSSESTRADER
@t_ULYSSESTRADER

What symbols does the trader recommend buying?
Purchase History
پیام های تریدر
Filter
ULYSSESTRADER
سیگنال خرید پرقدرت DOT: آماده جهش از کف حمایت کلیدی!
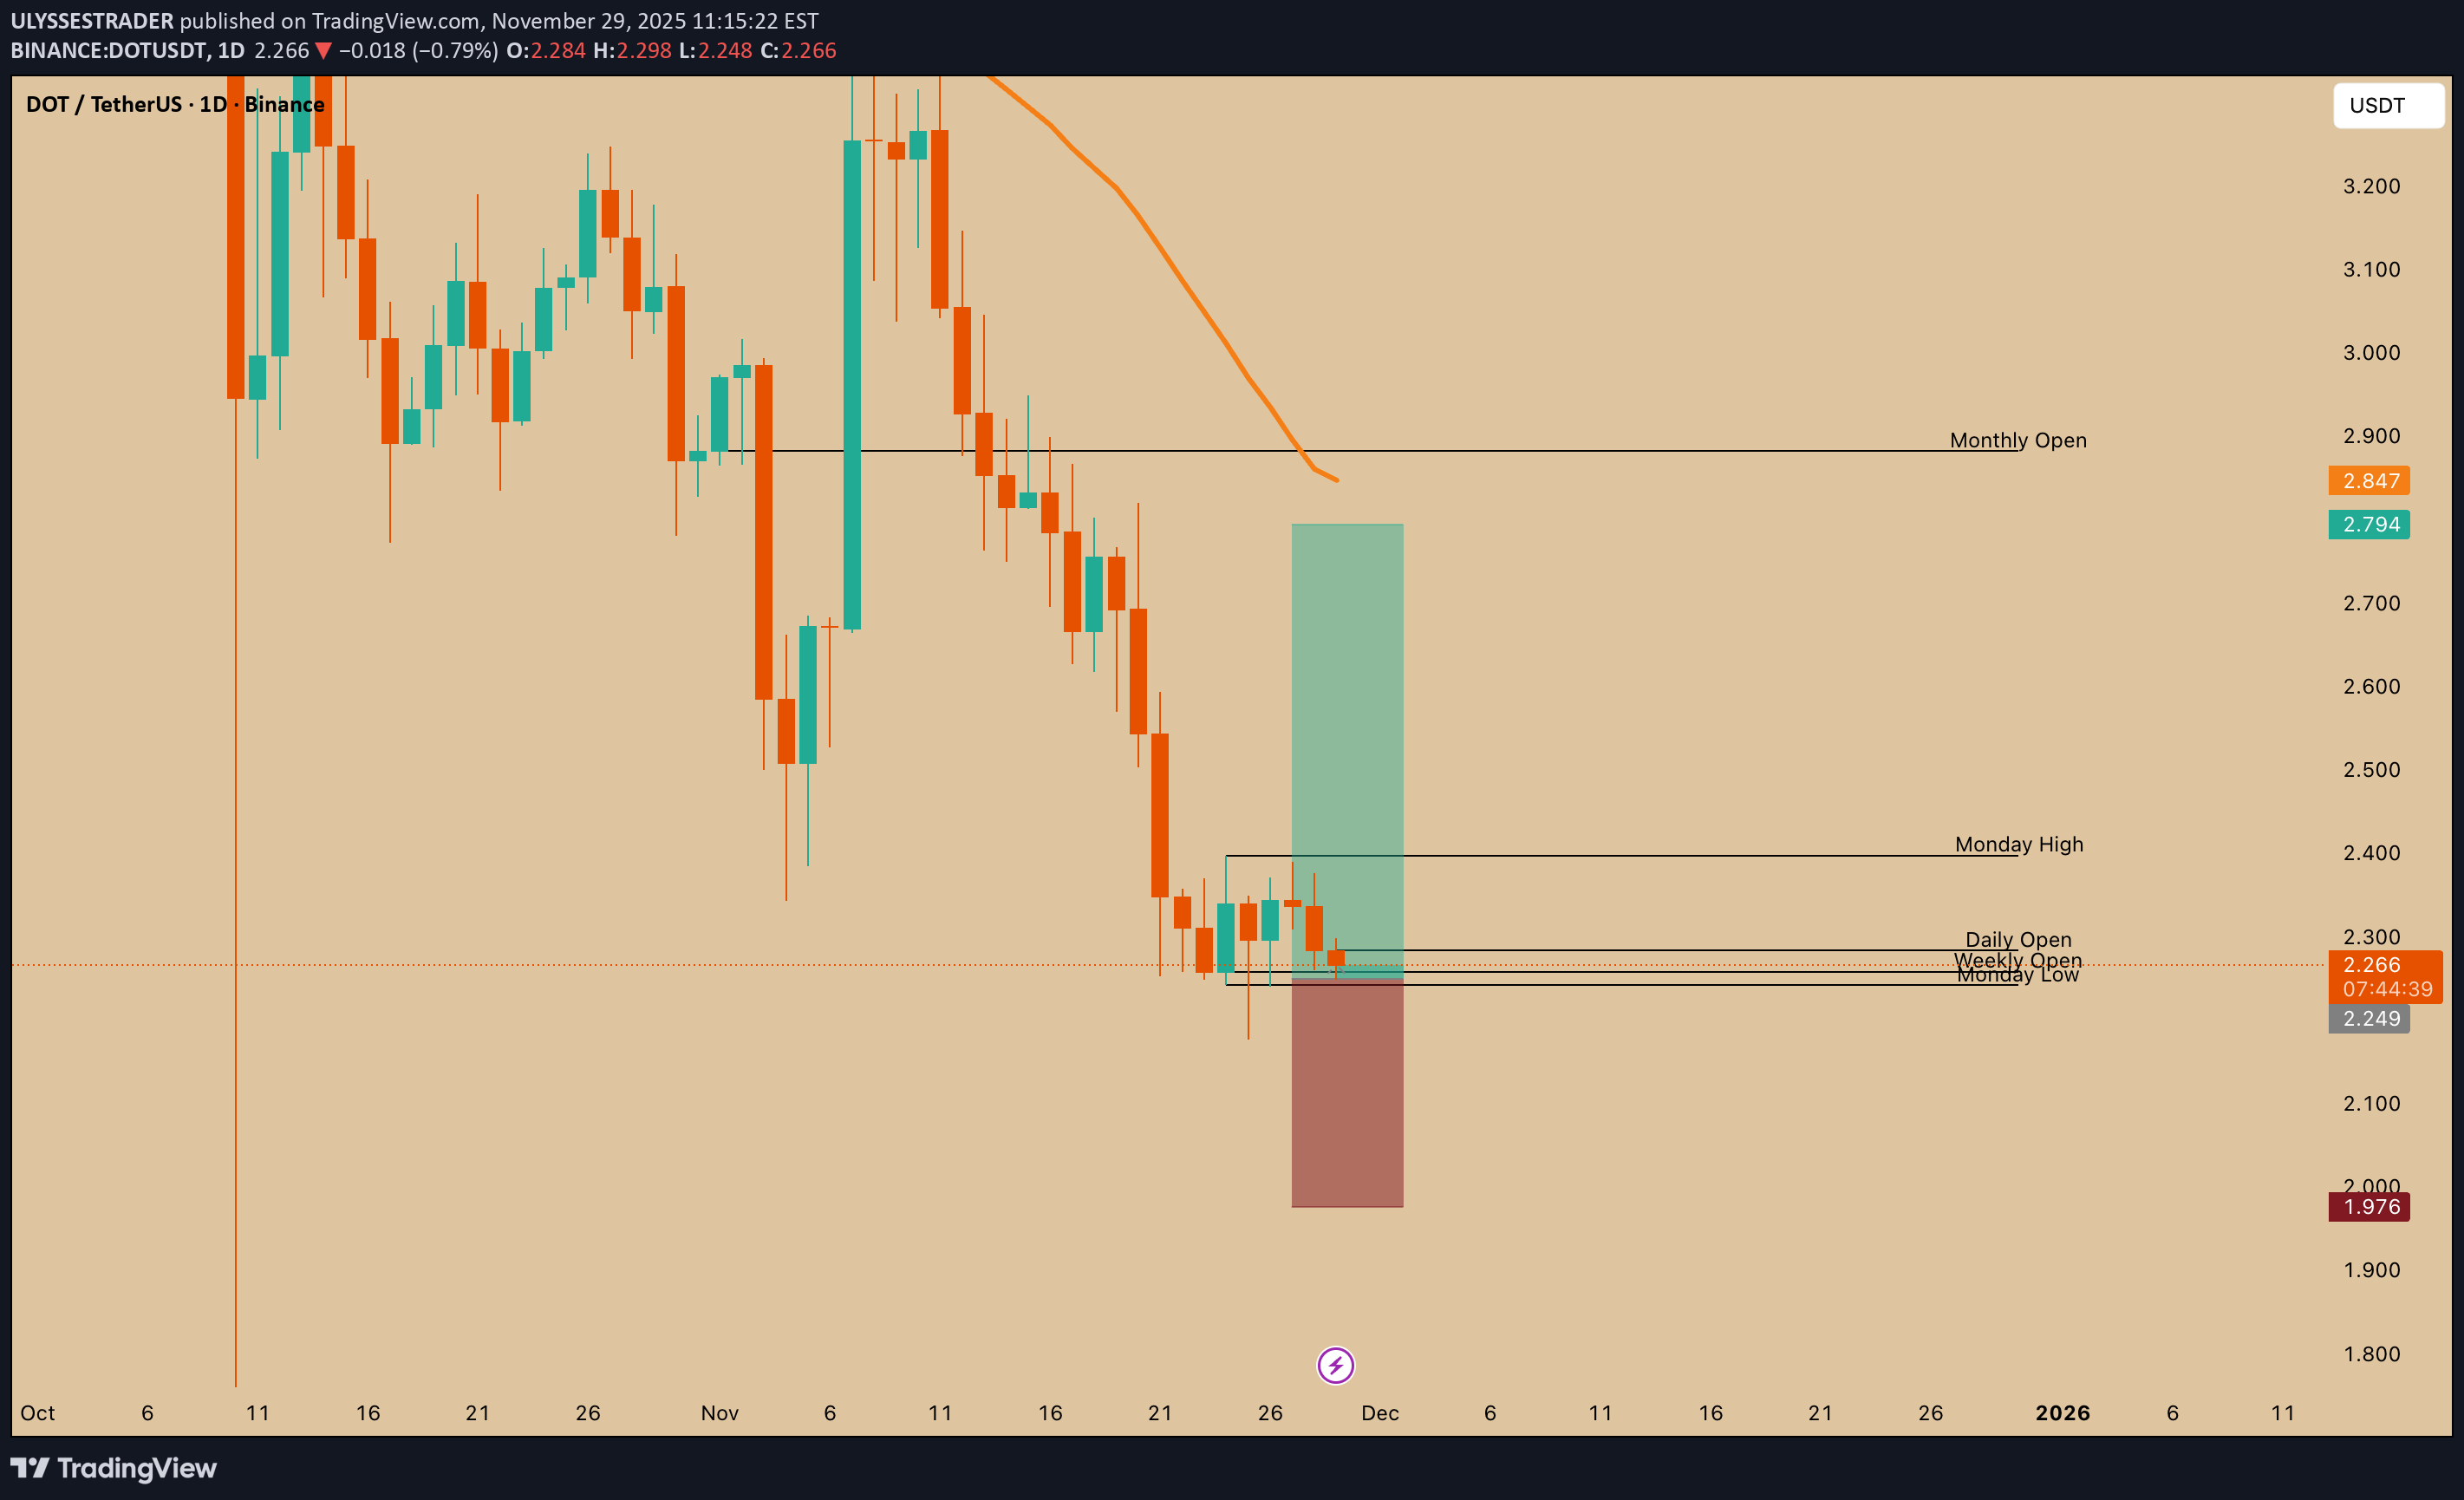
DOT/USDT – Long Setup Explanation Price has been in a sustained daily downtrend, but we’re now forming a tight consolidation right above a major liquidity cluster. The setup is based on a potential reversal from higher-timeframe levels. Key Reasons for the Long • Liquidity Sweep: Price swept the Monday Low and immediately reclaimed the Weekly + Daily Opens, showing buyer absorption. • Support Cluster: Daily Open, Weekly Open, and Monday Low are all stacked together — strong confluence for a bounce. • Accumulation Zone: Multiple small candles with long wicks indicate buyers defending this level after a sharp selloff. • Clean Invalidation: Stop is placed below the sweep and structure low. If price breaks that level, the idea is invalid. • Strong R:R Profile: Small downside risk with upside targets aligning with inefficiency fills and higher-timeframe opens. Targets 1️⃣ Monday High (~2.40) – First liquidity pocket above. 2️⃣ 2.55–2.60 – Imbalance fill / mid-range. 3️⃣ Monthly Open (~2.85) – Main swing target if a larger reversal develops. Idea Summary I’m looking for a relief move after a liquidity sweep and reclaim of key opens. As long as price holds above the Weekly/Daily Open cluster, the bias remains bullish toward the Monday High and Monthly Open.
ULYSSESTRADER
پیشبینی سقوط شدید بیبیداج (BABYDOGE): فرصت شورت با ریسک/پاداش 1.3:1!
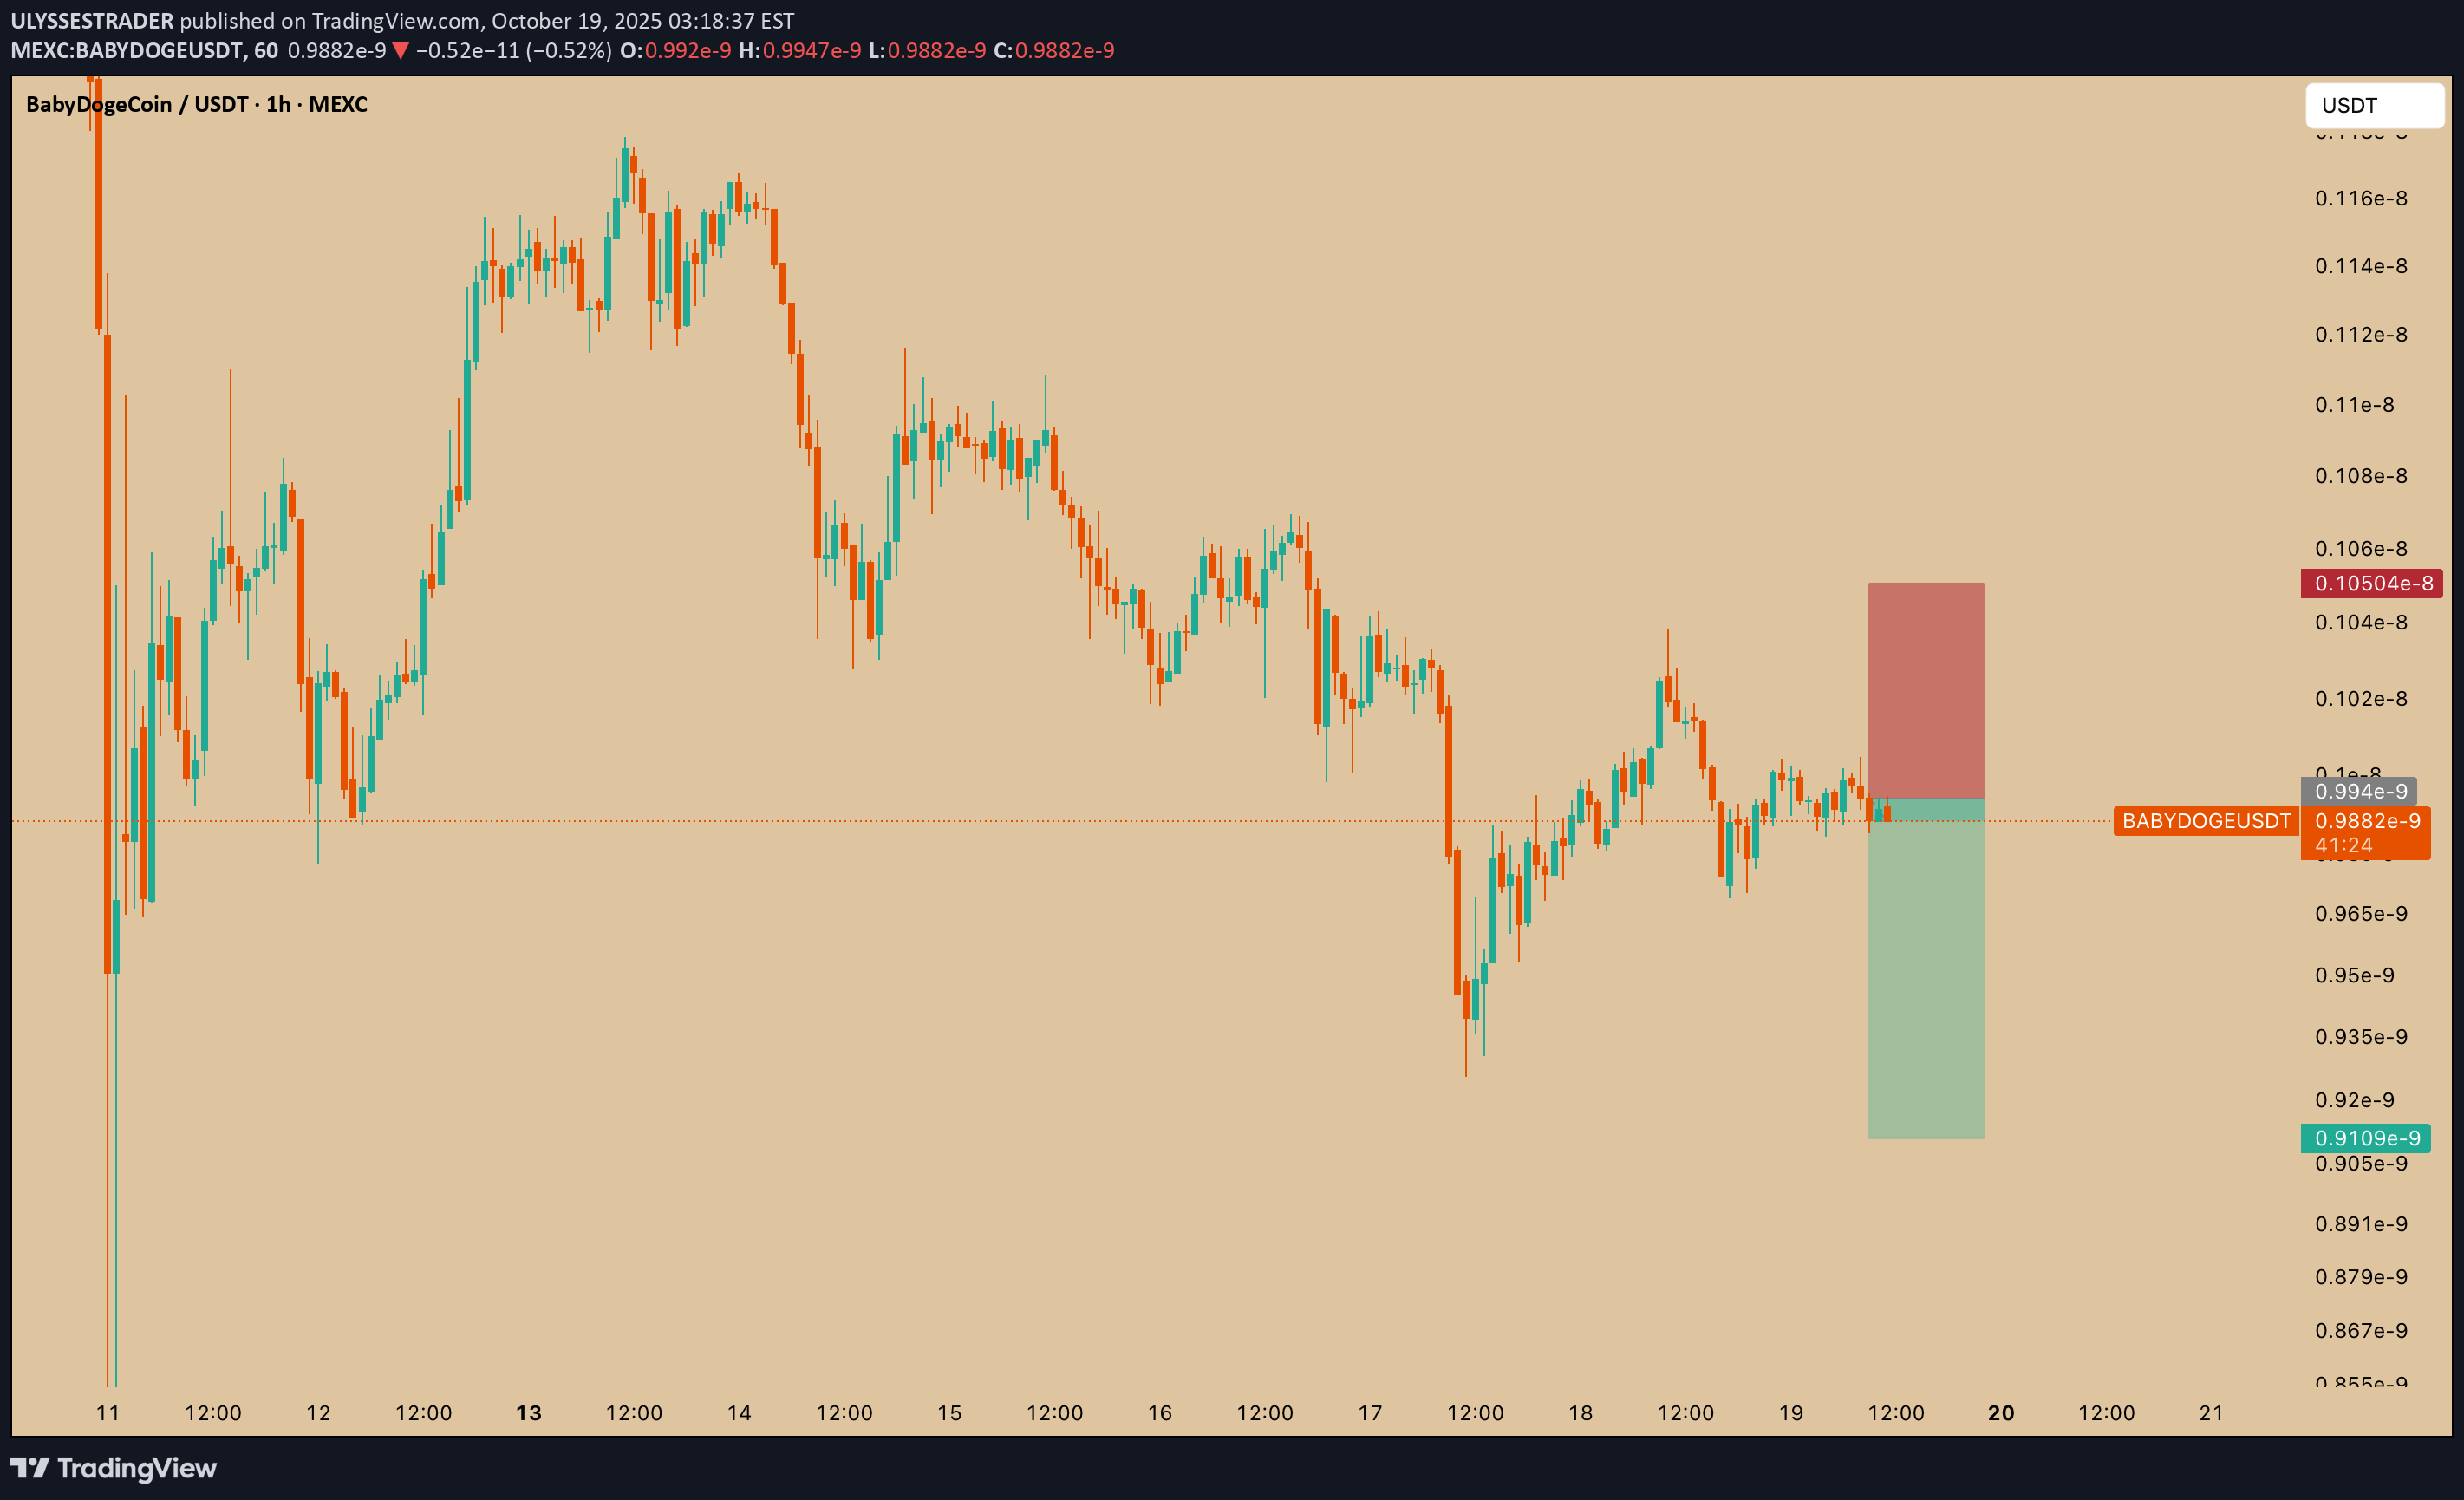
1. Chart Context Pair: BABYDOGE/USDT Exchange: MEXC Timeframe: 1h Current Price: ≈ 0.9899e-9 USDT Price action has been trending downward with lower highs and lower lows. Recently, it retested a supply zone and started rejecting. 2. Trade Setup This is a short position (betting on further downside). The red/green box represents the Risk/Reward (R:R): Entry Zone: ~0.99e-9 USDT (price consolidating just under resistance). Stop Loss (SL): 1.0504e-8 USDT (top of the red zone). If price breaks above this, the short setup is invalid. Take Profit (TP): 0.9109e-9 USDT (bottom of the green box). Targeting a drop back to the recent demand/support zone. 3. Risk/Reward Ratio Risk (SL distance): ~0.006e-9 Reward (TP distance): ~0.079e-9 R:R ratio ≈ 1.3:1 The setup provides slightly more reward than risk, but not very high compared to some other trades you’ve shown. 4. Support & Resistance Resistance Zone: ~1.02e-8 to 1.05e-8 (area where sellers previously stepped in). Support Zone: ~0.91e-9 (green box). Idea: price fails to break resistance and continues lower into the demand zone. ✅ In summary: This is a short trade setup on BABYDOGE/USDT, where the trader enters near 0.99e-9, sets a stop above 1.05e-8, and targets 0.91e-9. It’s a continuation trade betting that the bearish trend remains intact, with a moderate risk/reward ratio of about 1.3:1.
ULYSSESTRADER
سیگنال فروش فوری COTI/USDT: فرصت کسب سود در ریزش جدید (با حد ضرر مشخص)
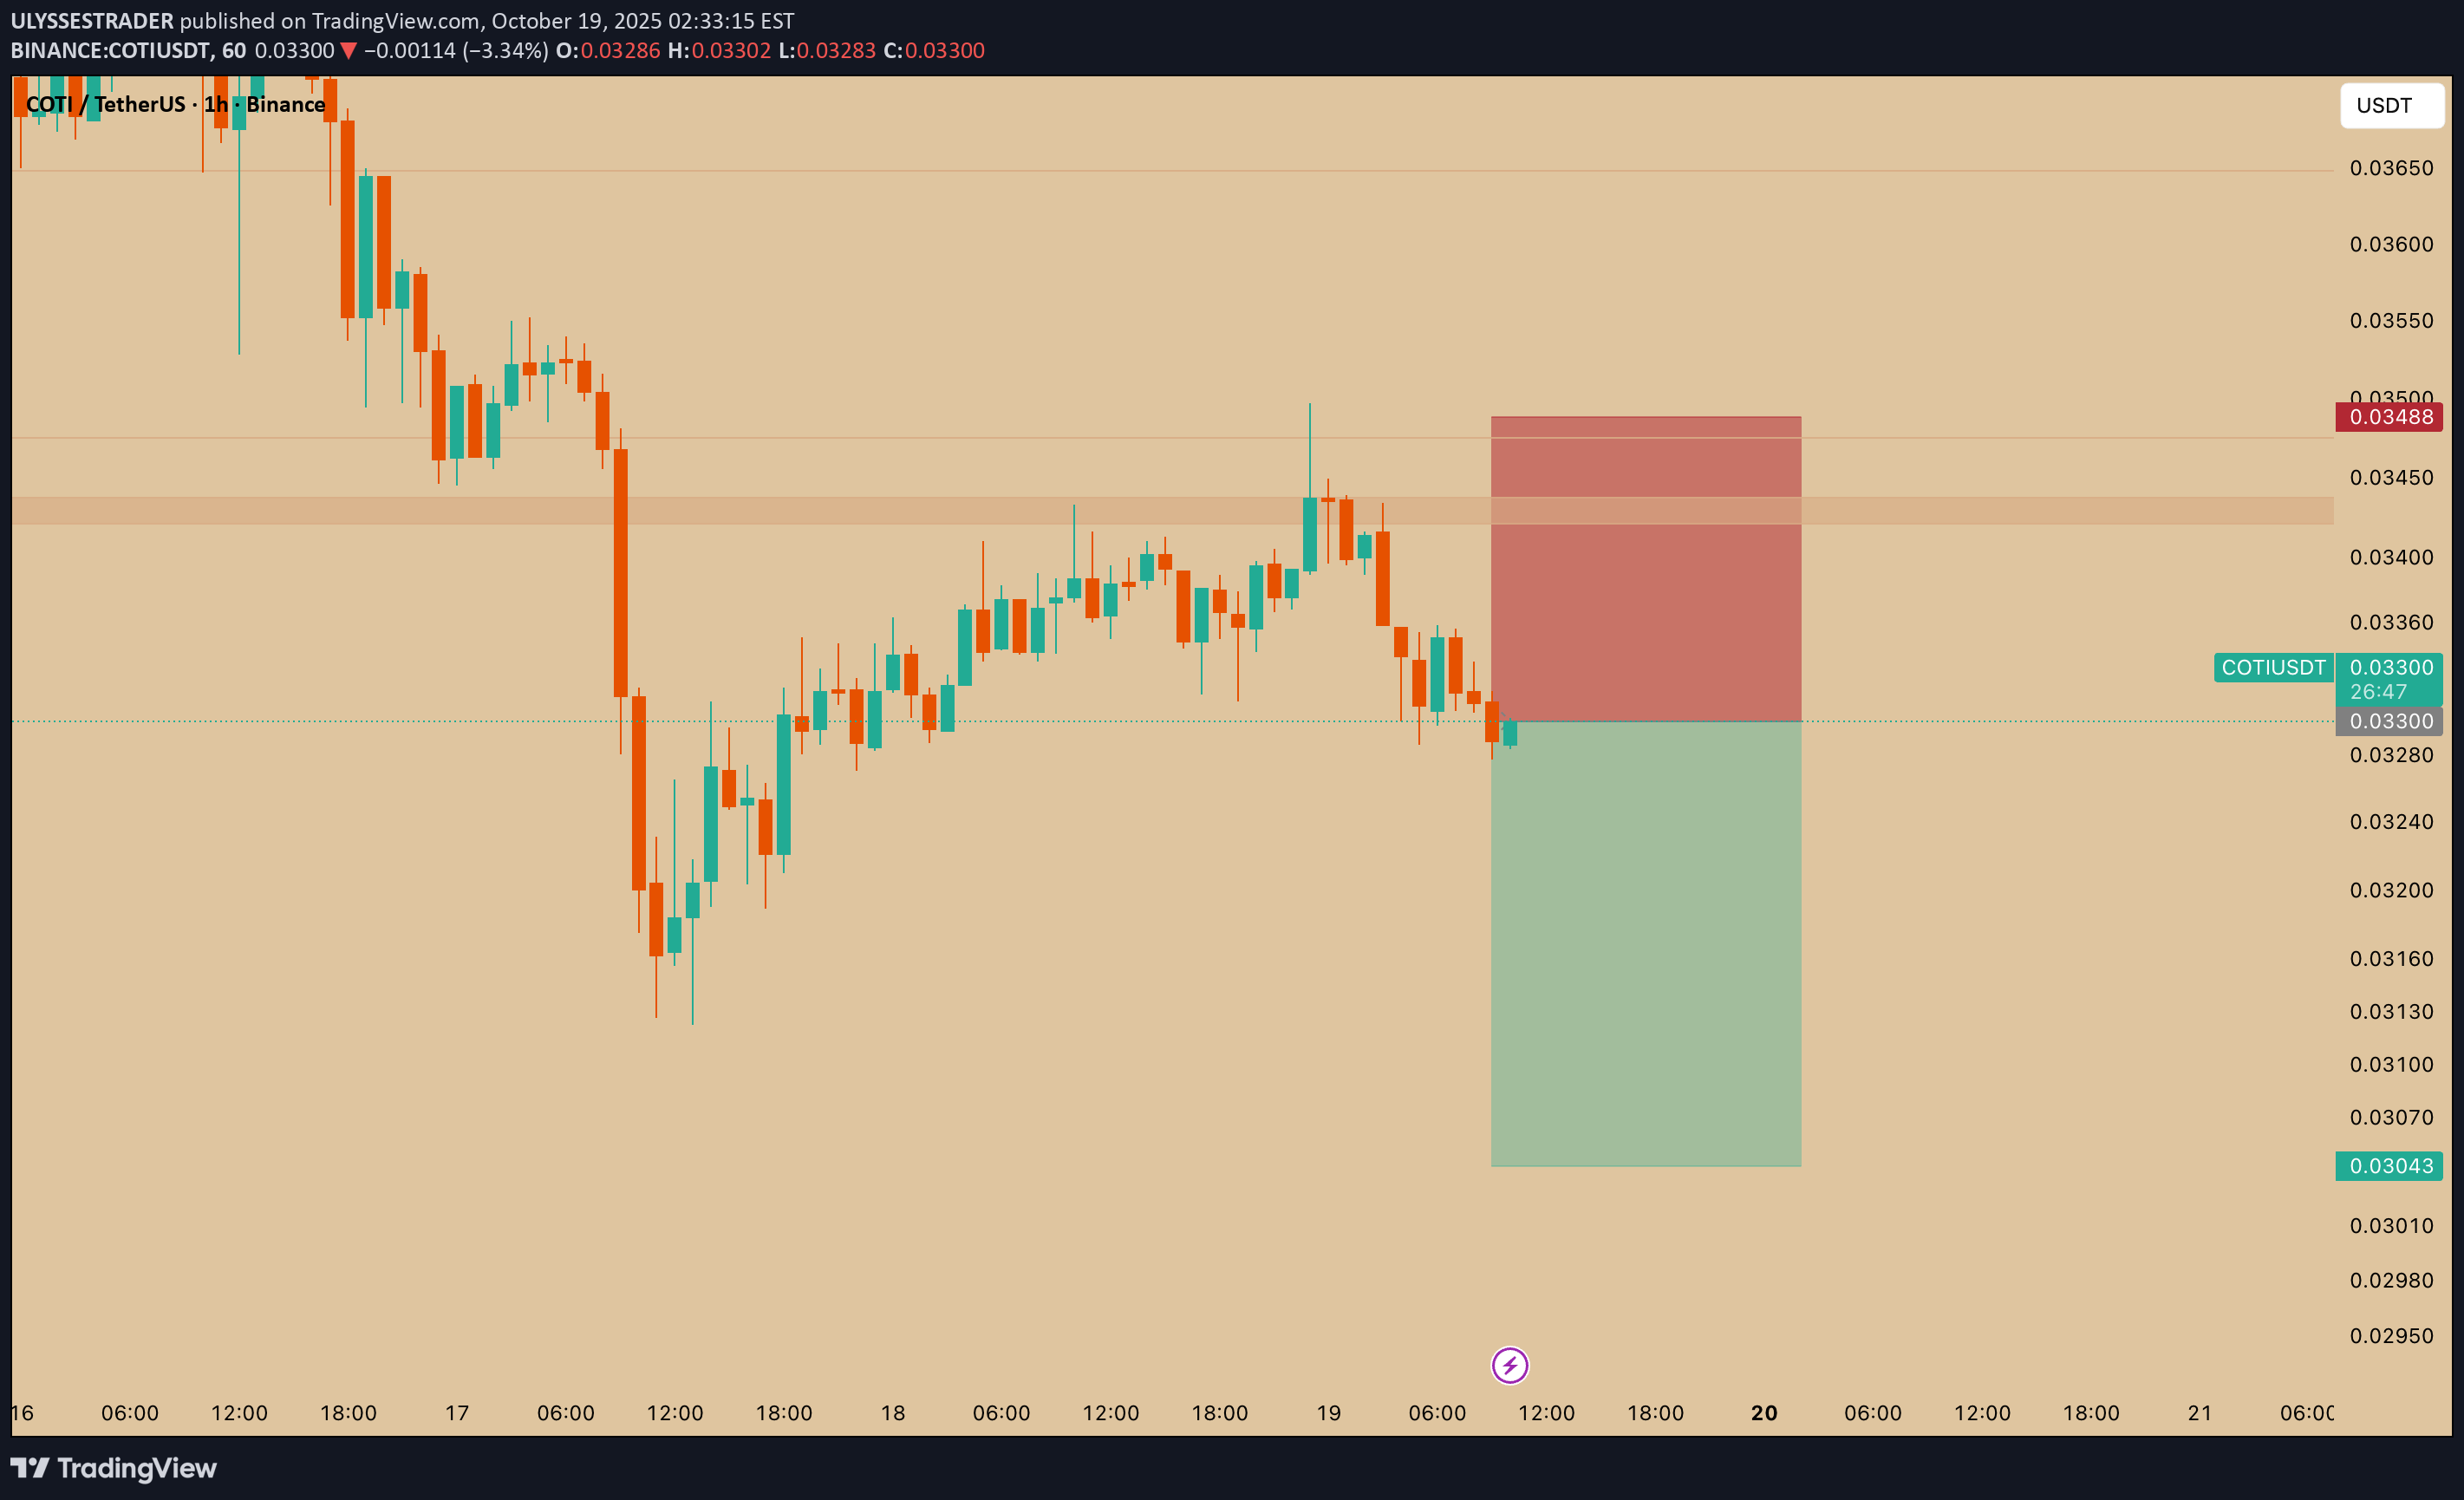
1. Chart Context Pair: COTI/USDT Timeframe: 1h Current Price: ≈ 0.03299 USDT Market has been in a downtrend with lower highs and lower lows. Price recently tested resistance and is now showing rejection. 2. Trade Setup This is a short position (betting on price to drop). The red/green rectangle highlights the Risk/Reward (R:R) structure: Entry Zone: Around 0.0330 USDT (current price, at rejection point). Stop Loss (SL): 0.03488 USDT (top of the red box). If price climbs above this level, the short trade setup is invalid. Take Profit (TP): 0.03043 USDT (bottom of the green box). Target is a move down into prior support. 3. Risk/Reward Ratio Risk (SL distance): ~0.0019 USDT Reward (TP distance): ~0.0026 USDT R:R ratio ≈ 1.37:1 Moderate setup; reward is larger than risk but not extremely high. 4. Support & Resistance Resistance Zone: 0.0345–0.0350 (previous rejection area). Support Zone: 0.0303–0.0305 (green target zone). The trader expects sellers to defend the resistance and push the price back into the support area. ✅ In summary: This is a short trade setup on COTI/USDT, where the trader enters around 0.0330, sets a stop at 0.03488, and targets 0.03043. The setup relies on price rejecting resistance and continuing the downtrend toward support.
ULYSSESTRADER
پیشنهاد خرید RNDR: ورود به موقعیت لانگ با ریسک به ریوارد عالی ۲.۲ به ۱
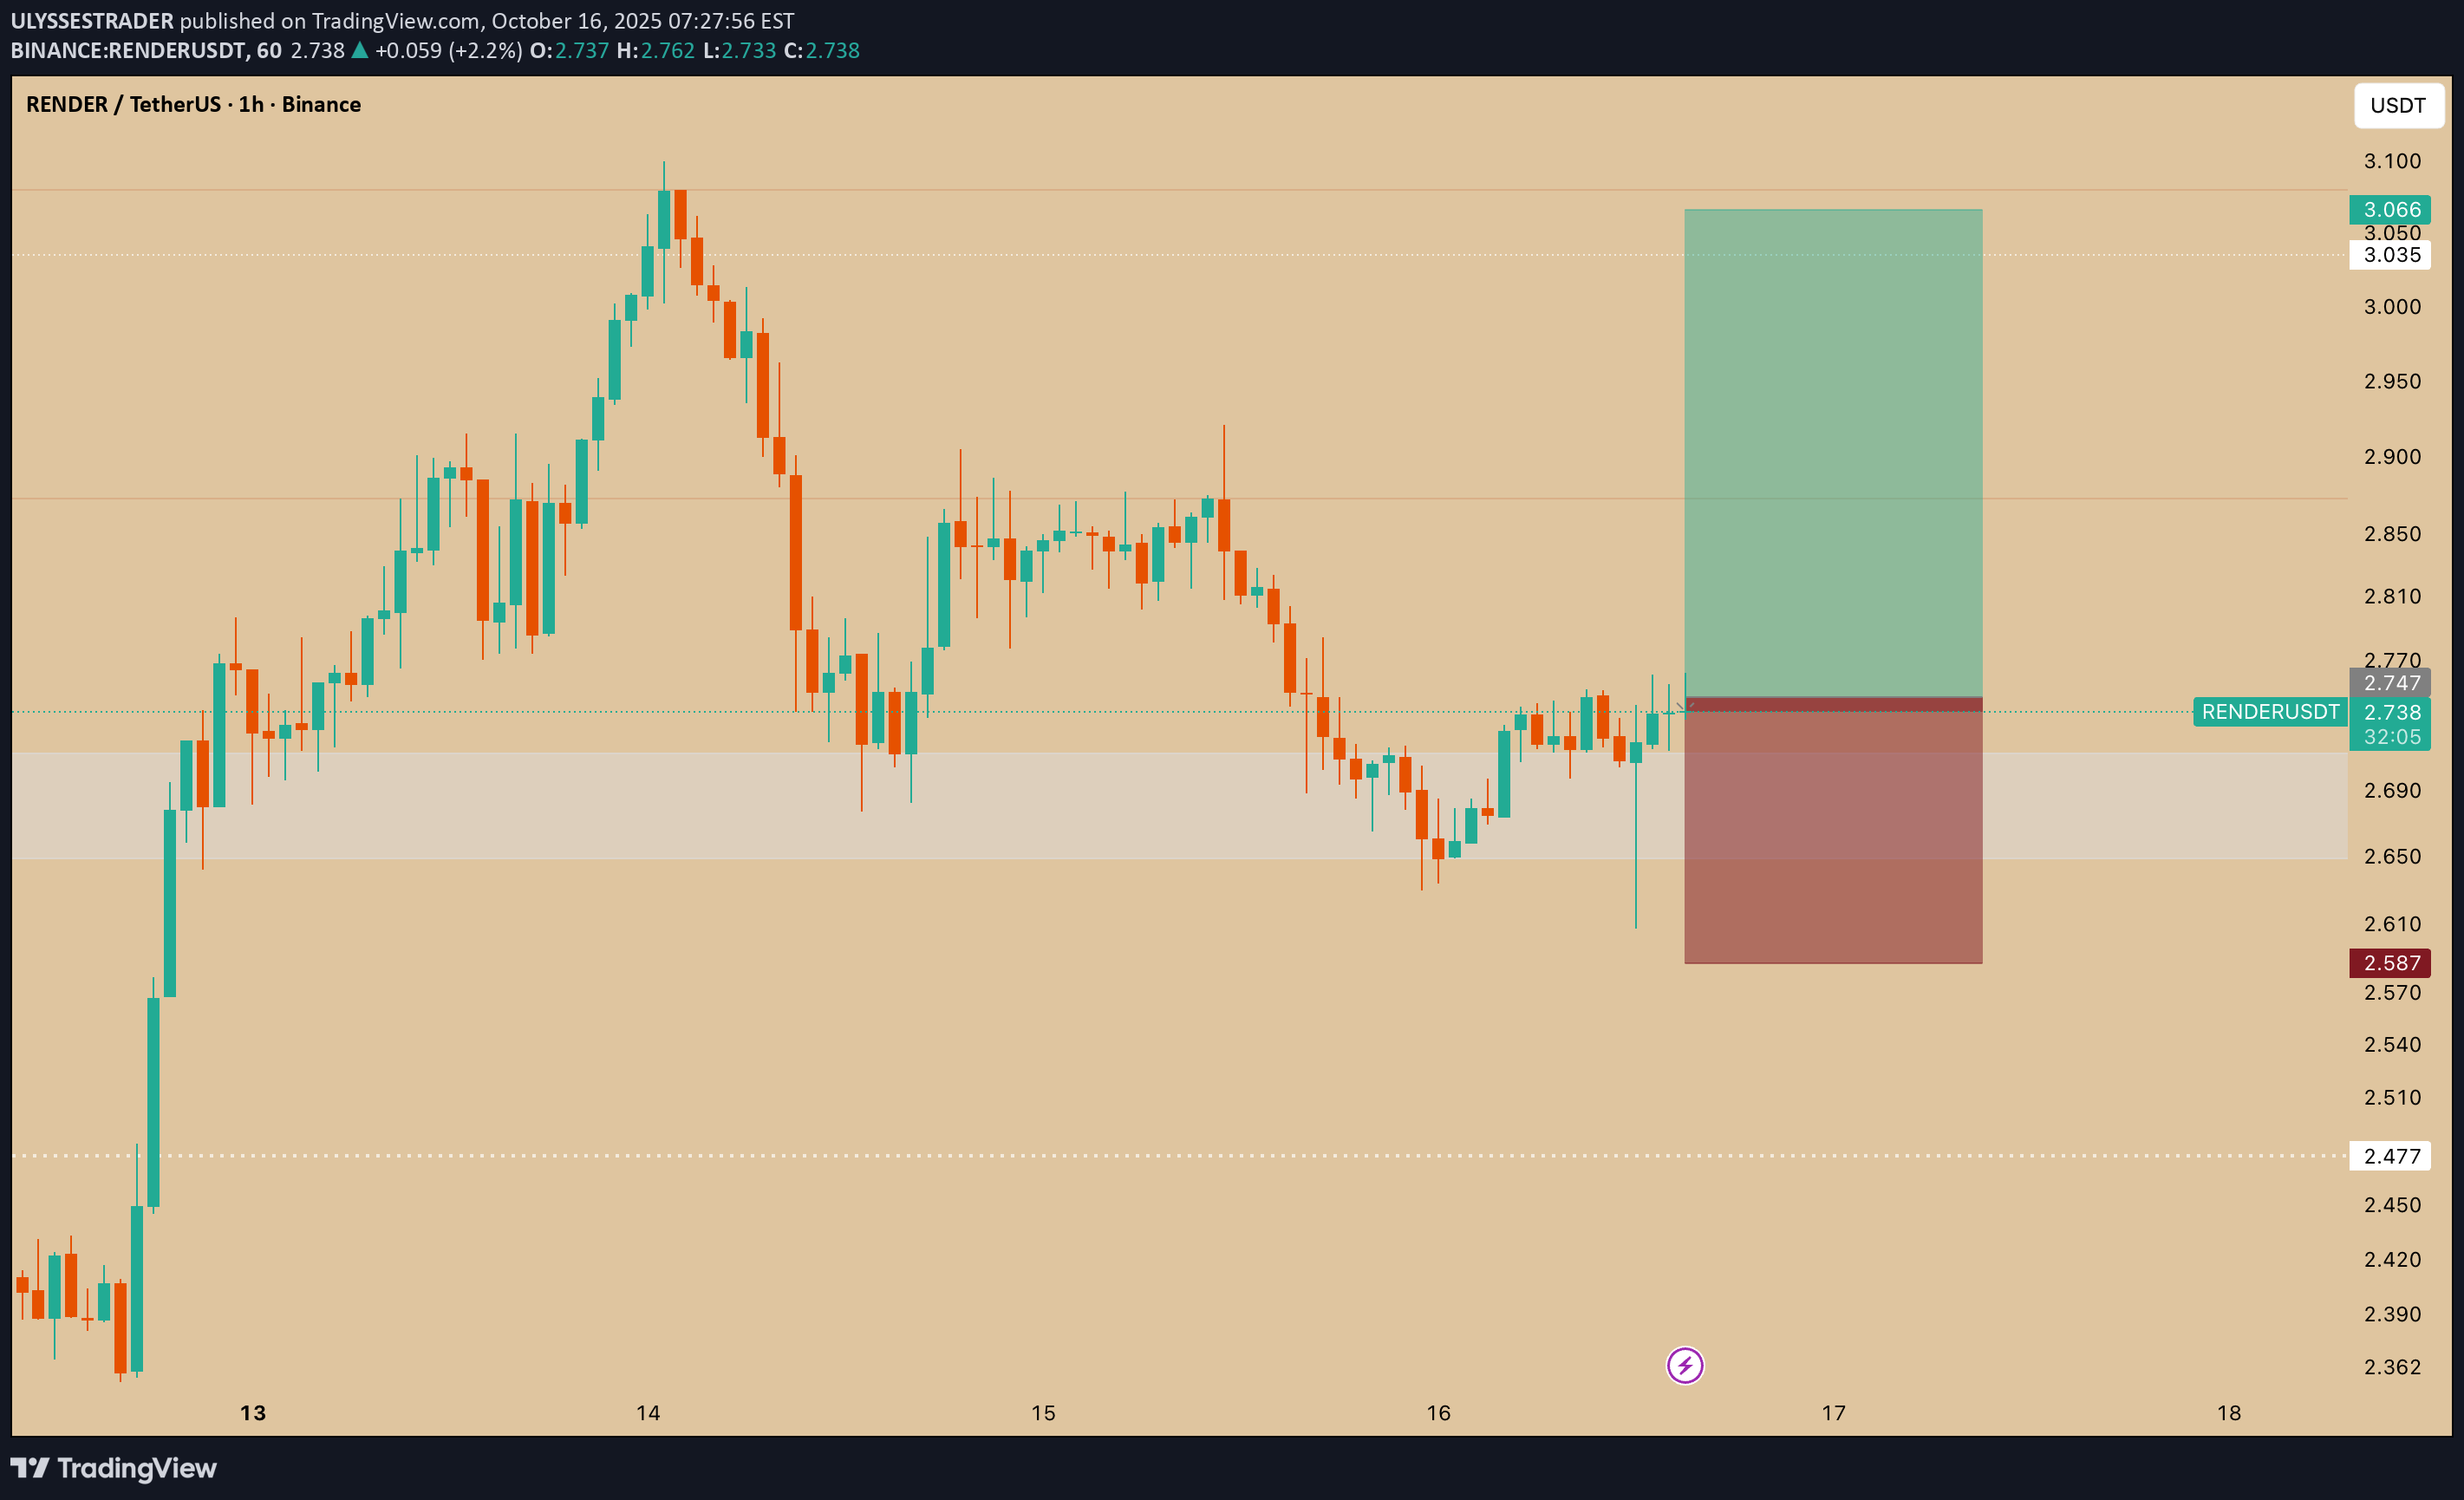
1. Chart Context Pair: RNDR/USDT Timeframe: 1h Current Price: ≈ 2.737 USDT Market has recently consolidated after a decline and is showing support holding near the 2.65–2.70 zone. 2. Trade Setup This is a long position (betting on price going higher). The green/red box represents the risk/reward structure: Entry Zone: ~2.73–2.74 USDT (current price, near support). Stop Loss (SL): 2.587 USDT (bottom of the red box). If price falls below this, the setup is invalidated. Take Profit (TP): 3.066 USDT (top of the green box). Target is a move back toward recent resistance near 3.05+. 3. Risk/Reward Ratio Risk (SL distance): ~0.15 USDT Reward (TP distance): ~0.33 USDT R:R ratio ≈ 2.2:1 This is a strong setup with more than double the potential reward versus risk. 4. Support & Resistance Support Zone: 2.65–2.70 (highlighted grey area below entry). Price has bounced here multiple times. Resistance Zone: 3.05–3.10 (upper target zone). Price may stall or reverse here.
ULYSSESTRADER
سیگنال خرید ARKM: ورود در حمایت و هدفگیری سود ۴۲ سنت!
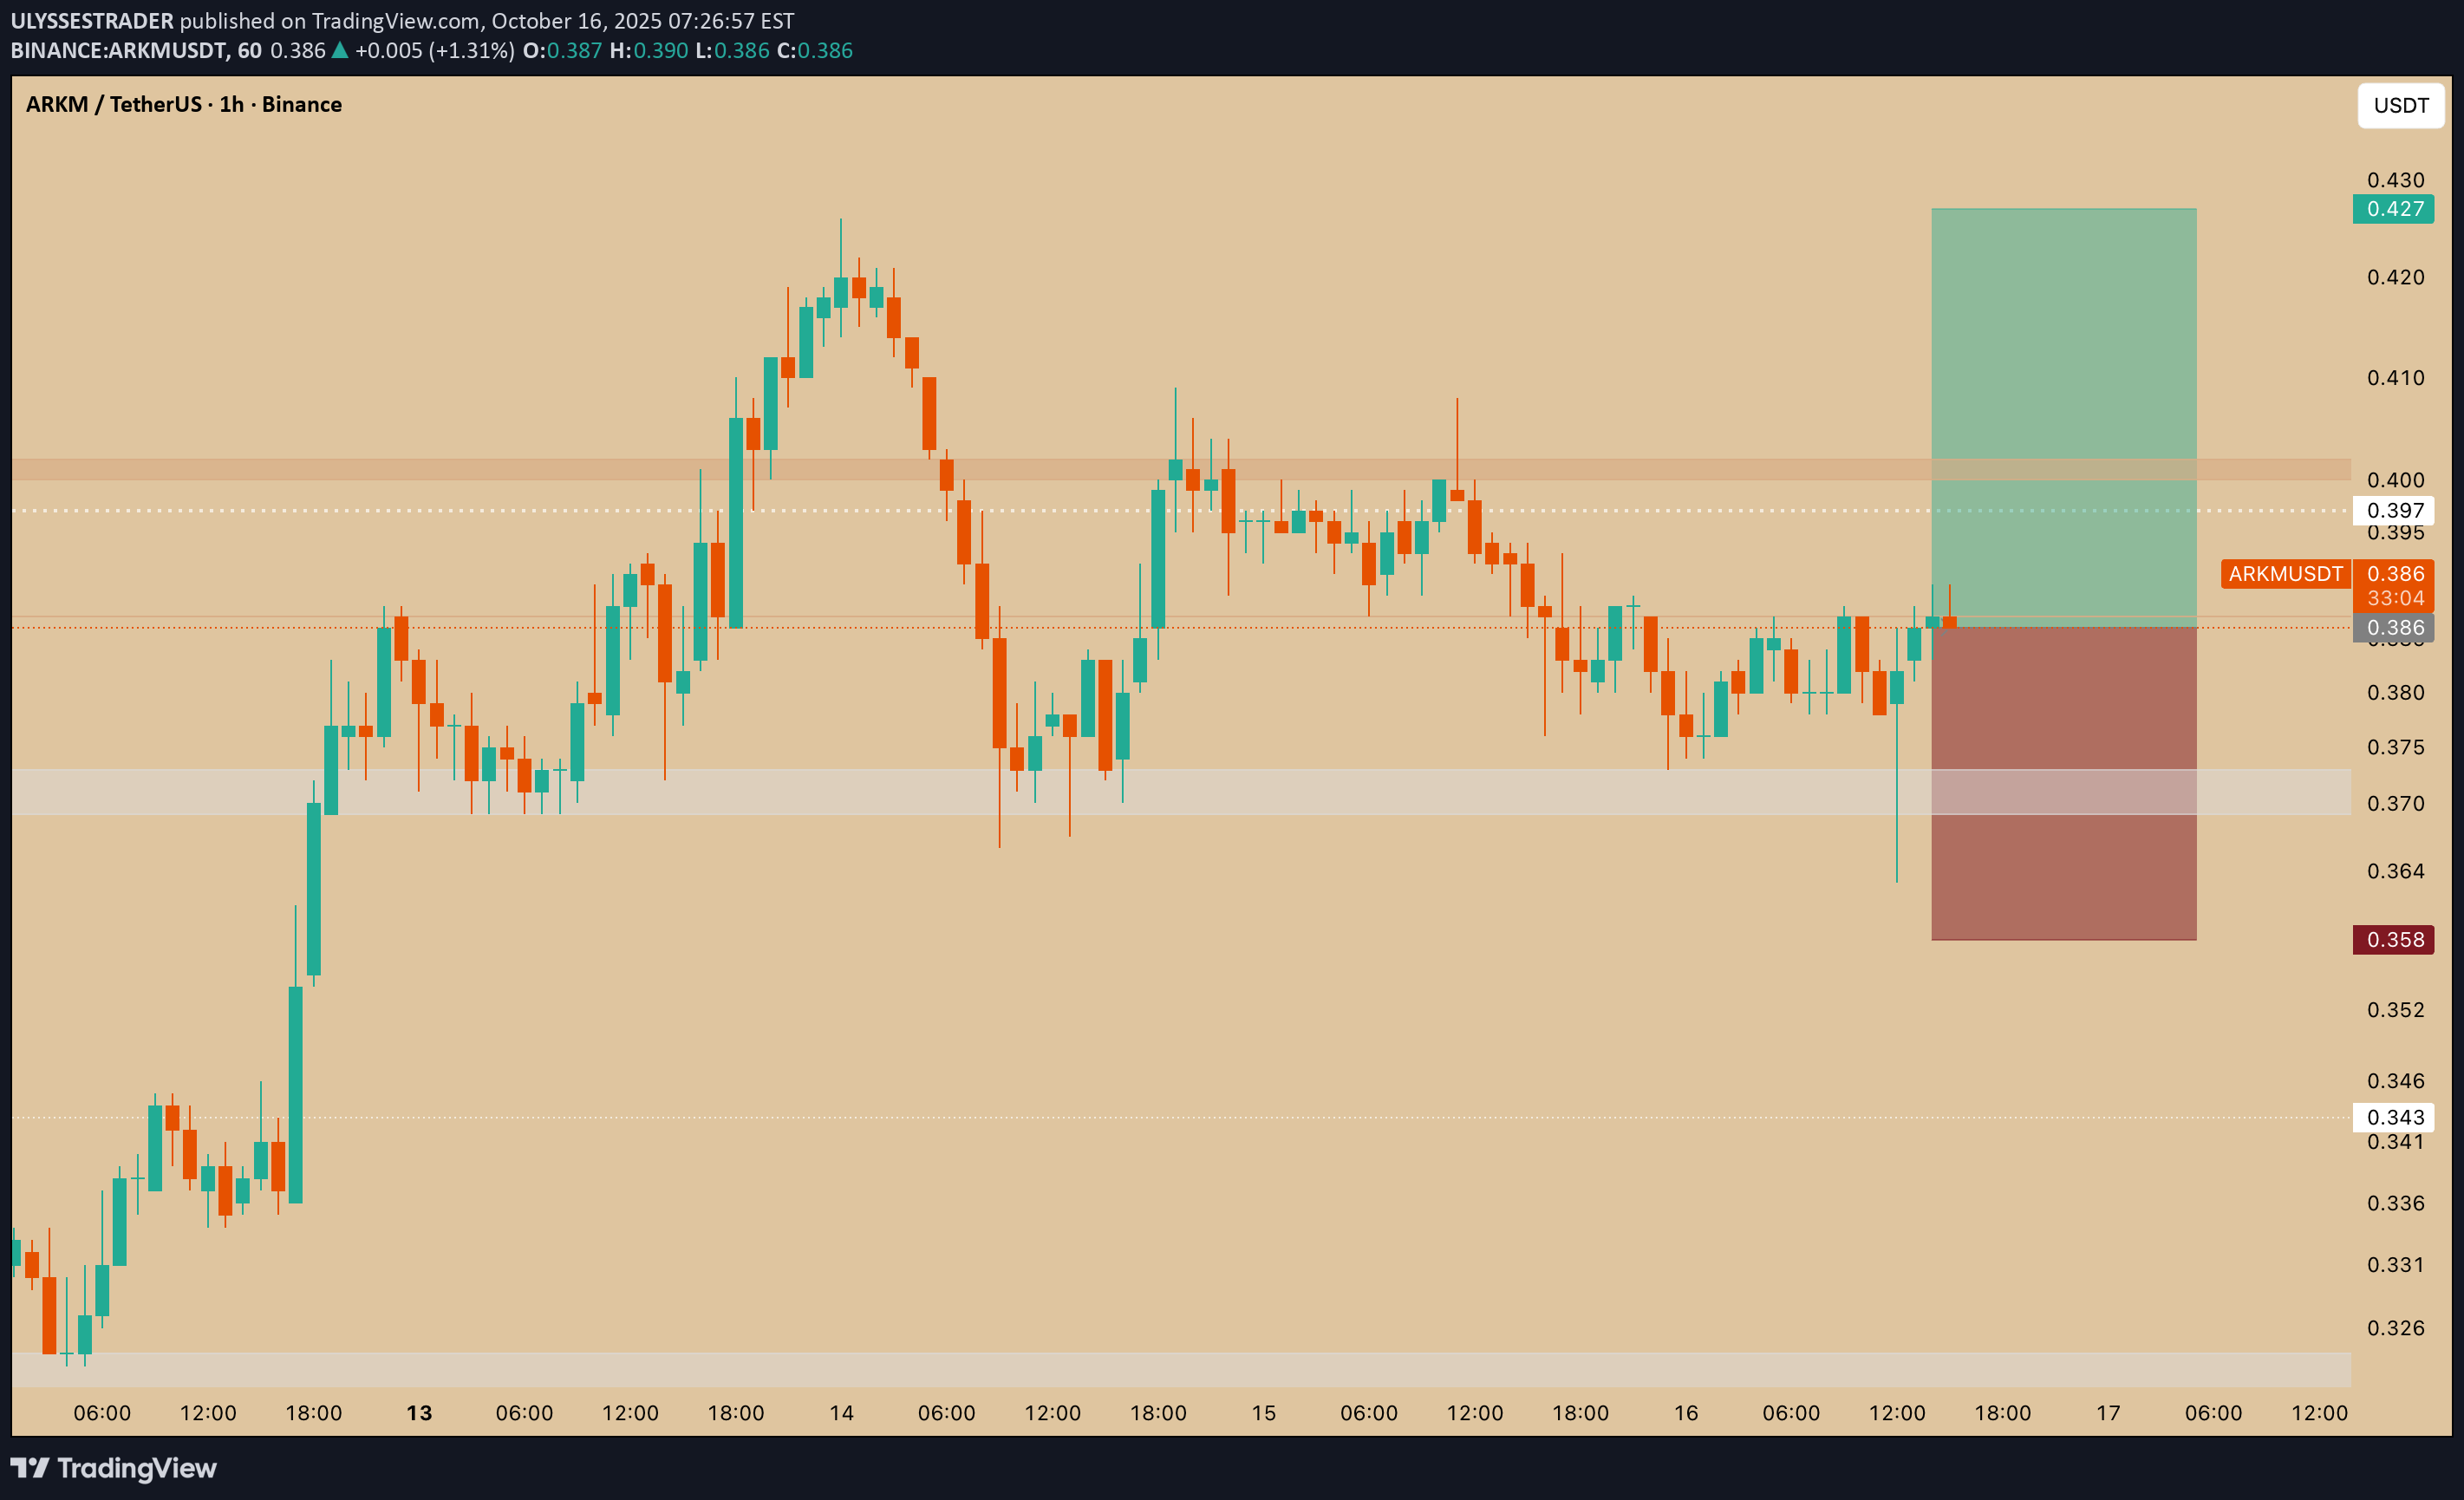
1. Chart Context Pair: ARKM/USDT Timeframe: 1h Current Price: ≈ 0.386 USDT The market has recently consolidated after a drop and is showing signs of holding support. 2. Trade Setup This is a long position (expecting price to rise). The colored box (green/red) represents the Risk/Reward (R:R) setup: Entry Zone: Around 0.386 USDT (current price sitting at support). Stop Loss (SL): 0.358 USDT (bottom of the red box). If price falls below this support zone, the long trade is invalidated. Take Profit (TP): 0.427 USDT (top of the green box). Targeting a push back to resistance above 0.42. 3. Risk/Reward Ratio Risk (SL distance): ~0.028 USDT Reward (TP distance): ~0.041 USDT R:R ratio ≈ 1.46:1 A solid setup, with more potential reward than risk. 4. Support & Resistance Support Zone: 0.36 – 0.37 (highlighted in light grey below the entry). Price has tested this area and bounced. Resistance Zone: 0.42 – 0.43 (upper target). This is where price may stall or reverse. ✅ In summary: This is a long trade setup on ARKM/USDT, where the trader enters at ~0.386, sets a stop loss below 0.358 (to protect from breakdowns), and targets 0.427. The idea is that the support at 0.36–0.37 will hold and push the price back toward resistance near 0.42+.
ULYSSESTRADER
پیشبینی ریزش بزرگ قیمت FORM/USDT: ورود به معامله فروش (شورت) با ریسک کنترل شده

1. Chart Context Pair: FORM/USDT Timeframe: 1h Current Price: ≈ 0.9868 USDT The market recently dropped from resistance zones and is now retesting. 2. Trade Setup This is a short entry, expecting the price to fall again after rejection: Entry Zone: Around 0.98–0.99 USDT (current consolidation area). Stop Loss (SL): 1.0458 USDT (top of the red box). If the price rises above this, the short setup fails. Take Profit (TP): 0.9191 USDT (bottom of the green box). The trader is targeting the next support level. 3. Risk/Reward Ratio Risk (SL distance): ~0.059 USDT Reward (TP distance): ~0.068 USDT R:R ratio ≈ 1.15:1 A moderate setup, with slightly more reward than risk. 4. Support & Resistance Resistance Zones: 1.05 and higher (price struggled to hold above these levels). Support Zone: Around 0.92 USDT (clear demand zone marked by green box). The trade idea is that price will reject the retest of resistance and return to support.
ULYSSESTRADER
تحلیل تکنیکال فوری: فرصت فروش (شورت) جذاب در IMX/USDT با ریسک به ریوارد عالی!
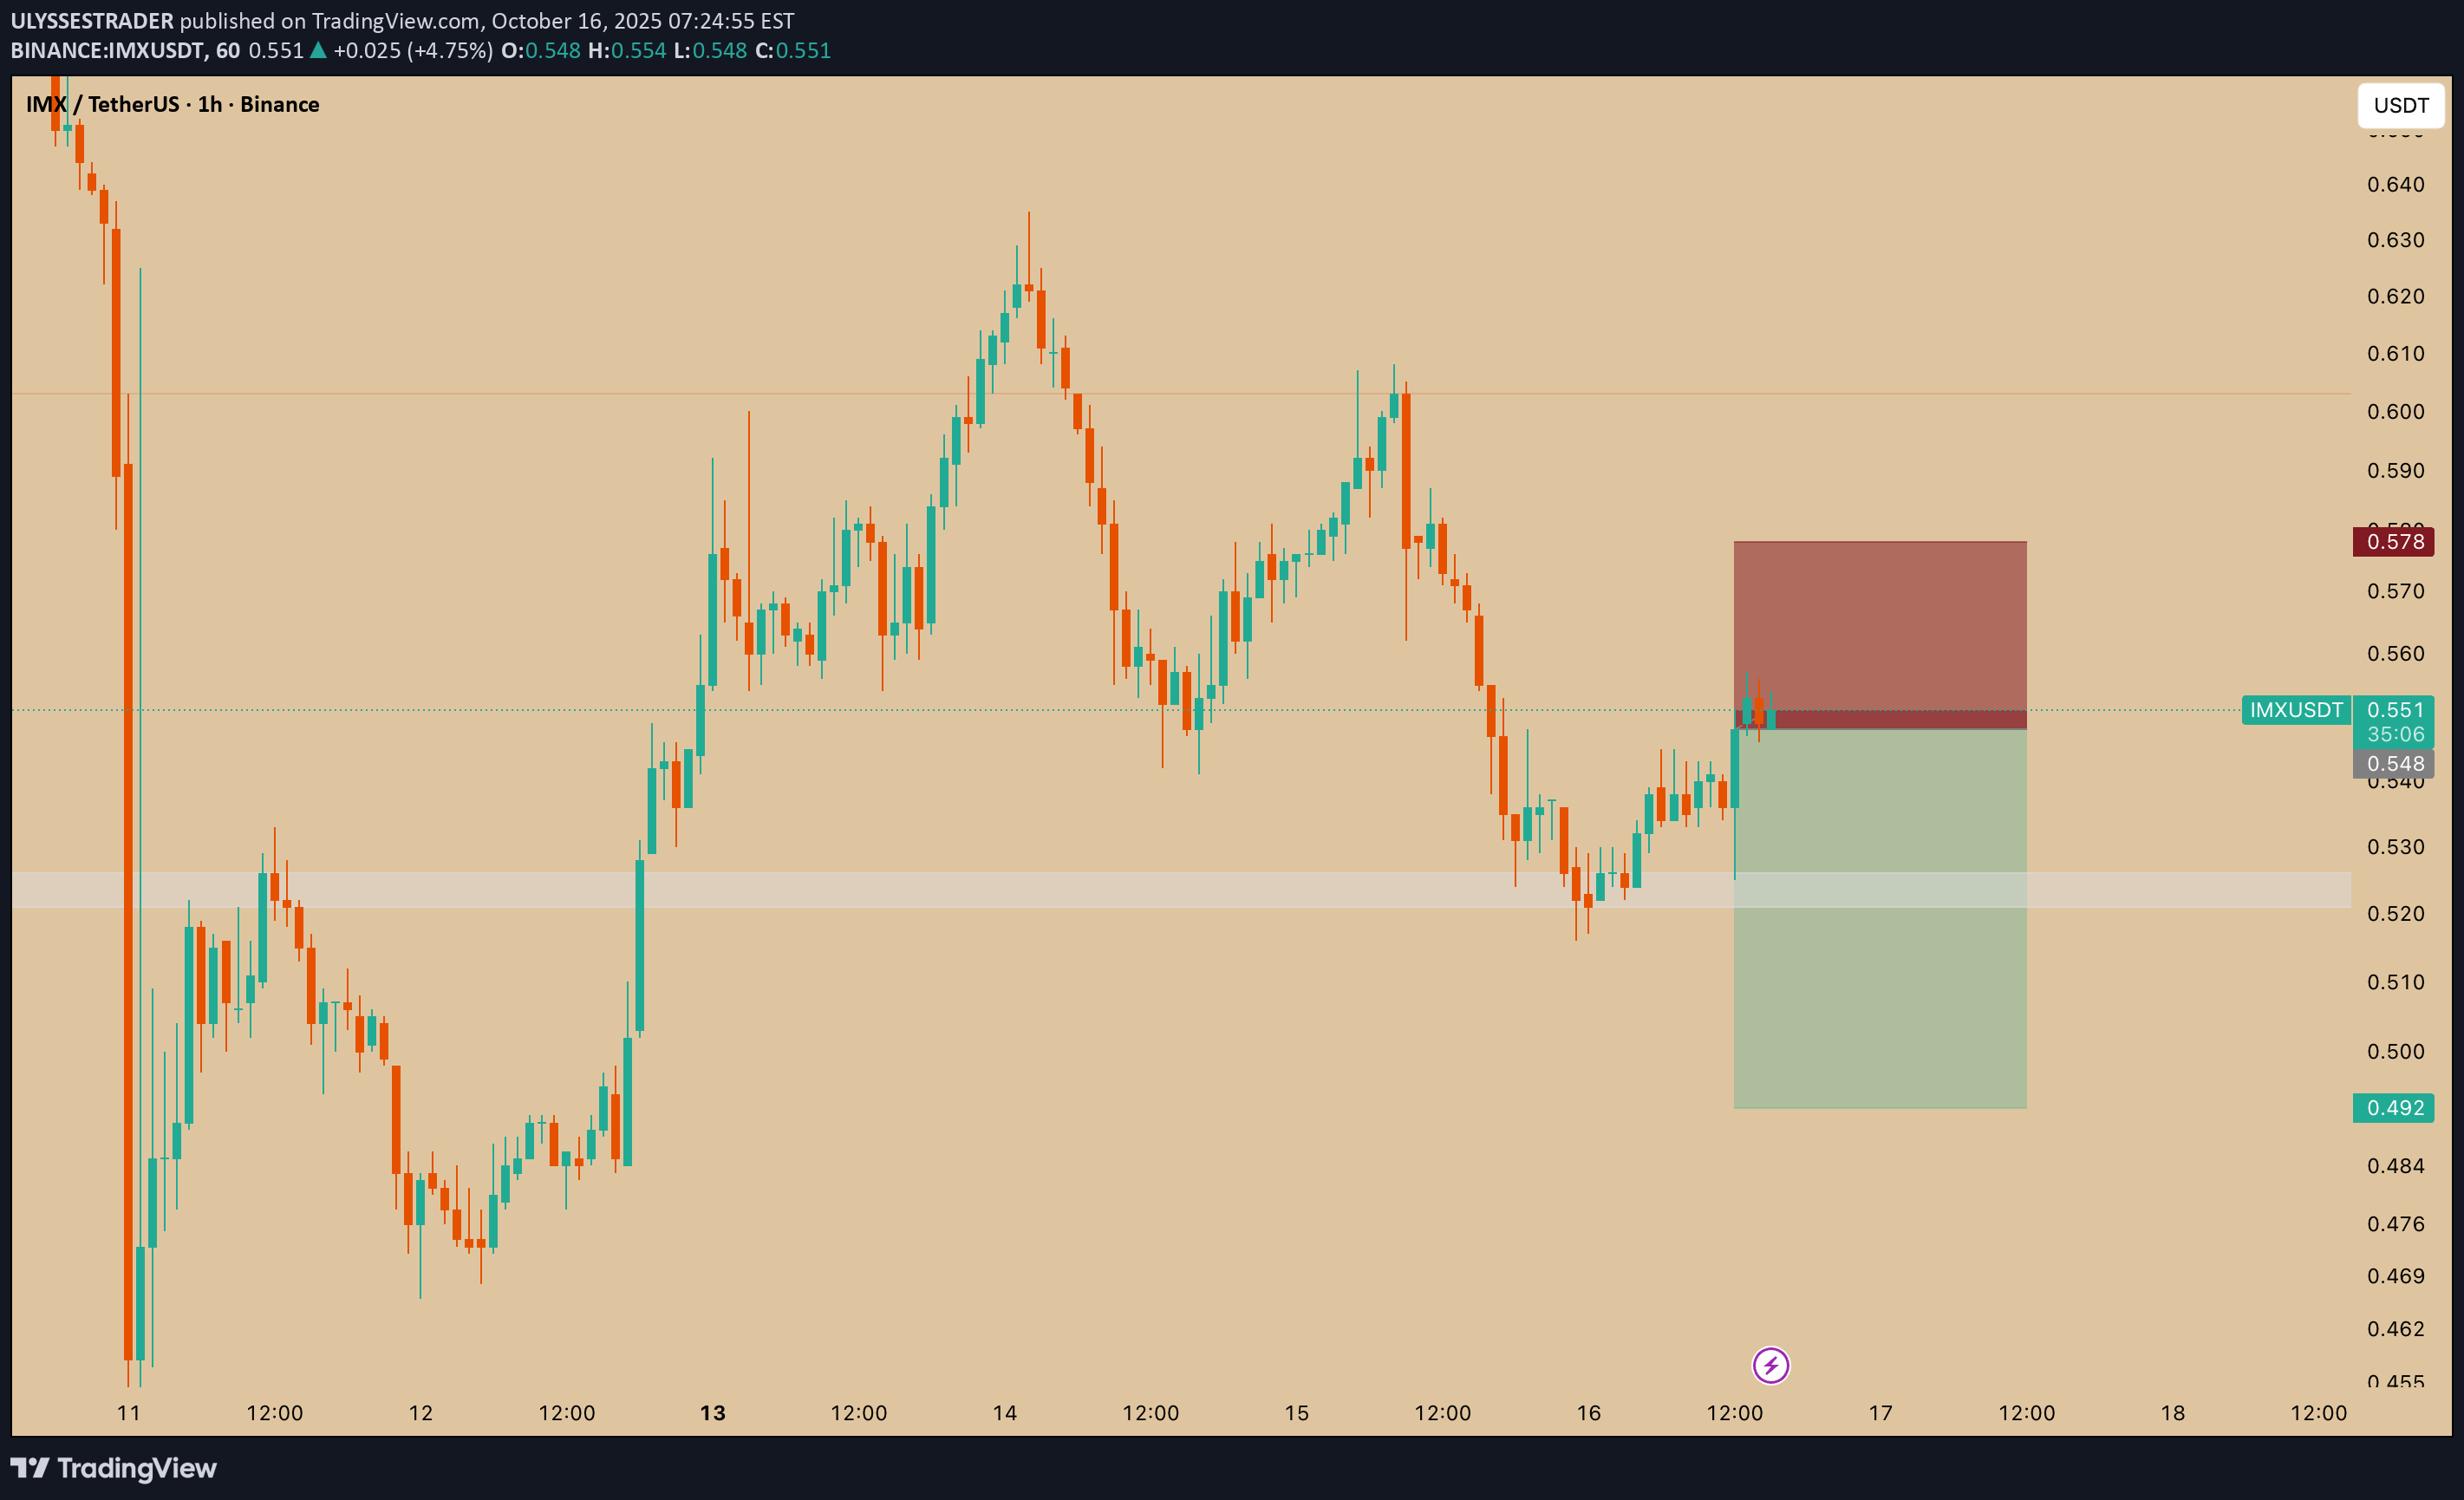
1. Chart Context Pair: IMX/USDT Timeframe: 1h Current Price: ≈ 0.551 USDT Market sentiment: Price recently failed to create new highs and is now retesting a resistance zone. 2. Trade Setup The highlighted red/green zone represents the short trade idea: Entry Zone: Around 0.551 USDT (current price at resistance). Stop Loss (SL): 0.578 USDT (top of the red box). If price goes above this, the short idea is invalidated. Take Profit (TP): 0.492 USDT (bottom of the green box). Targeting a drop back into support. 3. Risk/Reward Ratio Risk (SL distance): ~0.027 USDT Reward (TP distance): ~0.059 USDT R:R ratio ≈ 2.18:1 This is a favorable setup, offering more than 2x reward compared to risk. 4. Support & Resistance Resistance Zone: 0.55 – 0.57 (price rejected here earlier). Support Zone: Around 0.49 – 0.52 (highlighted in the green zone). The trader expects sellers to step in at resistance and push price back down toward support. ✅ In summary: This is a short position on IMX/USDT where the trader enters at ~0.55, places a stop loss at 0.578, and aims for 0.492. The risk/reward is strong (≈2:1), based on the idea that resistance will hold and price will drop back into the support zone.
ULYSSESTRADER
پیشبینی ریزشی فوری بیت کوین: فرصت شورت BNB/USDT با ریسک کم!
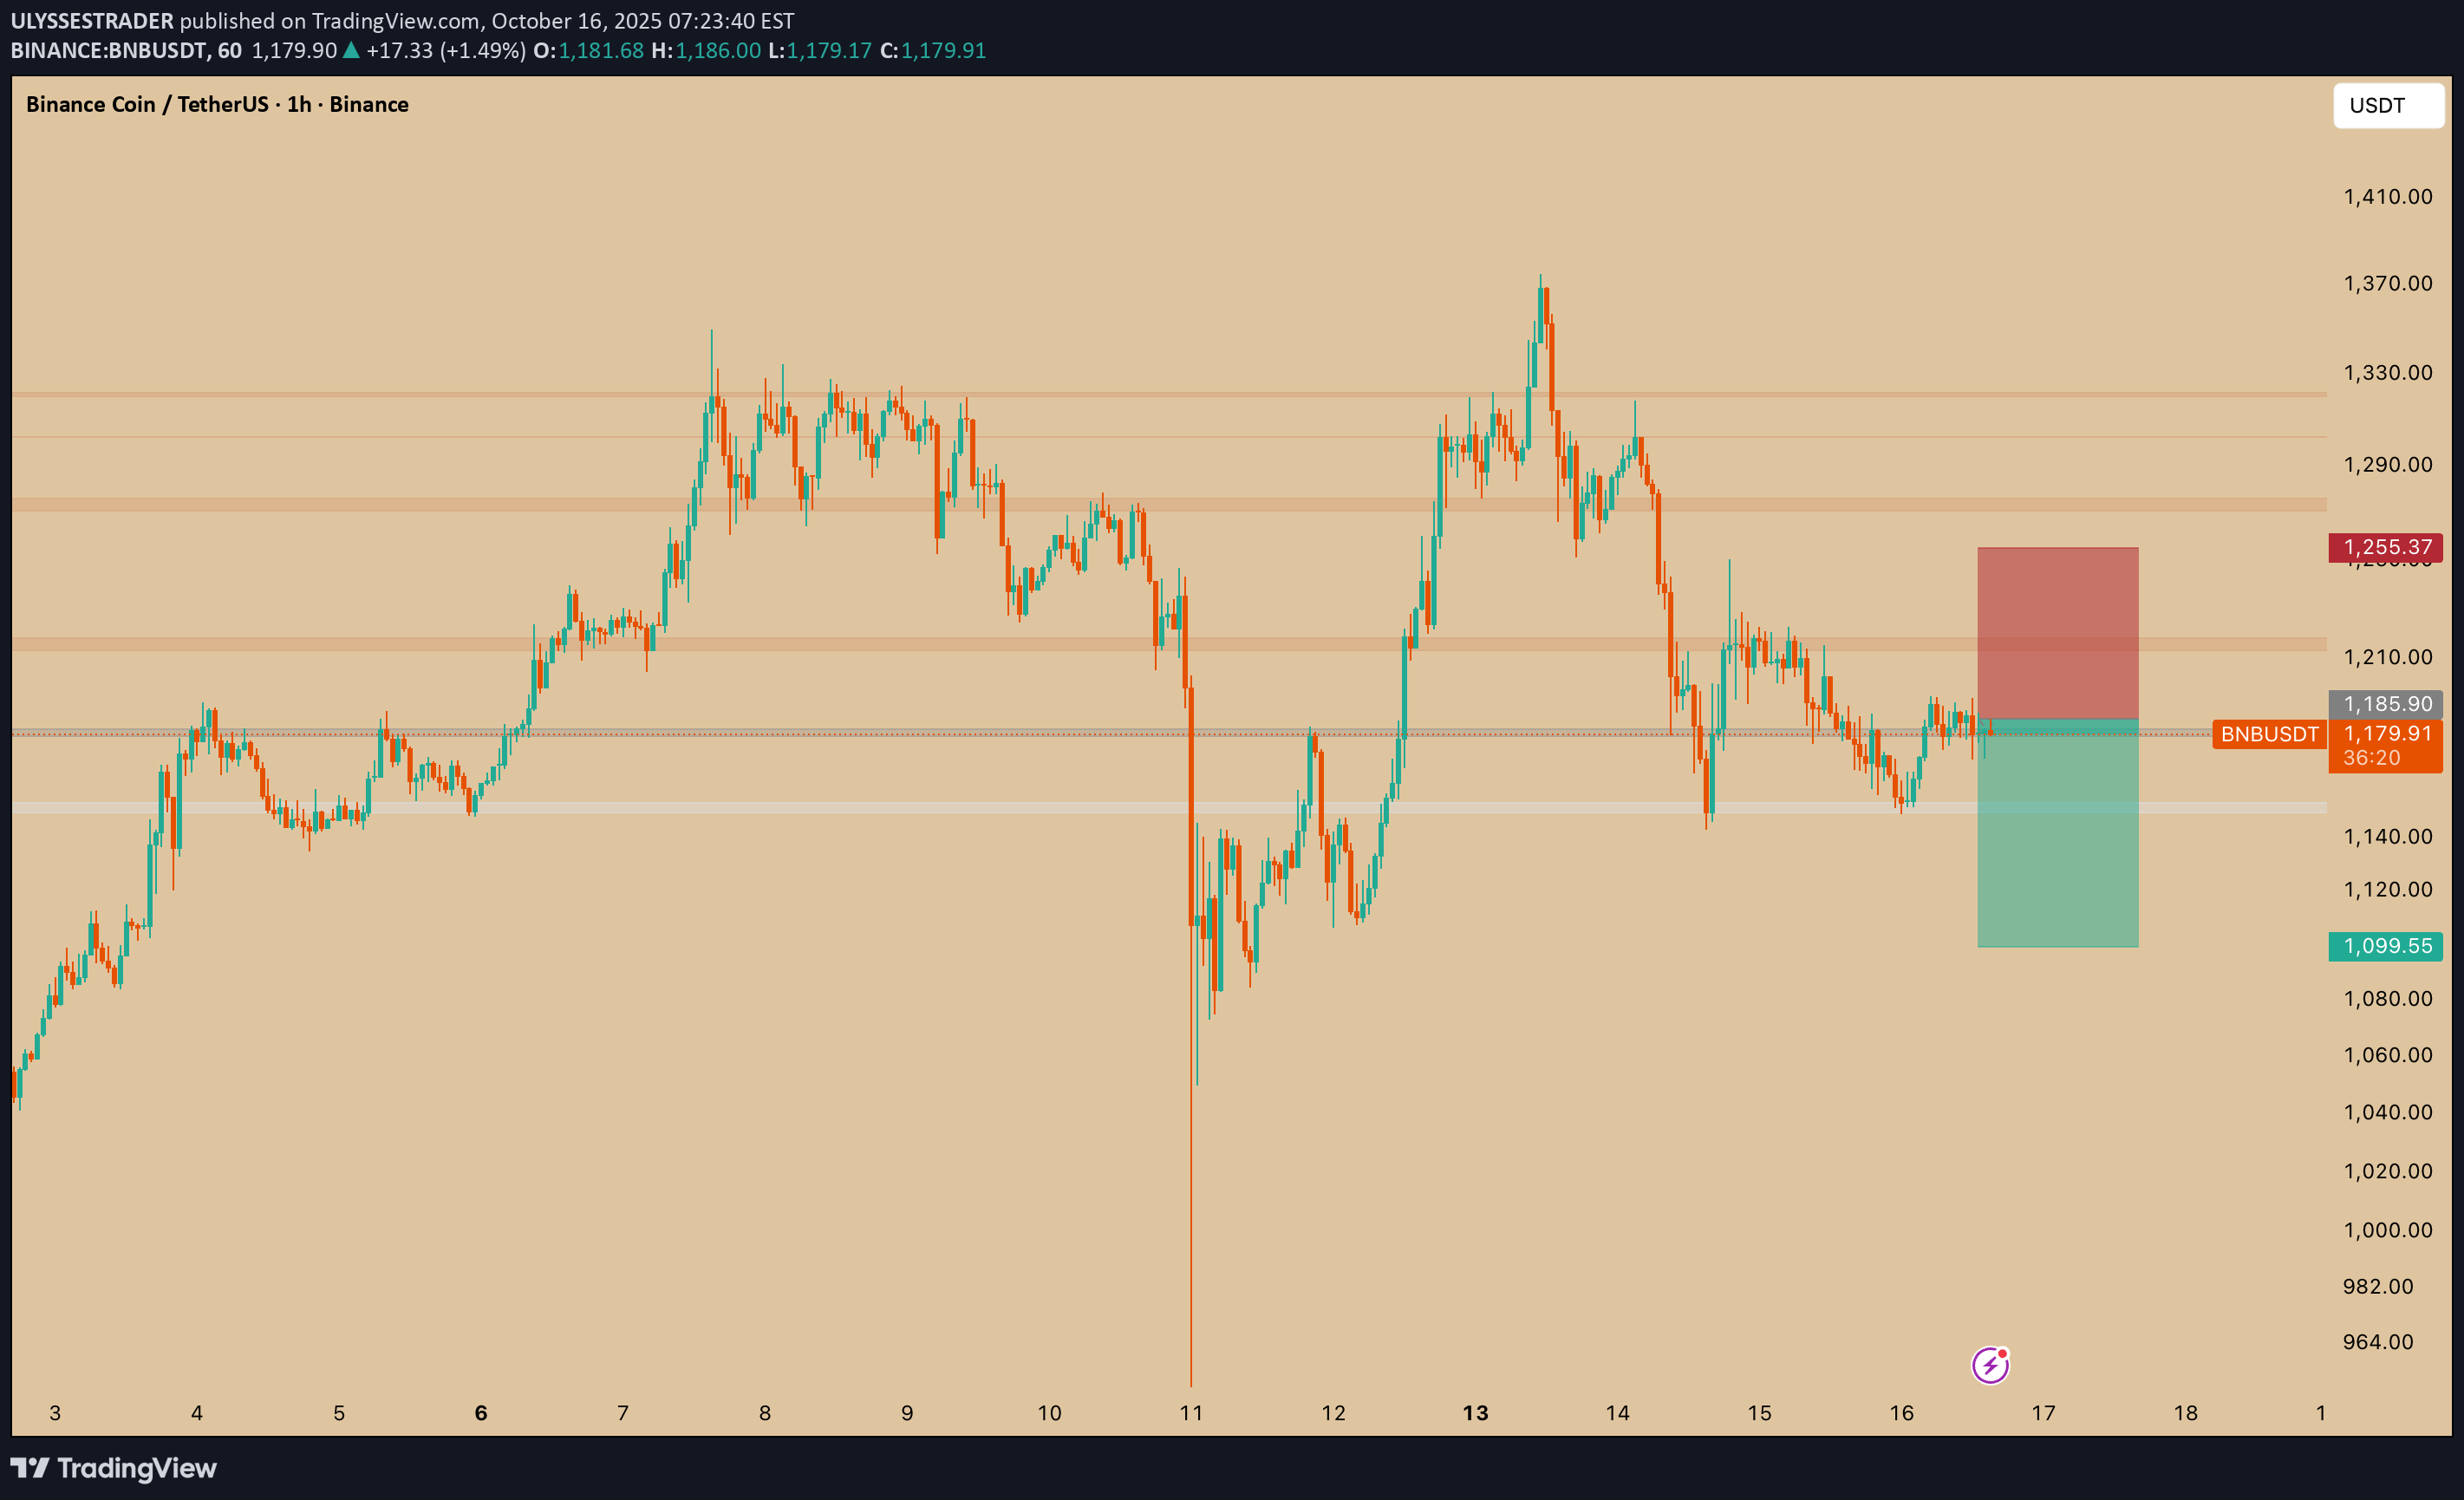
1. Chart Context Pair: BNB/USDT Timeframe: 1h (hourly candles) Current Price: ≈ 1,179.74 USDT Market sentiment: The price recently had a strong drop after failing to sustain higher highs. 2. Trade Setup This is a short position (expecting price to go down). The rectangular red/green box shows the Risk/Reward (R:R) setup: Entry Zone: Around 1,185–1,180 USDT (highlighted where price is consolidating). Stop Loss (SL): At 1,255.37 USDT (the top of the red zone). If price goes above this, the short trade idea is invalidated. Take Profit (TP): At 1,099.55 USDT (the bottom of the green zone). This is the target where the trader expects price to fall. 3. Risk/Reward Ratio Risk (SL distance): ~75 USDT Reward (TP distance): ~86 USDT R:R ratio ≈ 1.15:1 This is a modest but positive risk/reward setup. 4. Support and Resistance Resistance Zone: 1,200–1,250 (price failed to break above here multiple times). Support Zone: Around 1,100 (where the green box ends). The trade is based on price rejecting the resistance and heading back down toward support. ✅ In summary: This is a short trade on BNB/USDT where the trader bets the price will reject resistance (~1,185) and fall to support (~1,100). Stop loss is placed above resistance at 1,255 to limit risk.
ULYSSESTRADER
ADA/USDT
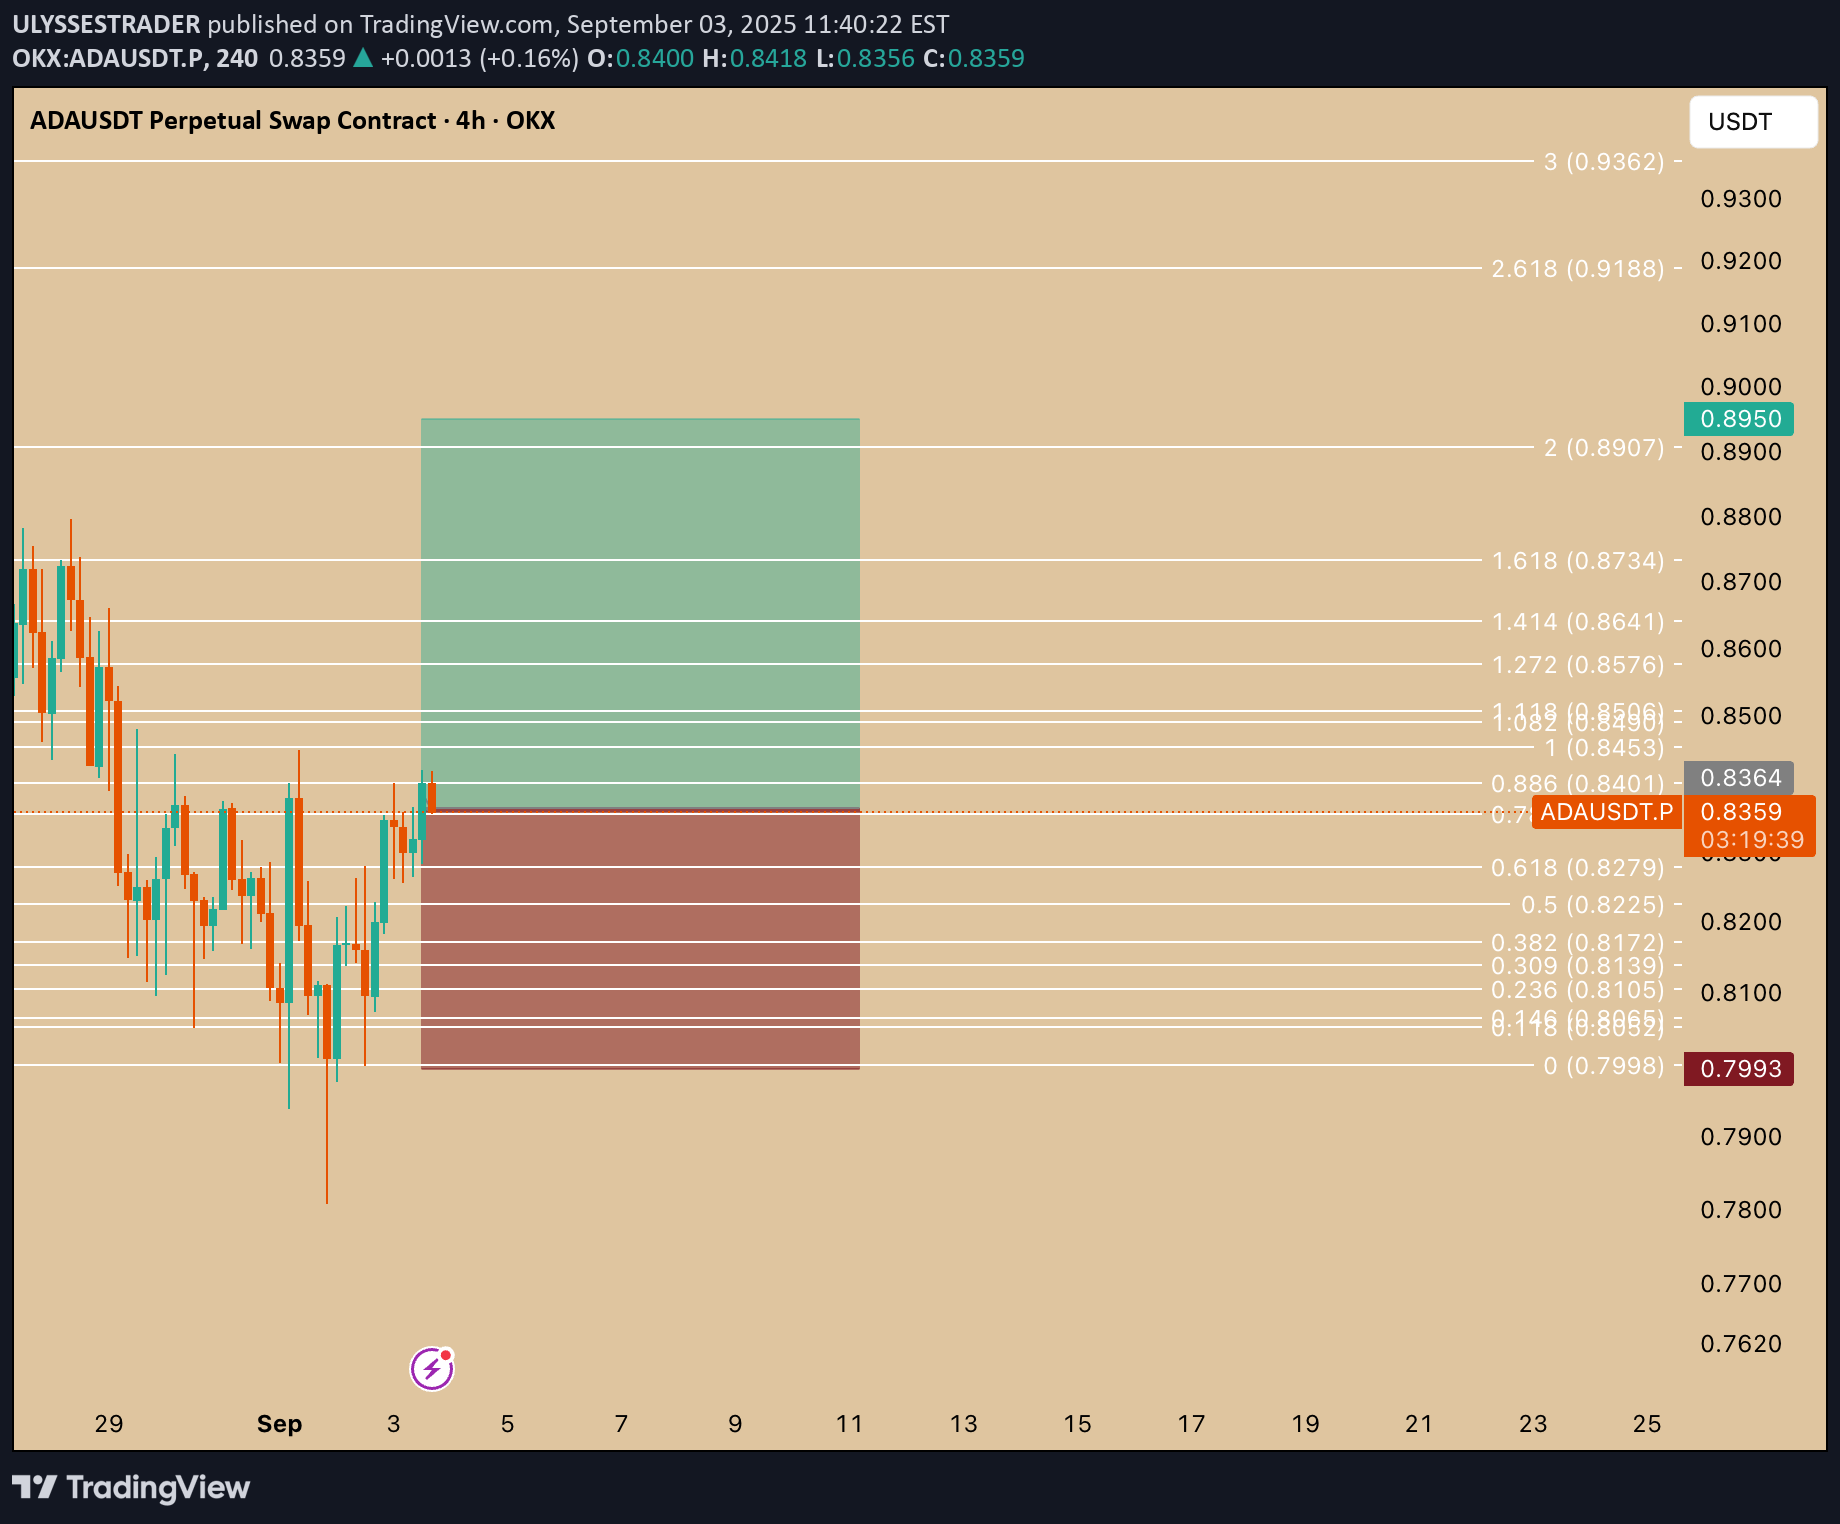
1. Pair and Timeframe Asset: ADA/USDT (Cardano vs. Tether) Timeframe: 4-hour (H4) Exchange: OKX (Perpetual Swap Contract) 2. Chart Tools Used Fibonacci retracement & extension levels: Drawn across a recent move to identify potential support, resistance, and target areas. Risk-to-reward setup: Green (take profit zone) and red (stop loss zone) box mark the trade plan. 3. Trade Setup Entry Zone: Around 0.836 USDT (current price). Stop Loss: Around 0.799 USDT (bottom of red box, just below the 0 Fibonacci level). Take Profit: Around 0.895 USDT (top of green box, close to the 2.0 Fib extension). 4. Idea Behind the Trade Price bounced from the 0.618–0.786 Fib retracement area (a common reversal zone). The trader is betting that ADA will continue upward toward the 1.618 – 2.0 Fibonacci extensions. The risk-to-reward ratio looks favorable (roughly 1:2 or better). 5. Key Levels Support levels: 0.827 (0.618 Fib) 0.810 (0.236 Fib) 0.799 (strong support, stop loss area) Resistance levels / targets: 0.857 (1.272 Fib) 0.873 (1.618 Fib) 0.890 (2.0 Fib, main TP) 0.918+ (extended target if bullish momentum continues) ✅ In summary: This is a long trade setup on ADAUSDT. The trader expects ADA to move higher from ~0.836 toward 0.895 (and possibly beyond), while limiting downside risk with a stop loss below 0.80. The strategy is based on Fibonacci retracement/extension levels and recent price action structure. Do you want me to also calculate the exact risk-to-reward ratio (RRR) for this trade using the entry, stop, and target?
ULYSSESTRADER
WIF/USDT (perpetual swap contract on OKX).

1. Context Pair: WIF/USDT (perpetual swap contract on OKX). Timeframe: 30-minute chart. Current price: around 0.8138 USDT. Indicators: two moving averages are visible: Orange line = shorter-period MA (likely 50 EMA). Blue line = longer-period MA (likely 200 EMA). 2. Trade Setup This chart shows a long (buy) position with defined entry, stop-loss, and take-profit: Entry: Around the breakout level (≈ 0.8138), just above the moving averages. Stop-loss (red box below entry): Around 0.7913–0.8070, protecting against downside if price fails. Take-profit (green box above entry): Around 0.8670–0.8758, aiming for a higher move. 3. Why This Is a Win Long Setup Trend Reversal Attempt: Price had been in a downtrend, but now it has reclaimed both the 50 EMA and 200 EMA — a bullish signal. Golden Cross Potential: The orange MA is curling upwards toward the blue MA, hinting at a bullish cross. Breakout Confirmation: Entry is placed after a strong bullish candle closed above resistance. Risk-to-Reward (R:R): Risk (stop-loss) is small relative to reward (take-profit). Looks like about 1:2 or better R:R, meaning the potential gain is at least twice the risk. 4. Key Notes If price stays above 0.81 and holds the EMAs as support, the trade can play out bullish. If price dips below 0.8070 and 0.7913, the trade invalidates — hence the stop-loss.
Disclaimer
Any content and materials included in Sahmeto's website and official communication channels are a compilation of personal opinions and analyses and are not binding. They do not constitute any recommendation for buying, selling, entering or exiting the stock market and cryptocurrency market. Also, all news and analyses included in the website and channels are merely republished information from official and unofficial domestic and foreign sources, and it is obvious that users of the said content are responsible for following up and ensuring the authenticity and accuracy of the materials. Therefore, while disclaiming responsibility, it is declared that the responsibility for any decision-making, action, and potential profit and loss in the capital market and cryptocurrency market lies with the trader.