
FLOKI
Floki Inu
| تریدر | نوع سیگنال | حد سود/ضرر | زمان انتشار | مشاهده پیام |
|---|---|---|---|---|
 SwallowAcademyRank: 30684 | خرید | حد سود: تعیین نشده حد ضرر: تعیین نشده | 11/26/2025 |
معرفی پروژه فلوکی اینو
Price Chart of Floki Inu
سود 3 Months :
خلاصه سیگنالهای Floki Inu
سیگنالهای Floki Inu
Filter
Sort messages by
Trader Type
Time Frame

CryptoNuclear
FLOKI/USDT – Big Rebound or Structural Breakdown?

Timeframe: 5 Day Market Condition: After a strong parabolic rally, FLOKI has entered a macro correction and distribution phase Price is currently trading at a critical decision zone that will determine whether the macro bullish trend continues or shifts into a bearish structure --- 🟨 Key Support Zone (Yellow Block) 0.0000335 – 0.0000270 This zone represents: Strong historical demand area Previous accumulation base before a major impulsive move High-probability buyer reaction zone The last line of defense for long-term bullish structure As long as price holds above this zone, FLOKI remains structurally bullish on a macro scale. --- 📐 Market Structure & Pattern Analysis 🔹 1. Market Structure Formation of Lower Highs (LH) and Lower Lows (LL) → short-to-mid term downtrend However, no confirmed major support breakdown yet This move is still classified as a deep correction within a larger bullish cycle --- 🔹 2. Supply & Resistance Zones (Dashed Yellow Lines) Key resistance levels: 0.0000730 0.0001125 0.0001380 These zones act as: Major supply areas Former support turned resistance Potential distribution zones if price fails to break above them --- 🔹 3. Price Action Pattern Current structure suggests: Descending structure / falling channel Potential development into: Double Bottom (Bullish Reversal) or Bearish Continuation Breakdown Confirmation depends heavily on price reaction at the key support zone. --- 🟢 Bullish Scenario (Primary Reversal Setup) Key conditions: Strong rejection and sustained price action above 0.0000335 – 0.0000270 Presence of bullish candles with long lower wicks or impulsive moves Bullish progression: 1. Strong rebound from key support 2. Formation of Higher Low (HL) 3. Break of minor structure 4. Upside targets: 🎯 0.0000730 🎯 0.0001125 🎯 0.0001380 📈 Bias: Buy on confirmation and reaction, not blind entries. --- 🔴 Bearish Scenario (Structural Breakdown) Key conditions: Strong 5D candle close below 0.0000270 Lack of meaningful buyer rejection Implications: Macro bullish structure becomes invalid Previous support flips into resistance Potential continuation toward: 0.0000200 Or a full retest of previous macro lows 📉 Bias: Breakdown favors trend continuation to the downside. --- 🧠 Technical Conclusion FLOKI is currently sitting at a macro decision zone The yellow support block is the critical level Price reaction here will define: 🔄 Major bullish reversal or ⛔ Extended bearish continuation > “It’s not about predicting direction, it’s about reacting to confirmation at key levels.” --- ⚠️ Risk Management Note Wait for candle confirmation Avoid emotional entries Always apply proper risk management --- #FLOKI #FLOKIUSDT #CryptoAnalysis #TechnicalAnalysis #PriceAction #SupportResistance #Altcoins #BullishScenario #BearishScenario #TradingView #CryptoTrading #MarketStructure #SupplyDemand

davidjulien369
Long trade
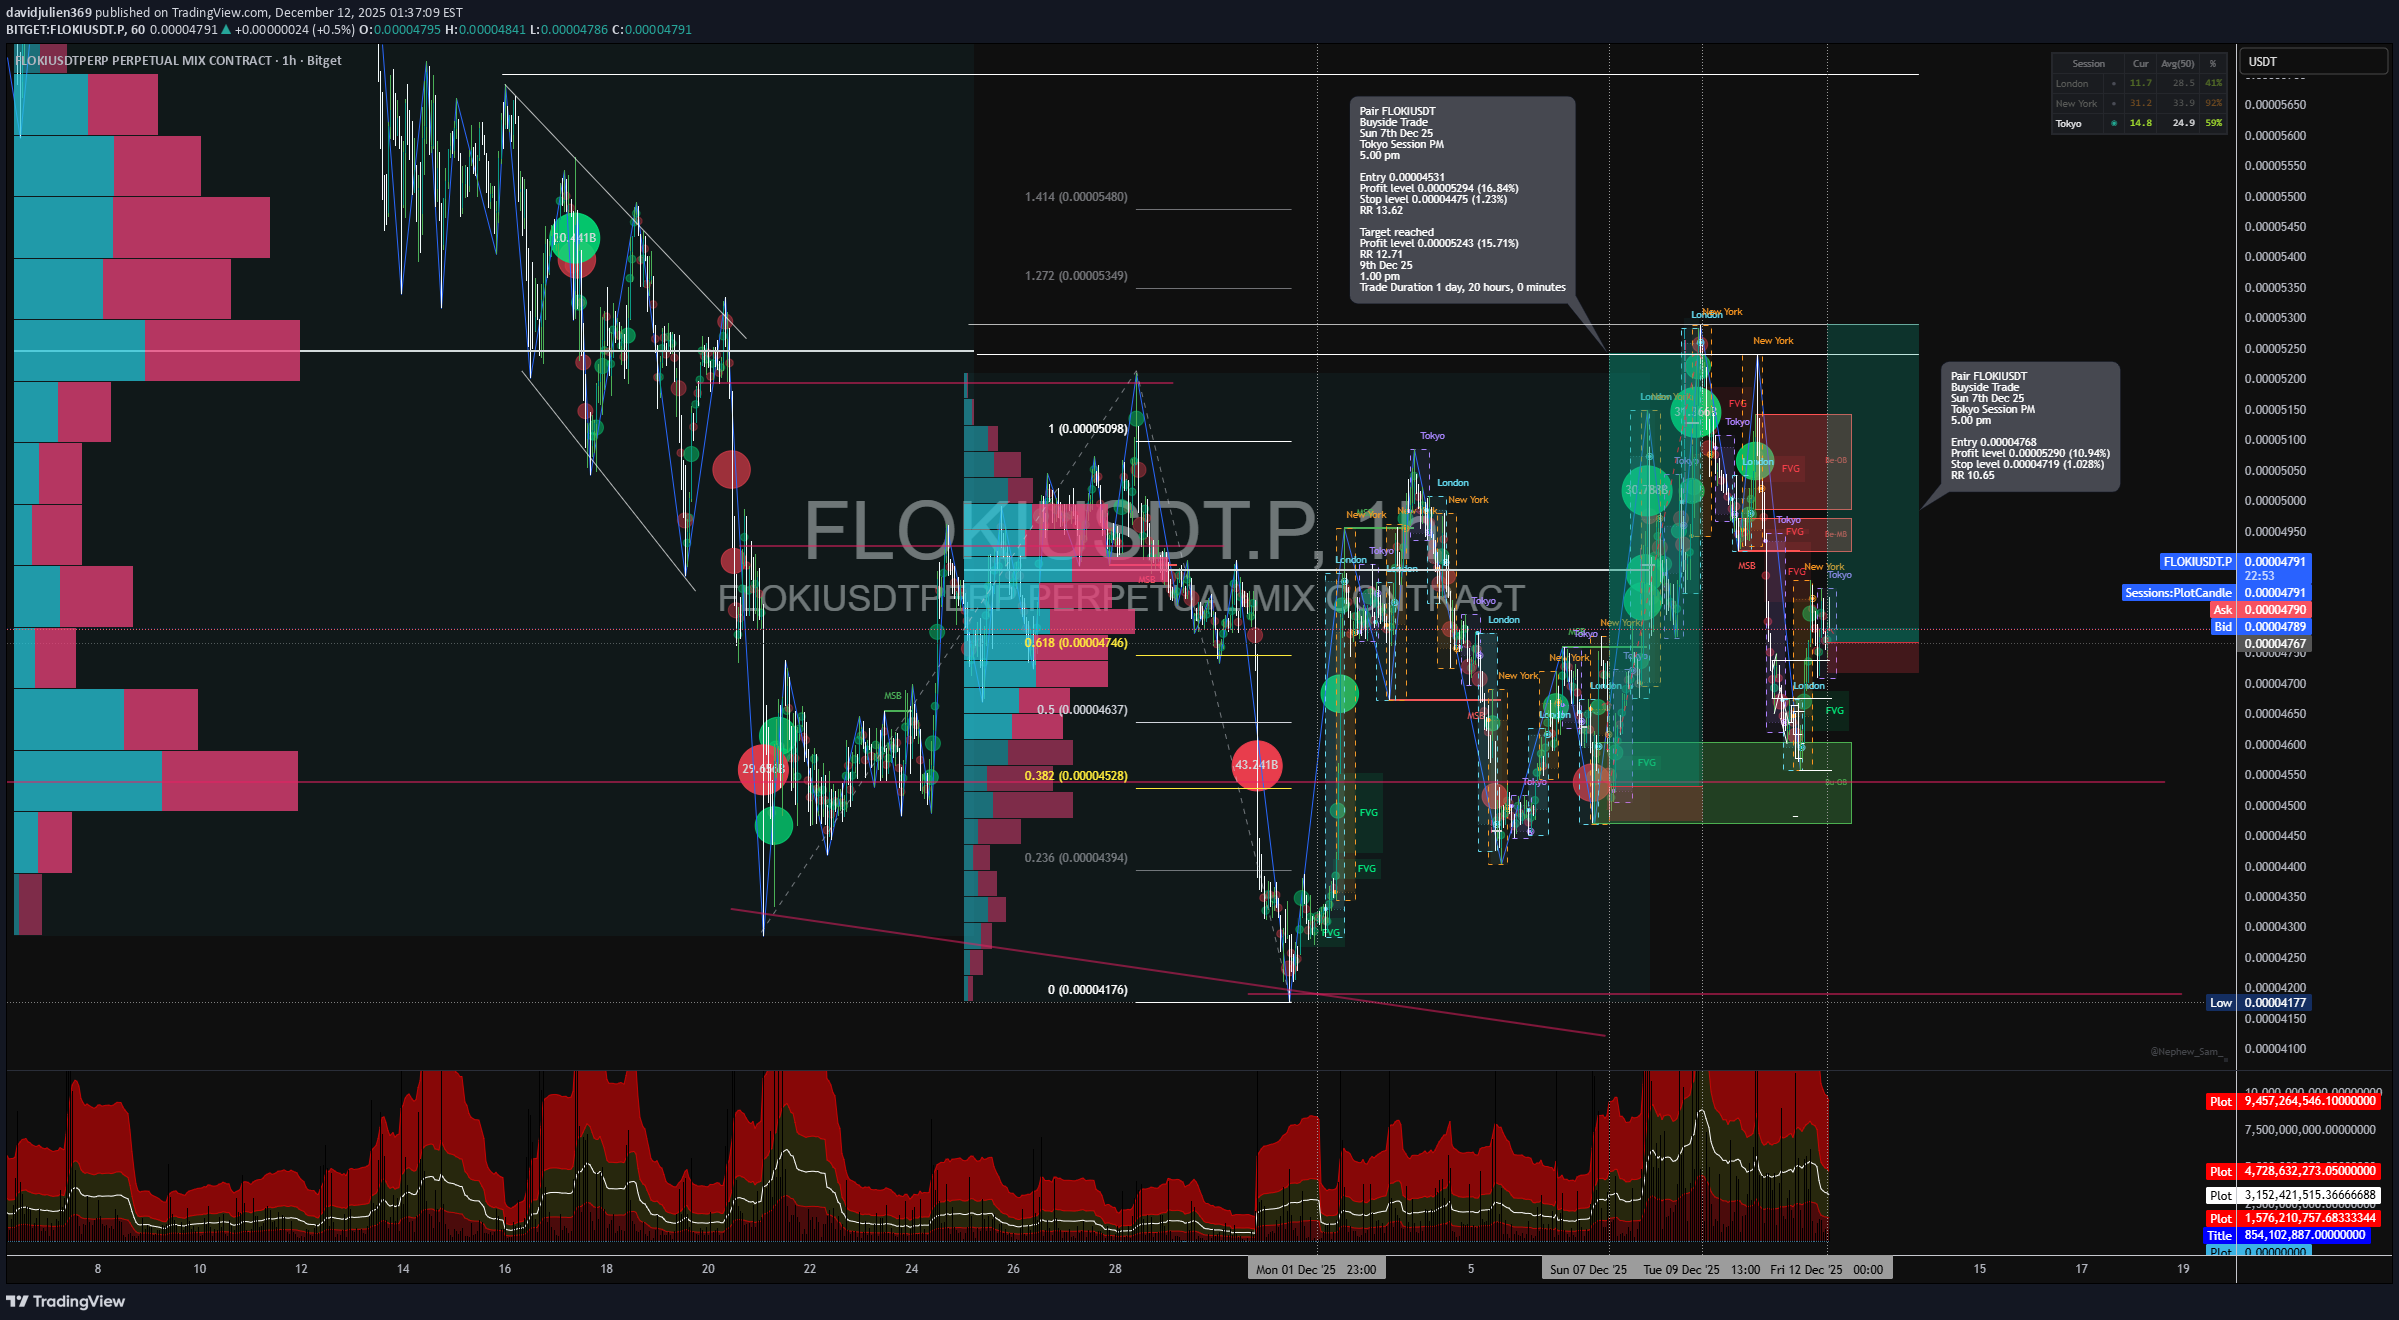
🟢 FLOKIUSDT — Institutional Buyside Expansion Setup (1H) Market: FLOKIUSDT Perpetual Timeframe: 1H Session: Tokyo PM → London → NY 5.00 pm Model: AMD (Accumulation → Manipulation → Distribution) 📌 TRADE DETAILS Type: Buyside Trade Entry: 0.00004768 Stop: 0.00004719 (-1.03%) Target: 0.00005290 (+10.94%) Risk–Reward: 10.65R 🧱 1. STRUCTURAL CONTEXT Price is trading inside a high-confluence discount zone formed after a completed bearish leg. Multiple sell-side liquidity sweeps occurred below 0.000045, followed by structural stabilisation and BOS. Key observations: HTF downtrend paused Sell-side liquidity fully engineered Price re-accepted above key discount Structure transitioned from distribution → re-accumulation 🔁 2. AMD MODEL APPLICATION A-Leg (Accumulation): Repeated liquidity sweeps below prior lows with diminishing downside follow-through. M-Leg (Manipulation): Final spring below demand during low-liquidity session, confirmed by volume expansion. D-Leg (Distribution / Expansion): Clean BOS + FVG formation → controlled pullback → expansion leg initiated. This trade executes inside the early D-Leg. 📊 3. VOLUME SPREAD ANALYSIS (VSA) Stopping volume visible at the lows Wide-spread down bars closing off the lows → absorption Subsequent rallies occurred on lower relative volume (supply exhaustion) No-supply tests confirmed inside demand ✔ VSA supports a markup phase, not continuation lower. 🧠 4. FOOTPRINT & DELTA CONFIRMATION Repeated green delta clusters at the entry zone Buyers absorbing offers on each pullback No stacked red delta at highs (no distribution signal) Delta expansion aligned with BOS ✔ Flow confirms buyside dominance, not retail chasing. 📐 5. FIBONACCI ANCHORING Anchors: High → First BOS Down → Swing Low Confluence: Entry aligned with 0.382–0.5 retracement Expansion targets align with 1.0 → 1.272 extensions Target 0.00005290 sits inside premium liquidity 🧭 6. SESSION LOGIC Tokyo: Accumulation + liquidity build London: Manipulation & BOS New York: Expansion & delivery.Stop reached
davidjulien369
Long trade
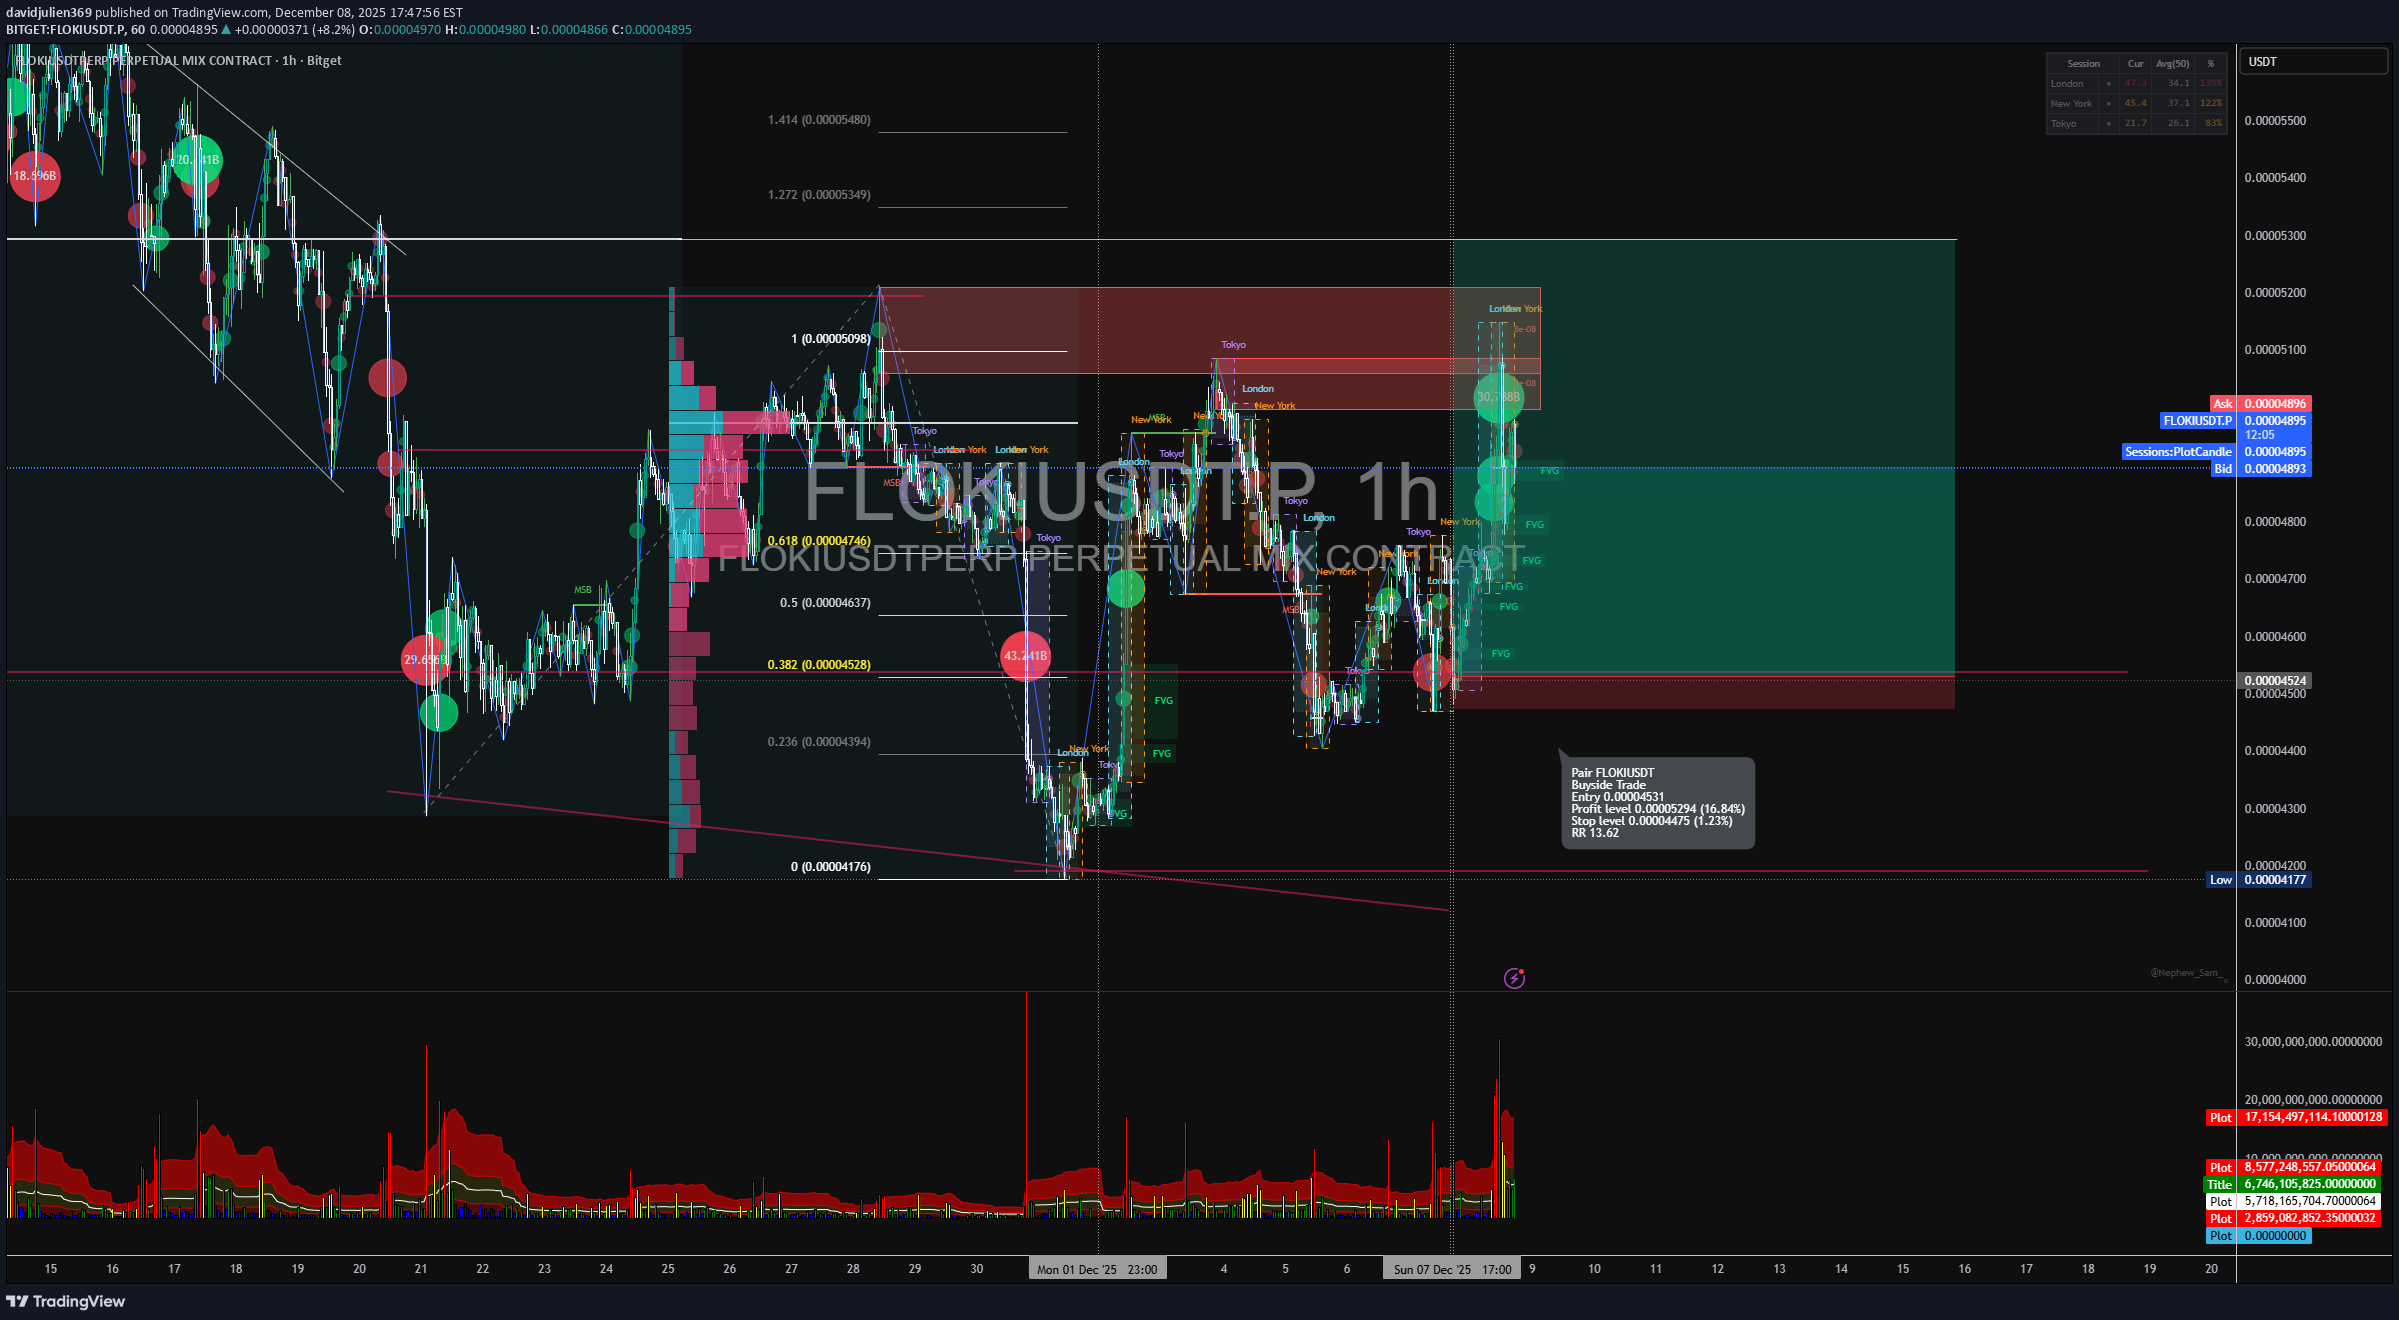
🟦 TAB 1 — TRADE DETAILS Pair: FLOKIUSDT Direction: 🟩 Buy-side Entry: 0.00004531 Take Profit: 0.00005294 (+16.84%) Stop Loss: 0.00004475 (-1.23%) Risk–Reward: 13.62R Session: NY PM 2️⃣ TAB 2 — AMD MODEL ( A-Leg — Accumulation Sell-side liquidity taken at 0.0000417 Volume climax + stopping action Session accumulation across Tokyo → London M-Leg — Manipulation Sharp wick into deep discount Re-test FVG at 0.00004520 Footprint absorption confirms the manipulation phase D-Leg — Distribution / Expansion Now active: 7️⃣ TAB 7 — VOLUME SPREAD ANALYSIS (VSA) High-volume stopping bars at lows No-supply tests before breakout Rising volume on BOS Falling volume on pullback = re-accumulation 1️⃣7️⃣ TAB 17 — MACRO REGIME CONFIRMATION US indices recovering BTC risk-on ETH strength increasing Liquidity rotation into meme assets Volatility compression → expected breakout 1️⃣8️⃣ TAB 18 — BUBBLES VOLUME (DELTA PRO) Current Bubble Read: Large green delta clusters during retest No major red bubbles capping highs Increasing positive delta during markup Volume-normalised bubble expansion → acceleration phase This confirms continuation, not distribution. Bullish Flow = Intact Smart Money = Still buying dips Next Delta Burst Expectation = 0.000049–0.000050
SwallowAcademy
واکنش خریداران به حمایت فلوکی (FLOKI): آیا این کف قیمتی دوام میآورد؟
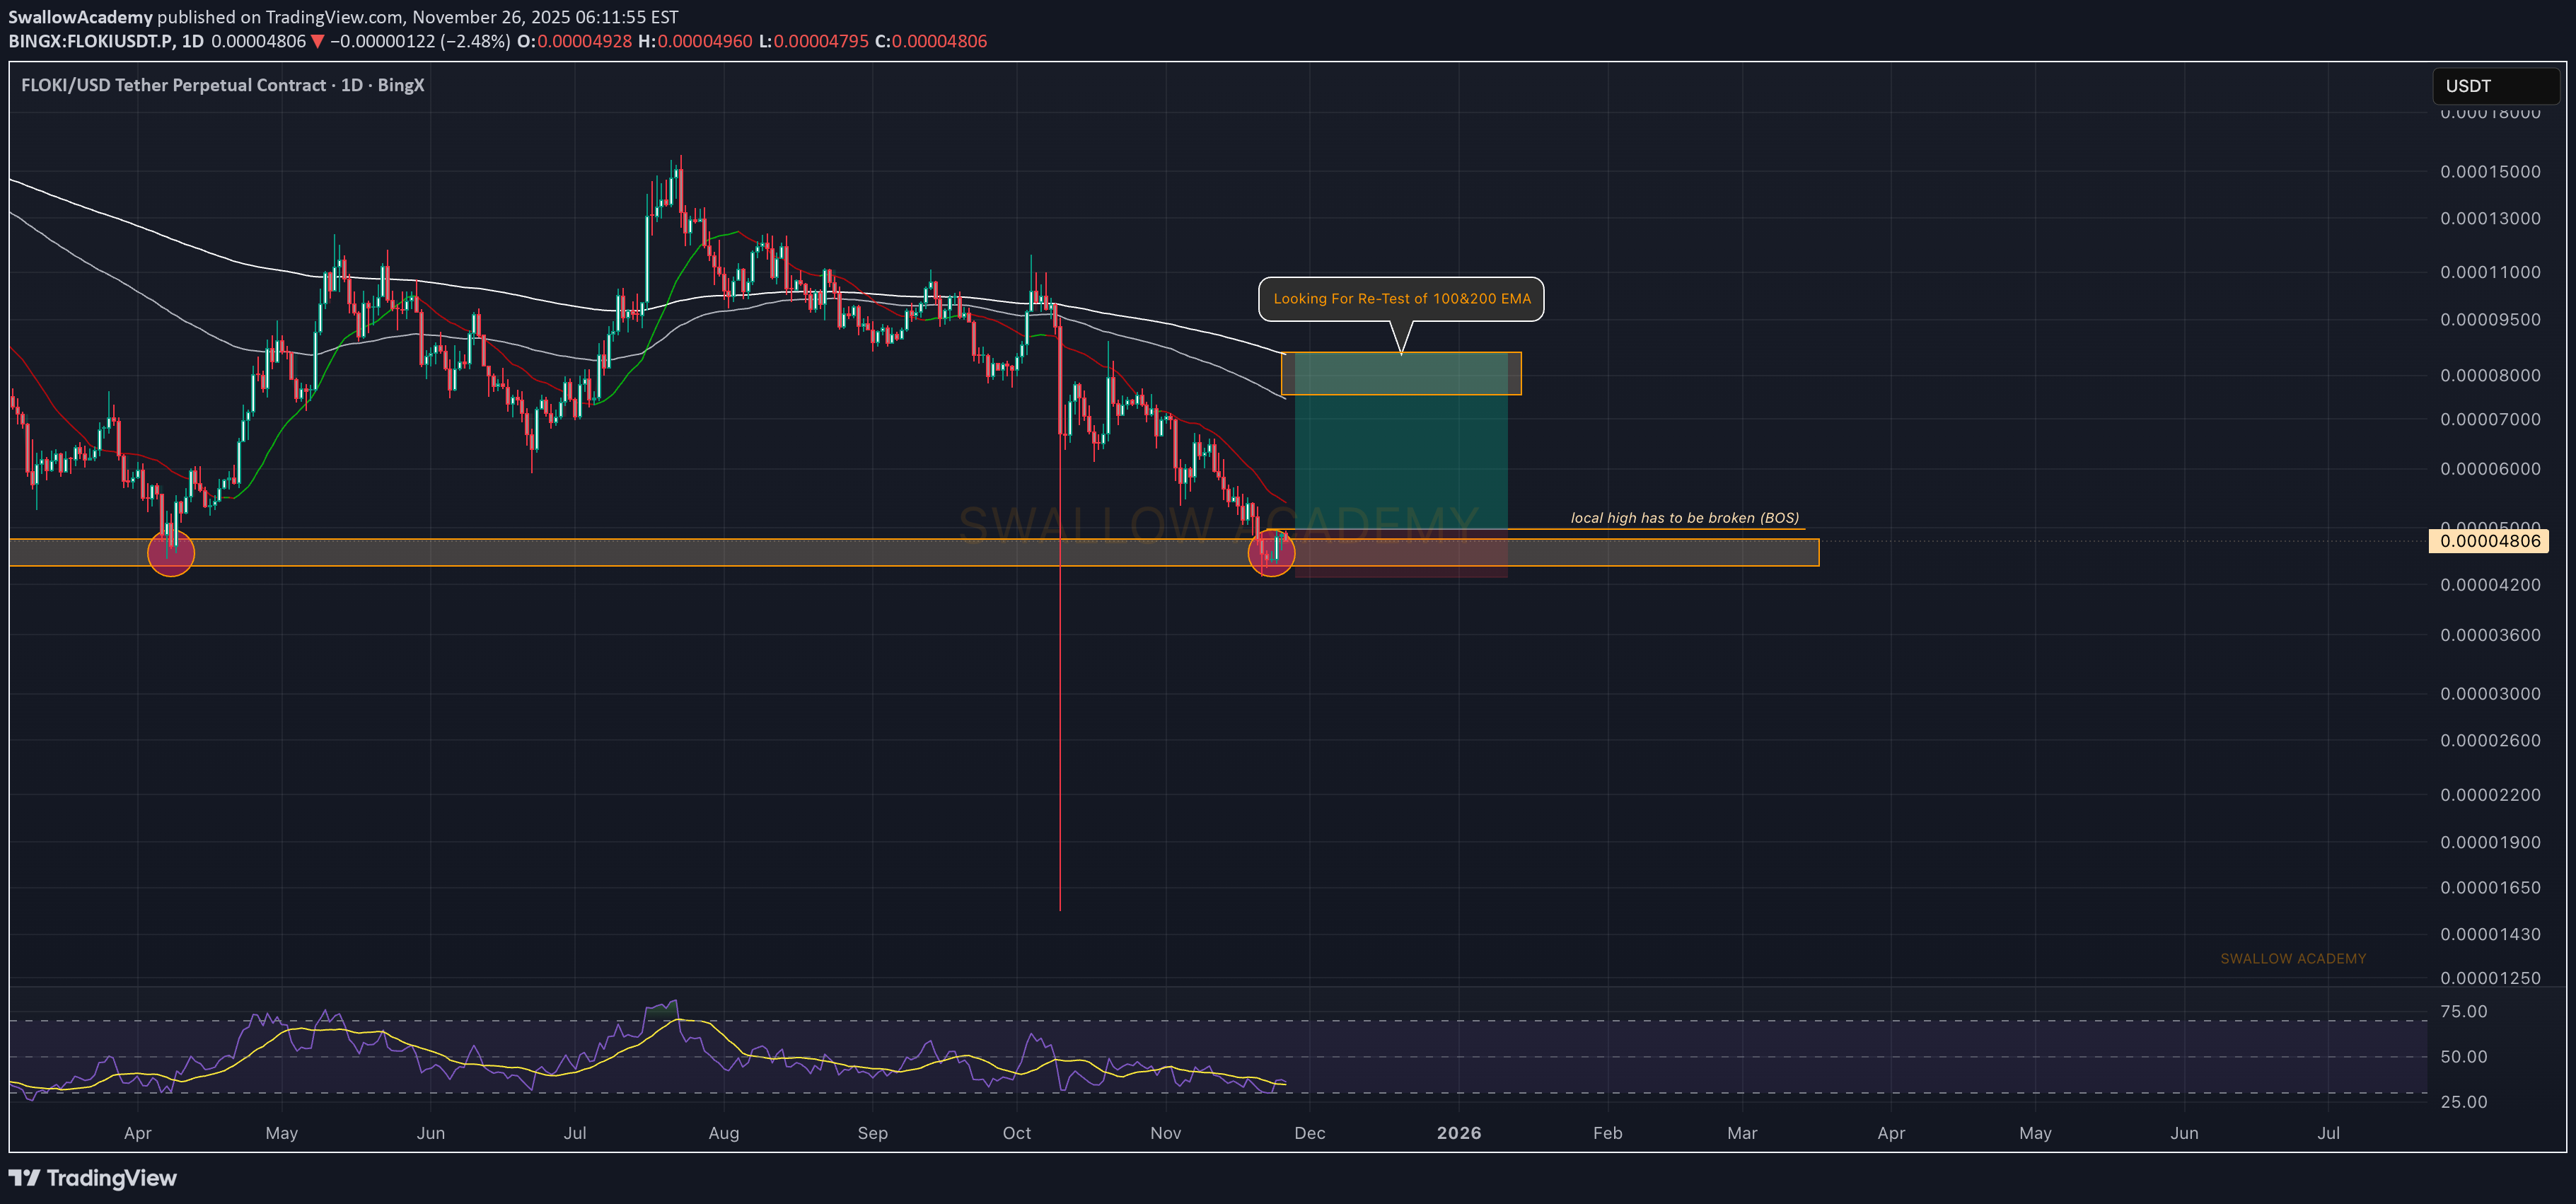
FLOKI is showing a decent reaction near the local support zone, which again confirms the validity of this area. As long as buyers keep holding this zone, the game plan stays the same. If they manage to pull off a clean BOS from here, we’ll be looking for a long setup and aim for a retest of the 100 & 200 EMA. Until then, we just monitor how price behaves around this support and whether buyers can maintain control. Swallow Academy

رشد انفجاری فلوکی (FLOKI): حجم معاملات ۲۴ ساعته چقدر افزایش یافت؟
Current Market Activity FLOKI is experiencing significant trading activity with a 24-hour trading volume of $92.3 million 1, representing a 25.60% increase from the previous day 1. The token is currently priced at $0.00004636 1. Key Order Flow Indicators Exchange Distribution: The highest volume is concentrated on major exchanges, with Binance leading at $13.9 million (15.08% of total volume)

im0mostafa
خرید فوری فلوکی: آیا اکنون بهترین زمان برای سرمایهگذاری است؟
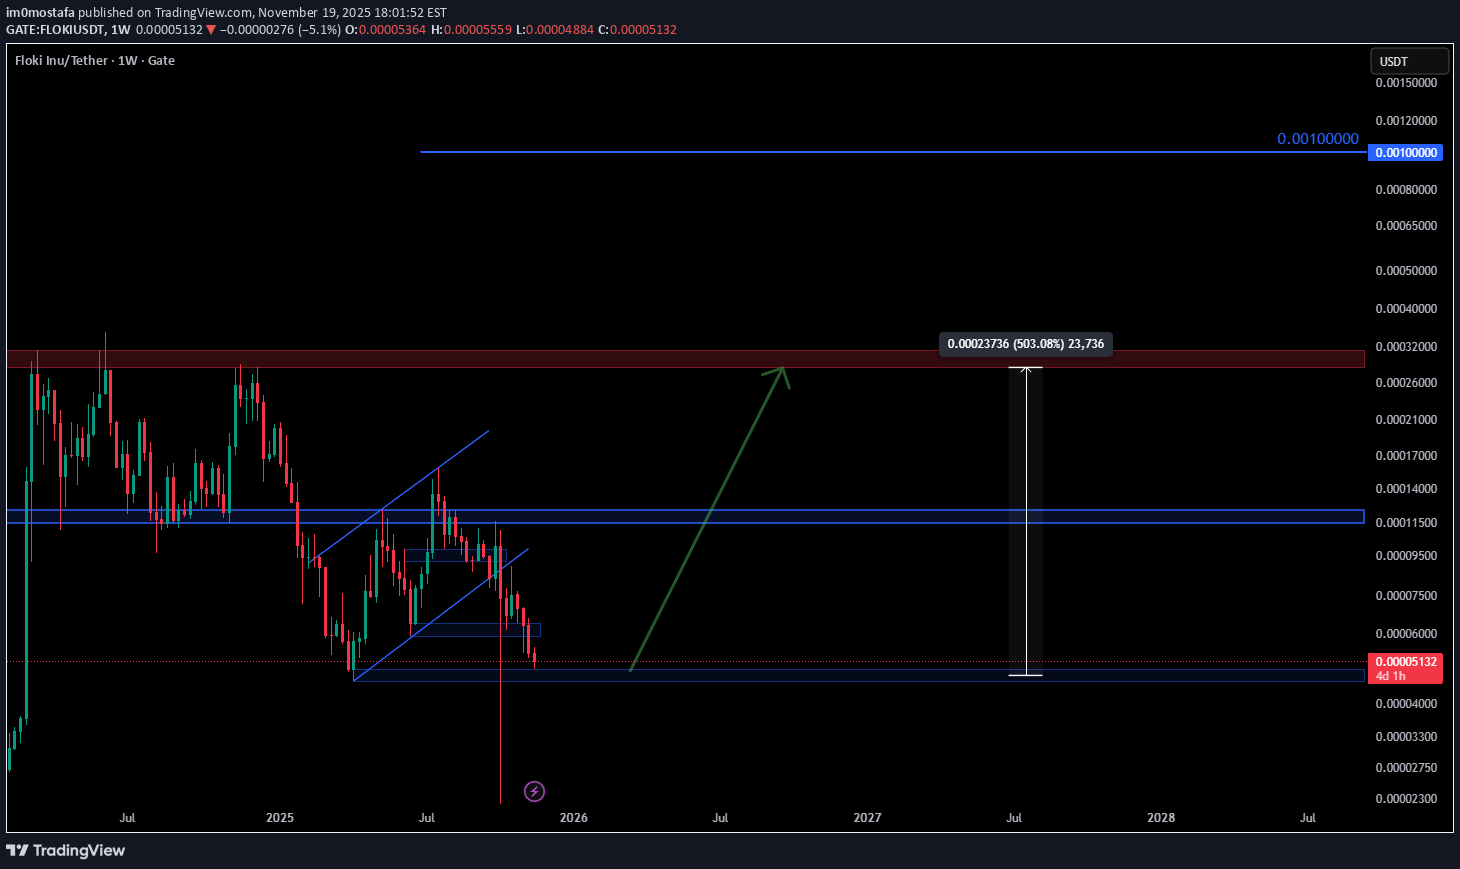
I will buy FLOKI now, it is the best price now to buy

pullbacksignal
سیگنال خرید قطعی فلوکی (FLOKIUSDT): فرصت سود 175 درصدی با تحلیل تکنیکال قوی!

Trading Setup: A Trading Signal is seen in the FLOKIUSDT FLOKI (Daily) (Spot) Traders can open their Buy Trades NOW ⬆️Buy now or Buy on 0.000046 ⭕️SL @ 0.000032 (-41%) 🔵TP1 @ 0.000085 (+56%) 🔵TP2 @ 0.00011 (+102%) 🔵TP3 @ 0.00015 (+175%) What are these signals based on? Classical Technical Analysis Price Action Candlesticks Fibonacci RSI, Moving Average , Ichimoku , Bollinger Bands Risk Warning Trading Forex, CFDs, Crypto, Futures, and Stocks involve a risk of loss. Please consider carefully if such trading is appropriate for you. Past performance is not indicative of future results. If you liked our ideas, please support us with your likes 👍 and comments .

CryptoAnalystSignal
سیگنال خرید قوی فلوکی (FLOKI): آماده انفجار در کانال صعودی!
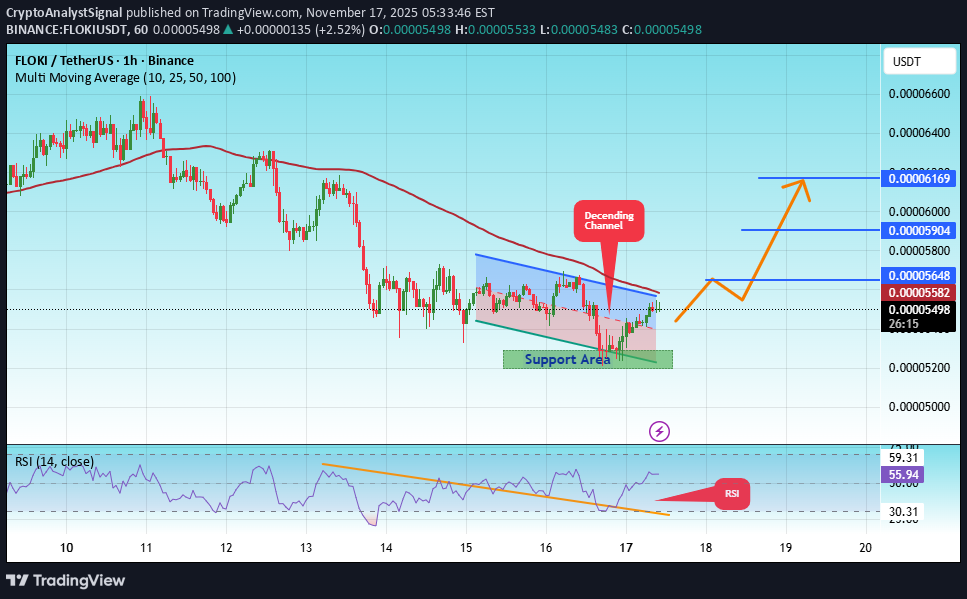
#FLOKI The price is moving within an ascending channel on the 1-hour timeframe and is adhering to it well. It is poised to break out strongly and retest the channel. We have a downtrend line on the RSI indicator that is about to break and retest, which supports the upward move. There is a key support zone in green at 0.00005200, representing a strong support point. We have a trend of consolidation above the 100-period moving average. Entry price: 0.00005500 First target: 0.00006450 Second target: 0.0005904 Third target: 0.00006170 Don't forget a simple money management rule. Place your stop-loss order below the green support zone. Once you reach the first target, save some money and then change your stop-loss order to an entry order. For any questions, please leave a comment. Thank you.

TheHunters_Company
فلاکی (FLOKI) در آستانه صعود؟ فرصت خرید با مدیریت ریسک!

Hello friends According to the technical analysis carried out, we can say that with the entry of buyers, it is possible to enter into a transaction with risk and capital management and move towards the specified goals. *Trade safely with us*

فلاکی در مسیر صعود: پیشبینیهای هیجانانگیز که نباید از دست بدهید!
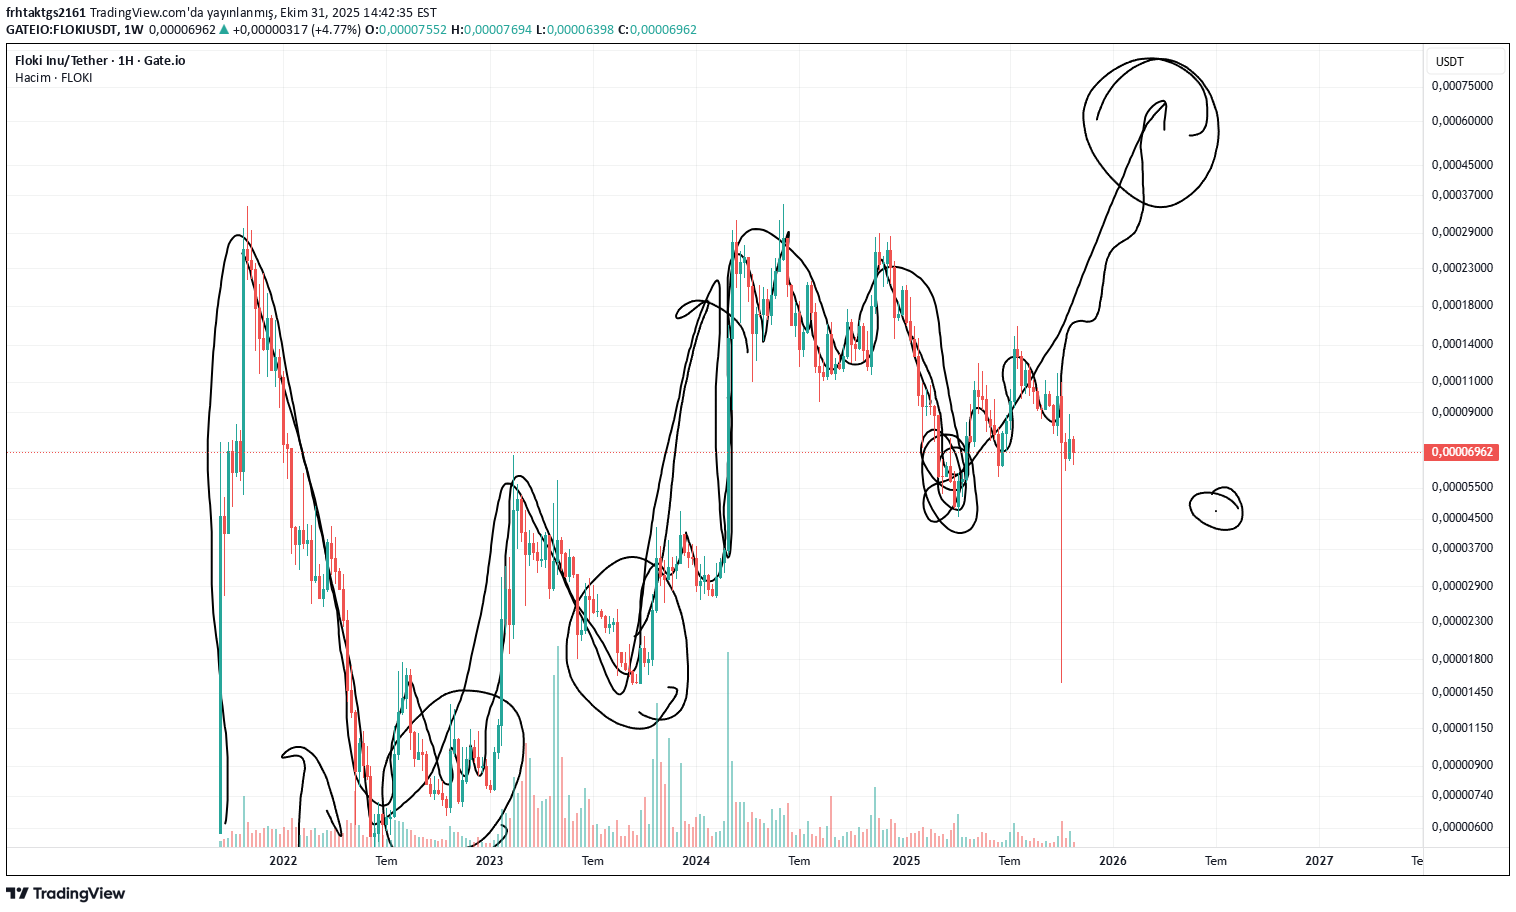
As you can see from the drawings, friends, those who do not believe should not get on the bus. As you can see from the drawings, friends, those who do not believe should not get on the bus, they may fall, so just be aware, it is definitely not :*
Floki Inu چیست؟
معرفی پروژه فلوکی اینو
فلوکی در صرافیهای معتبر
قیمت فلوکی
آیا فلوکی برای سرمایه گذاری مناسب است؟
Disclaimer
Any content and materials included in Sahmeto's website and official communication channels are a compilation of personal opinions and analyses and are not binding. They do not constitute any recommendation for buying, selling, entering or exiting the stock market and cryptocurrency market. Also, all news and analyses included in the website and channels are merely republished information from official and unofficial domestic and foreign sources, and it is obvious that users of the said content are responsible for following up and ensuring the authenticity and accuracy of the materials. Therefore, while disclaiming responsibility, it is declared that the responsibility for any decision-making, action, and potential profit and loss in the capital market and cryptocurrency market lies with the trader.