
FIS
Stafi
| تریدر | نوع سیگنال | حد سود/ضرر | زمان انتشار | مشاهده پیام |
|---|---|---|---|---|
No results found. | ||||
Price Chart of Stafi
سود 3 Months :
سیگنالهای Stafi
Filter
Sort messages by
Trader Type
Time Frame

Alpha-GoldFX
هشدار صعودی قوی: الگوی مثلث نزولی FISUSDT نویدبخش جهش 150 درصدی!

FISUSDT is forming a falling wedge pattern, a powerful bullish reversal signal that suggests the downtrend could be coming to an end. This pattern often indicates that selling pressure is fading while buying interest begins to strengthen. The price is consolidating within narrowing trendlines, and with good trading volume supporting the move, a breakout above the upper resistance line could spark a strong bullish rally. Traders are closely monitoring this setup, with expectations of a potential gain between 140% and 150%+ once confirmation arrives. The technical structure of FISUSDT reflects a classic accumulation phase, where market participants are gradually positioning ahead of a potential breakout. The falling wedge has historically been one of the most reliable bullish continuation or reversal setups, especially when accompanied by rising volume at the base. As momentum builds, a breakout could trigger aggressive buying and push FISUSDT toward higher resistance zones, making this setup particularly attractive for swing and position traders. Investor sentiment around FISUSDT is improving as market confidence grows across altcoins. The project’s fundamentals, combined with its current chart structure, make it one of the notable setups on watch. If price action follows through as anticipated, we could see a significant upward trajectory that captures traders’ attention and reaffirms bullish dominance in the short-to-midterm market cycle. ✅ Show your support by hitting the like button and ✅ Leaving a comment below! (What is You opinion about this Coin) Your feedback and engagement keep me inspired to share more insightful market analysis with you!

richdadandpoordad
فرصت طلایی FIS/USDT: دو نقطه ورود امن برای سود ۱۰ تا ۲۵ درصدی زودهنگام!


Bithereum_io
FISUSDT 1D
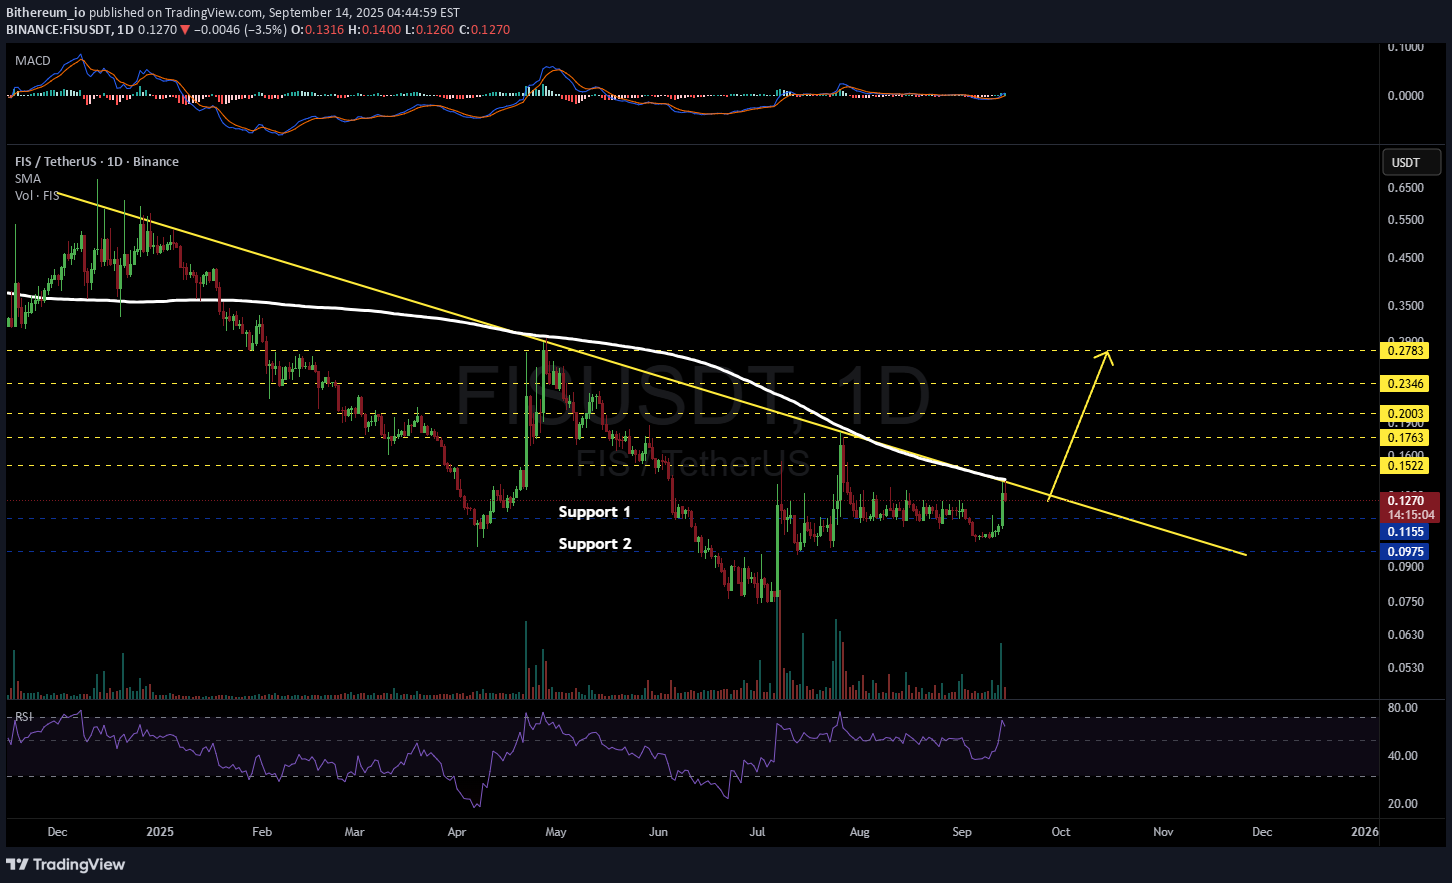
#FIS is attempting to break out above the long-term descending trendline and the SMA200 on the daily chart. Consider buying at the current price and also near the support levels of $0.1155 and $0.0975. If it breaks out above both levels, the potential targets are: 🎯 $0.1522 🎯 $0.1763 🎯 $0.2003 🎯 $0.2346 🎯 $0.2783 ⚠️ Always remember to use a tight stop-loss and follow proper risk management.
Alpha-GoldFX
FISUSDT Forming Bullish Momentum
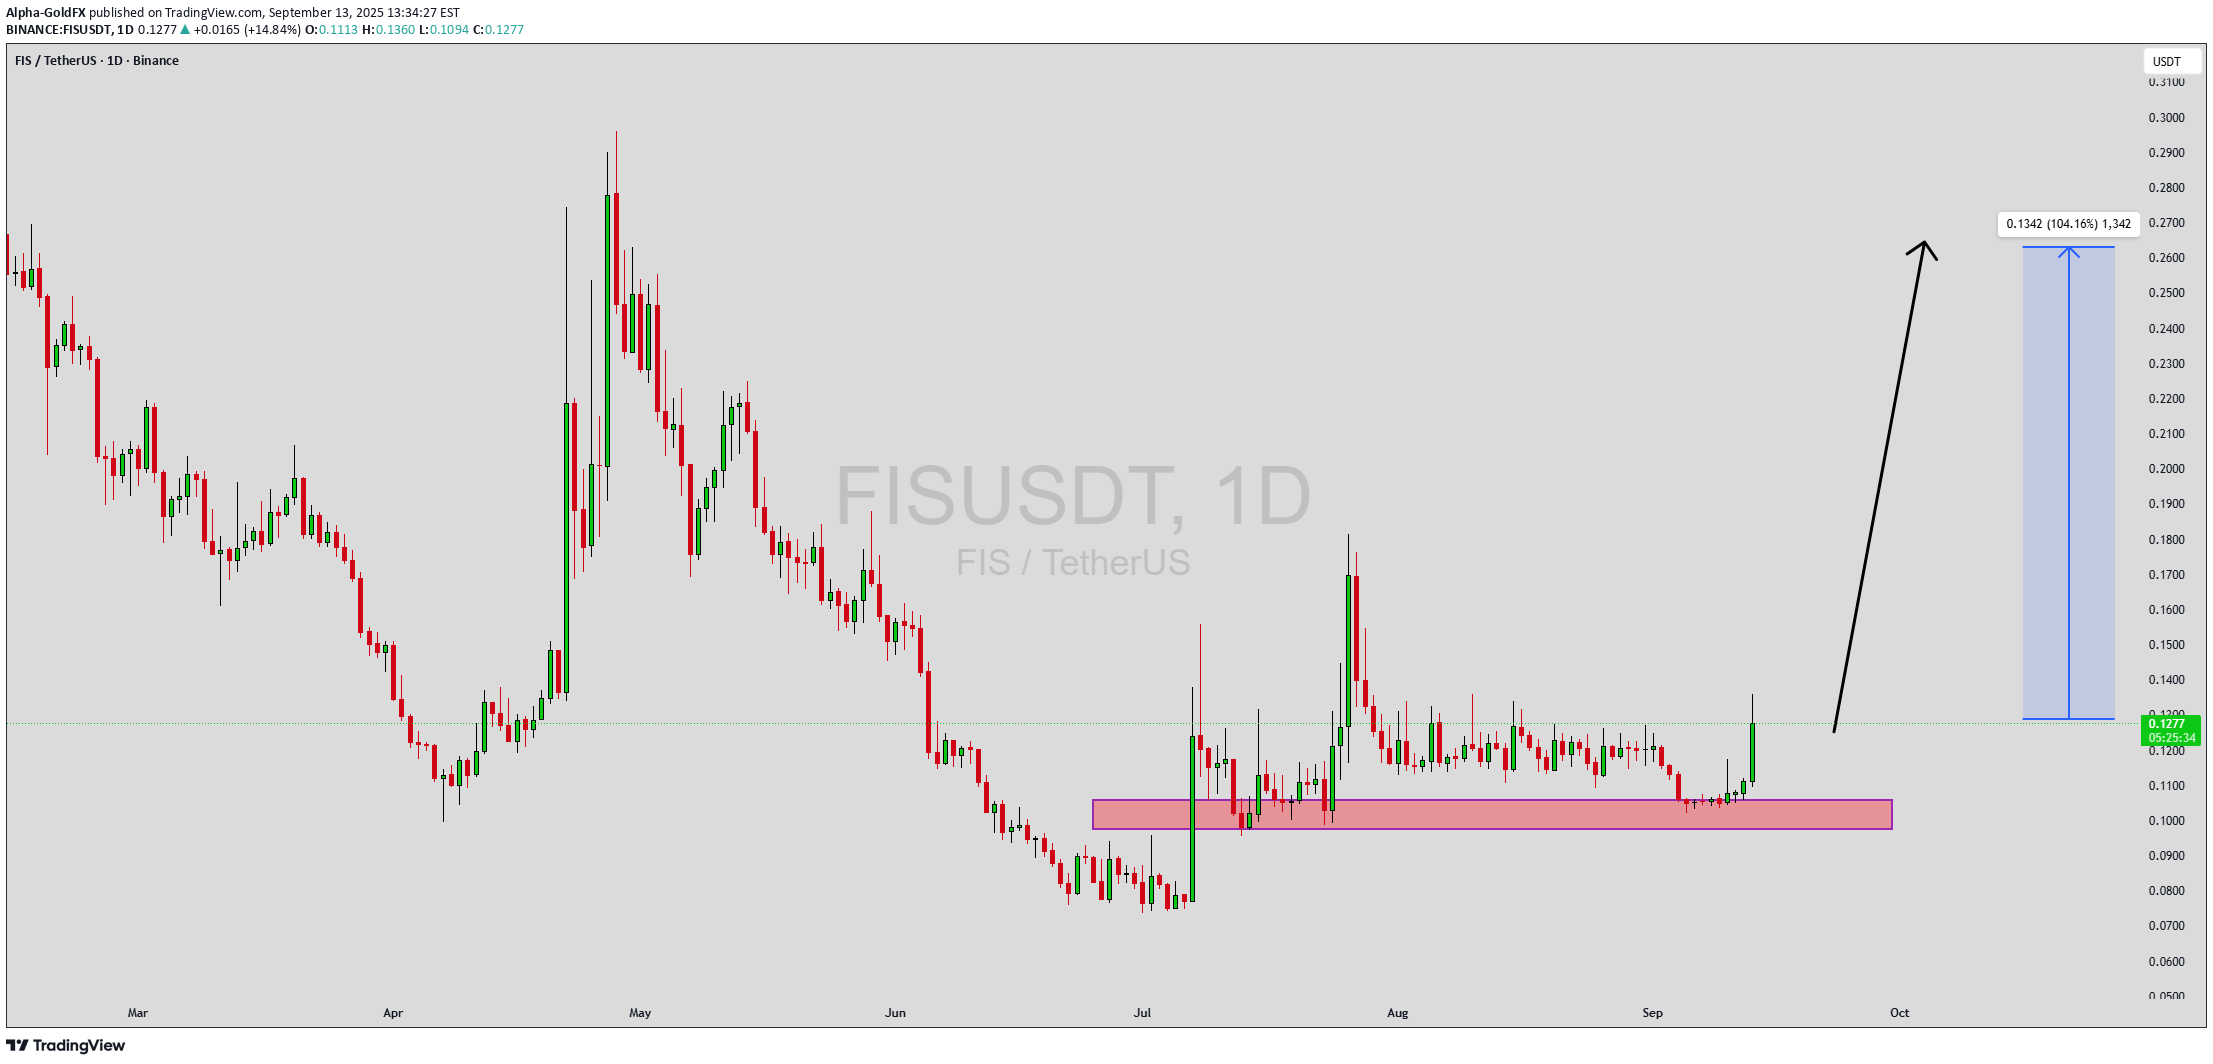
FISUSDT is showing a strong breakout move after consolidating for weeks in a key support accumulation zone. The daily chart highlights bullish momentum with price breaking out from its base, supported by increasing volume that signals rising investor interest. This kind of structure often leads to explosive upside moves as market sentiment shifts in favor of buyers. With an expected gain potential of 90% to 100%+, this breakout setup offers traders a solid opportunity for high returns. The chart projection points toward a significant upside rally, and the current breakout zone could serve as the foundation for further continuation. Investors are starting to pay close attention to FIS as the breakout gains traction, positioning it as one of the most promising setups in the market right now. A sustained close above the breakout level may confirm the next bullish leg, paving the way toward higher resistance levels. ✅ Show your support by hitting the like button and ✅ Leaving a comment below! (What is You opinion about this Coin) Your feedback and engagement keep me inspired to share more insightful market analysis with you!

darksignal
It is a time for FISUSDT? 30% profit - 0.15 USD

The analysis of the FIS/USDT chart on Mexc shows that the current price is around 0.11534 USD, close to a local low after a recent decline. A clear downtrend is visible since the July peak, but recent days suggest a potential rebound, which could mark the start of an upward movement. A suggested rise to 0.15 USD (approximately 30% from the current level) is possible if the price breaks through the resistance around 0.12 USD and stays above the 50-day moving average, currently acting as dynamic support. This move could be supported by increasing volume and positive signals from the oscillator at the bottom of the chart, if it indicates an exit from the oversold zone. A key support level is at 0.11 USD – a drop below this could invalidate the bullish scenario. It is recommended to monitor the breakout above resistance and confirm the trend in the upcoming sessions. Potential TP: 0.15 $

Captain-MAO
FIS/USDT

FIS has shown an aggressive push from buyers, confirming strong demand as the price consistently defends the $0.10–$0.11 zone as solid support. This accumulation range has held firm despite market volatility, indicating a possible base formation. signaling momentum building for a breakout.

KaiZen_Asset_Management
FISUSDT.P 15m – Bearish Rejection at Fib Zone | Short Setup

Price faced strong rejection at the 0.13280 high, forming a double top and now pulling back. Current move aligns with Fibonacci retracement zones, with price reacting near the 50–61.8% zone. MACD histogram is weakening, signaling bearish momentum.
Alpha-GoldFX
FISUSDT Forming Falling Wedge

FISUSDT is forming a textbook falling wedge pattern on the daily timeframe, a well-known bullish reversal signal that often precedes explosive upside breakouts. After an extended corrective phase marked by declining price and compressed volatility, the asset appears to be nearing a breakout zone. The narrowing structure of the wedge, paired with a gradual increase in volume, is a promising setup that signals growing buyer accumulation and a potential shift in market sentiment. The falling wedge is one of the most reliable bullish continuation and reversal patterns in technical analysis, especially when backed by solid volume, as we’re now observing with FISUSDT. Once the price decisively breaks above the wedge’s resistance line, momentum could accelerate rapidly, triggering a sharp move to the upside. Based on current market conditions and historical price behavior, a target of 240%–250% gain is not out of the question as FIS reclaims previous support levels turned resistance. Increased investor interest in this project is another key factor to monitor. Social metrics and on-chain activity suggest renewed enthusiasm in the ecosystem, which often precedes strong price performance. Coupled with favorable technicals and a bullish overall structure, FISUSDT offers a compelling opportunity for traders and long-term investors looking for high-risk, high-reward setups. As always, patience is crucial when trading patterns like the falling wedge. But with technicals aligning and volume confirming accumulation, FISUSDT may soon begin its breakout phase and enter a powerful uptrend. ✅ Show your support by hitting the like button and ✅ Leaving a comment below! (What is You opinion about this Coin) Your feedback and engagement keep me inspired to share more insightful market analysis with you!

cryptotrader270
FIS (StaFi) low cap altcoin

FIS (StaFi) low cap altcoin 15 million mcap with ethereum growing in marketcap defi has lots of potential as well trading at $0.13 mcap 15.3 million 3000 holders all time high $1.20 9x a 10x profit to ath rsi = avg bullish macd = avg project info StaFi LSD Stack is a LSD(Liquid Staking Derivative) stack, developed and maintained by 61 LAB, mainly built for developers who want to create LSTs(Liquid Staking Token). With StaFi LSD Stack, you can build a new LST by simply clicking, while gaining LST’s composability and programability

unichartz
FIS Breaks Out of Falling Wedge – Reversal in Play?

F FIS/USDT has finally broken out of a long-term falling wedge pattern, a structure that often signals reversal. Price is now holding above the breakout zone, showing signs of strength. As long as it stays above the wedge, we might see further upside in the coming days. DYOR, NFA
Disclaimer
Any content and materials included in Sahmeto's website and official communication channels are a compilation of personal opinions and analyses and are not binding. They do not constitute any recommendation for buying, selling, entering or exiting the stock market and cryptocurrency market. Also, all news and analyses included in the website and channels are merely republished information from official and unofficial domestic and foreign sources, and it is obvious that users of the said content are responsible for following up and ensuring the authenticity and accuracy of the materials. Therefore, while disclaiming responsibility, it is declared that the responsibility for any decision-making, action, and potential profit and loss in the capital market and cryptocurrency market lies with the trader.