
FIL
Filecoin
| تریدر | نوع سیگنال | حد سود/ضرر | زمان انتشار | مشاهده پیام |
|---|---|---|---|---|
 ydnldnRank: 2562 | خرید | حد سود: تعیین نشده حد ضرر: تعیین نشده | 1/6/2026 | |
 FortuneAIRank: 3104 | خرید | حد سود: تعیین نشده حد ضرر: تعیین نشده | 1/2/2026 | |
 VIPCryptoVaultRank: 32101 | خرید | حد سود: تعیین نشده حد ضرر: تعیین نشده | 1/4/2026 | |
 the_blue_ospreyRank: 31077 | خرید | حد سود: تعیین نشده حد ضرر: تعیین نشده | 12/12/2025 |
Price Chart of Filecoin
سود 3 Months :
خلاصه سیگنالهای Filecoin
سیگنالهای Filecoin
Filter
Sort messages by
Trader Type
Time Frame
ydnldn
NLDN | FILUSDT PERPETUAL SPECULATION BUY

FILUSDT 📈 4H Perpetual SHORT Entry 1.597 SL 1.440 TP 1.973 Should you find this analysis insightful, I invite you to like or leave a comment. Constructive feedback and suggestions are greatly appreciated. For further analyses, please follow me at @ydnldn.
VIPCryptoVault
FILUSDT | Bullish Structure Shift

Hello folks, As we can see on the chart, FIL has broken free from the descending wedge with an impulsive bullish candle on the 6HTF. It left behind a wide FVG that needs to be filled before price can move higher imo. Good Luck! All our analysis is shared with honesty, care, and real effort. If you find value in it, a like or comment means a lot to show your support🙏📊

BullBearBTC1
FILUSDT - Long idea crypto

Long Idea with entries on the chart 1r and 2r. Please help yourself Entry1.502 Stoploss1.46 TP-11.544 TP-21.586

coinpediamarkets
منطقه طلایی فیلاستیک (FIL) آماده انفجار مجدد: کجا بخریم و هدف بعدی کجاست؟

FILUSDT (1H) is showing a pullback into demand after a sharp impulsive rally. Price has retraced cleanly into a high-confluence demand area, suggesting profit-taking and re-accumulation, not weakness. This zone historically acts as a launchpad when defended. Market Bias: Bullish continuation Buy Zone: $1.438 – $1.416 (strong demand support) Risk Line: A decisive break below $1.408 invalidates the setup Upside Targets: 🎯 Target 1: $1.484 — first reaction and momentum test 🎯 Target 2: $1.558 — liquidity sweep and impulse extension As long as FIL holds this demand zone, the structure favors dip buys over panic sells. A strong bounce here could ignite the next breakout toward higher liquidity levels.
FortuneAI
FIL WILL BE TOP GAINER SOON

🔥 Fortune AI Radar — FIL Fresh activity detected on FIL today. Data suggests increasing market interest & buyers stepping in. Technicals currently lean bullish, with momentum trending upward. Whales showing hints of accumulation and hype rising among traders. This coin is flashing strong signals on short-term charts — worth keeping an eye on 👀 Not financial advice — always research before taking decisions
Leo524
Is $FIL Finally Bottoming… or One More Dump ??

📌 FIL has seen a massive dump from ~$11 to ~$1 over the last 2 years 📉 📌Price has been rejected from the descending trendline 3 times, showing strong selling pressure from higher levels ❌ 📌Currently, price is sitting near a strong green support zone 🟩 👉 This zone is very important for any trend change 📌For price to move up: ✔️ Support zone must hold ✔️ Clear breakout above the descending trendline is needed 📌If support fails, downside risk remains. If support holds + breakout comes, trend reversal can start 🚀

FILUSDT - Parabolic Exhaustion

Filecoin is showing signs of consolidation after a bullish parabolic runup. Profit-taking may occur, causing a bearish retracement.Sell activity being absorbed, but not aggressively.

mastercrypto2020
FILUSDT LONG SIGNAL
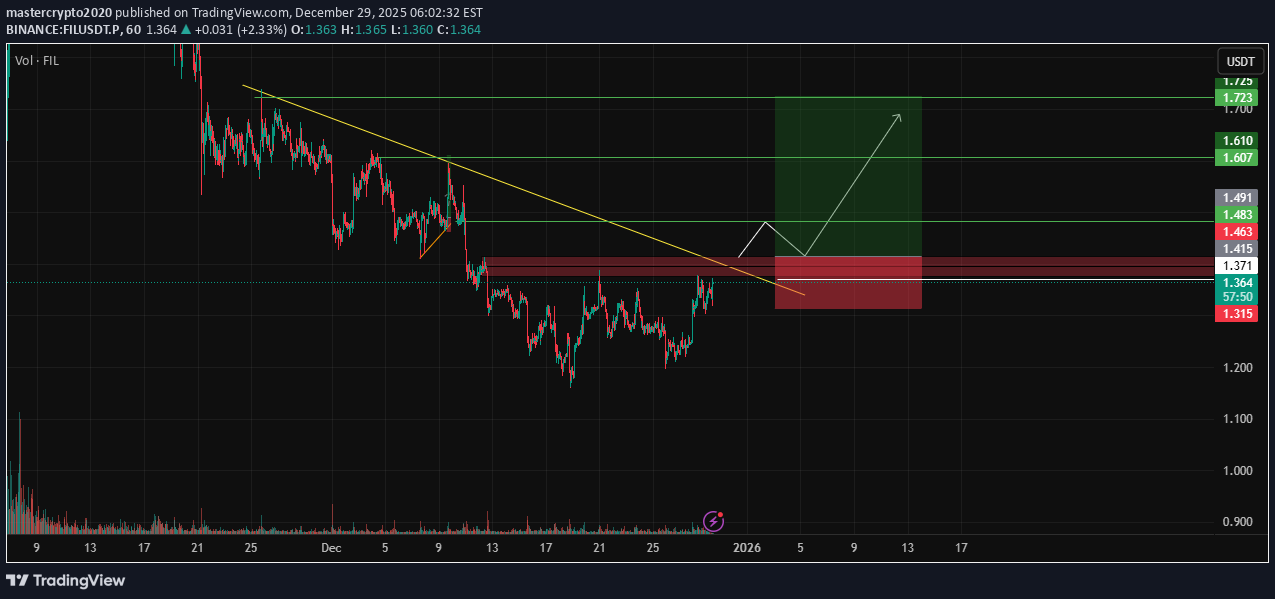
📢 Official Trade Signal – FIL/USDT 📈 Position Type: LONG 💰 Entry Zone: 1.417 – 1.370 🎯 Take-Profit Targets (Partial Exits) TP1: 1.48 TP2: 1.60 TP3: 1.72 TP4: 1.82 TP5: 1.95 🛑 Stop-Loss SL: 1.31 (below demand zone & invalidation level) 📊 Timeframe 4H / Swing Trade ⚖️ Risk / Reward High R:R (≈ 1:4) 💥 Suggested Leverage Spot or Max 3× 🧠 Technical Analysis Summary FIL is trading above a strong demand zone and attempting a breakout from a descending trendline. Bullish confluences: Higher low formation Demand zone support Trendline breakout attempt Clear upside liquidity targets As long as price holds above 1.31, bullish continuation toward higher resistance levels is expected. Expected move: 1.37 → 1.48 → 1.60 → 1.72 → 1.82 → 1.95 ⚙️ Trade Management Rules ✔️ Take partial profit at TP1 ✔️ Move SL to Break-Even after TP1 ✔️ Trail SL below higher lows ✔️ Invalidation: strong close below 1.31

Bithereum_io
FILUSDT 12H
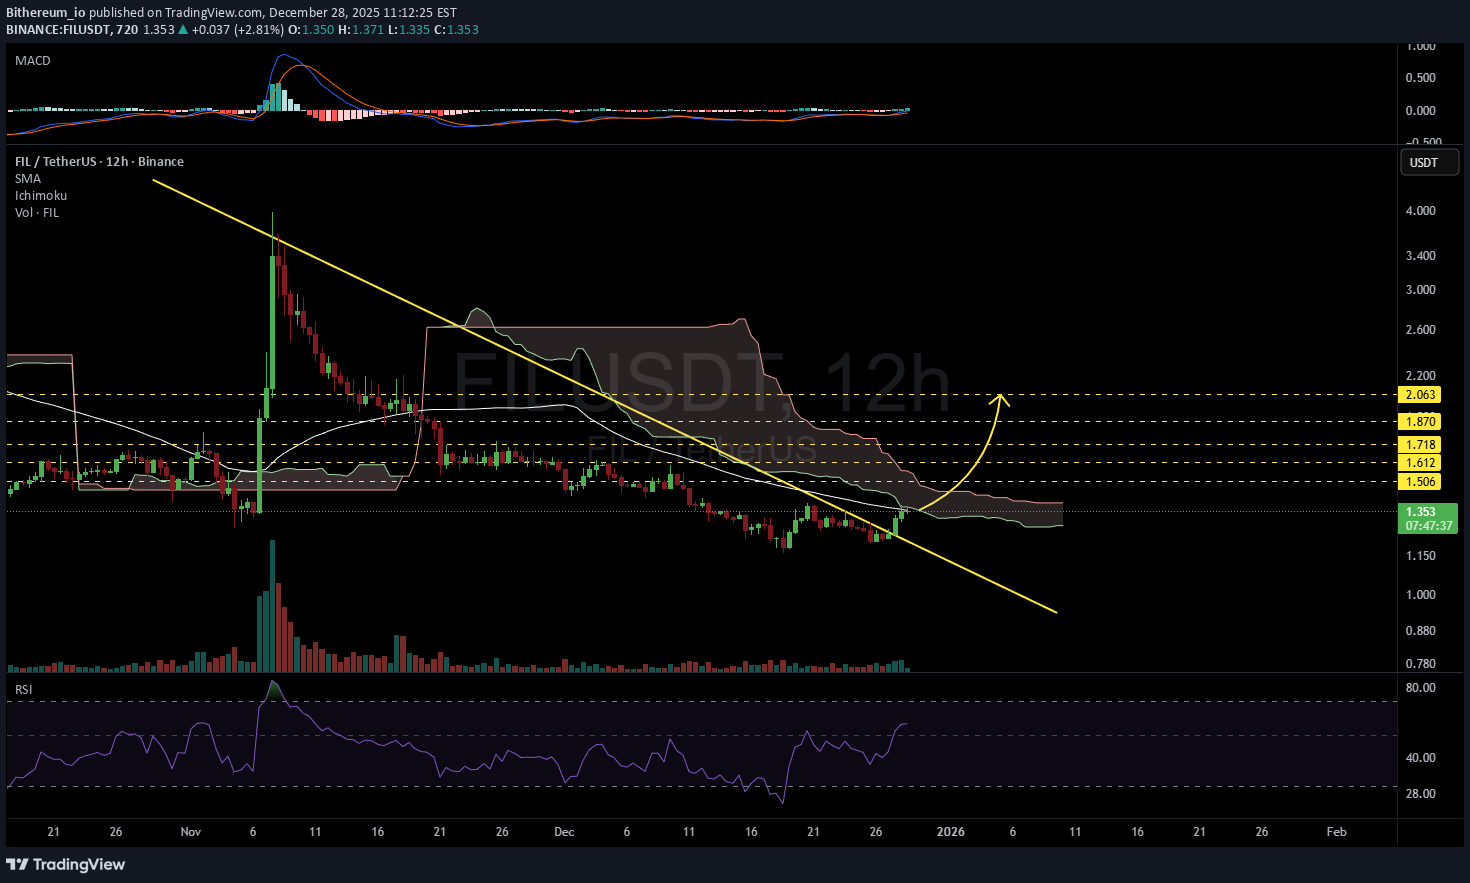
#FIL has broken above the descending resistance on the 12H timeframe and is now testing the 12H SMA50 along with the Ichimoku cloud. If price breaks above both levels, the potential upside targets are: 🎯 $1.506 🎯 $1.612 🎯 $1.718 🎯 $1.870 🎯 $2.063 ⚠️ Always apply tight stop-losses and maintain strict risk management.
ydnldn
NLDN | FILUSDT.P SPECULATION BUY
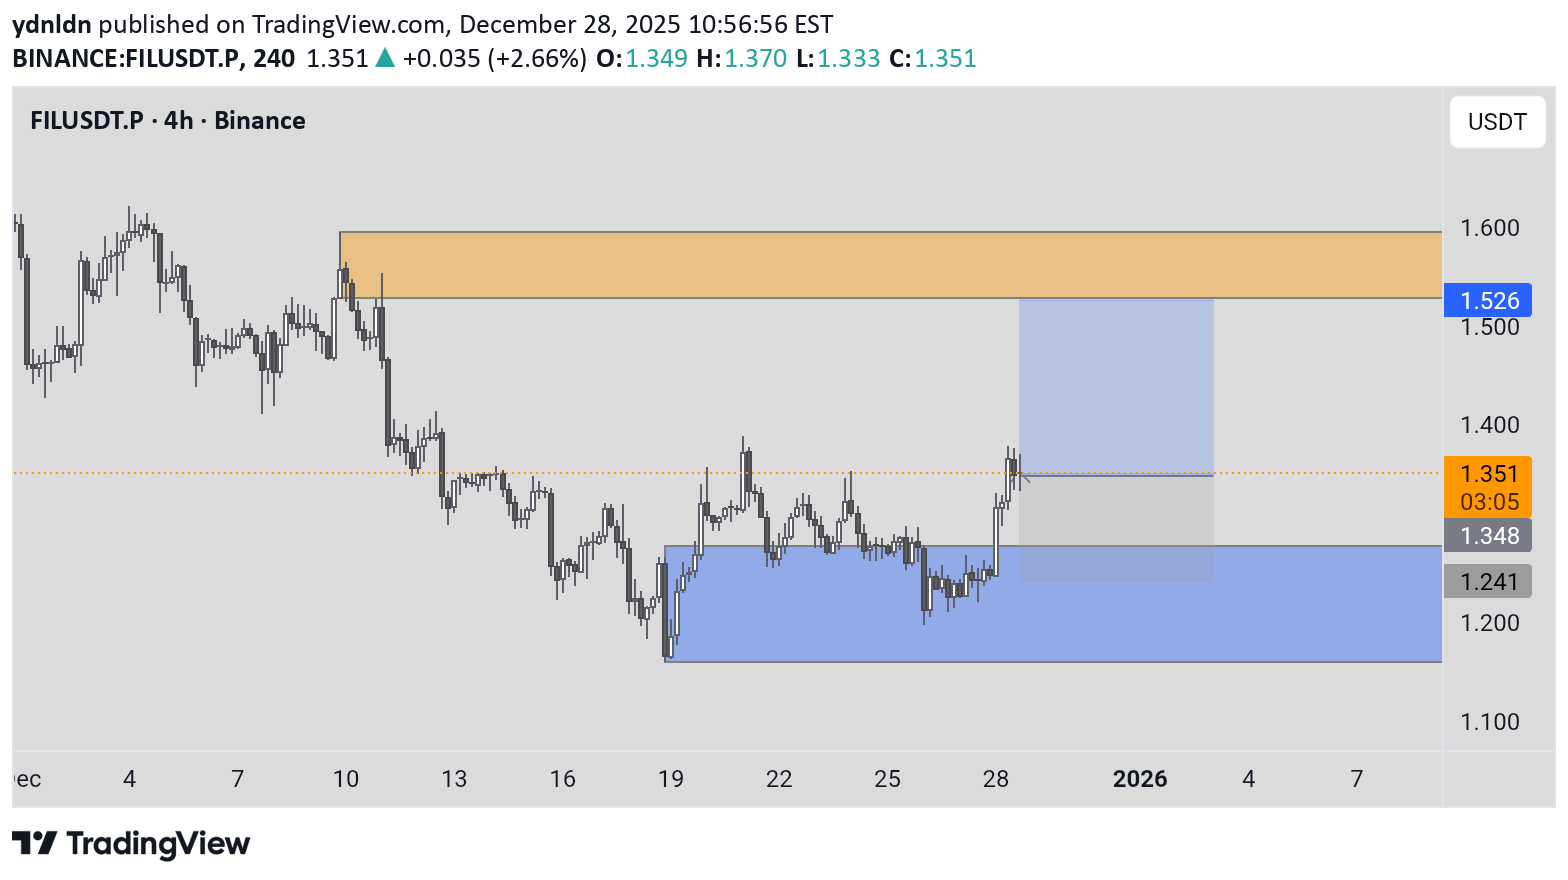
Assets & Trends: The chart shows Filecoin (FIL) in a recovery phase, heading towards an uptrend (bullish). Key Zones: Resistance (Above): Selling area in the range of 1,526 – 1,600 (orange box). Support (Below): Buying area in the range of 1,150 – 1,241 (blue box). Price Target: The trading plan indicates an upside target towards the 1,526 level. Current Conditions: The last price was at 1,347 and has just emerged from a consolidation phase. Should you find this analysis insightful, I invite you to like or leave a comment. Constructive feedback and suggestions are greatly appreciated. For further analyses, please follow me at @ydnldn.
Disclaimer
Any content and materials included in Sahmeto's website and official communication channels are a compilation of personal opinions and analyses and are not binding. They do not constitute any recommendation for buying, selling, entering or exiting the stock market and cryptocurrency market. Also, all news and analyses included in the website and channels are merely republished information from official and unofficial domestic and foreign sources, and it is obvious that users of the said content are responsible for following up and ensuring the authenticity and accuracy of the materials. Therefore, while disclaiming responsibility, it is declared that the responsibility for any decision-making, action, and potential profit and loss in the capital market and cryptocurrency market lies with the trader.