
ENS
Ethereum Name Service
| تریدر | نوع سیگنال | حد سود/ضرر | زمان انتشار | مشاهده پیام |
|---|---|---|---|---|
No results found. | ||||
Price Chart of Ethereum Name Service
سود 3 Months :
سیگنالهای Ethereum Name Service
Filter
Sort messages by
Trader Type
Time Frame

Bithereum_io
تحلیل ENS/USDT: آیا خروج از کانال نزولی، قیمت را به مرز ۱۸ دلار میرساند؟

#ENS is moving inside a descending channel on the 12H timeframe. In case of a breakout above the channel, the potential targets are: 🎯 $13.27 🎯 $14.16 🎯 $15.05 🎯 $16.31 🎯 $17.92 ⚠️ Always remember to protect your capital with a proper stop-loss and disciplined risk management.

CryptoNuclear
نقطه عطف حیاتی ENSUSDT: آیا منتظر انفجار صعودی هستیم یا سقوط نهایی؟
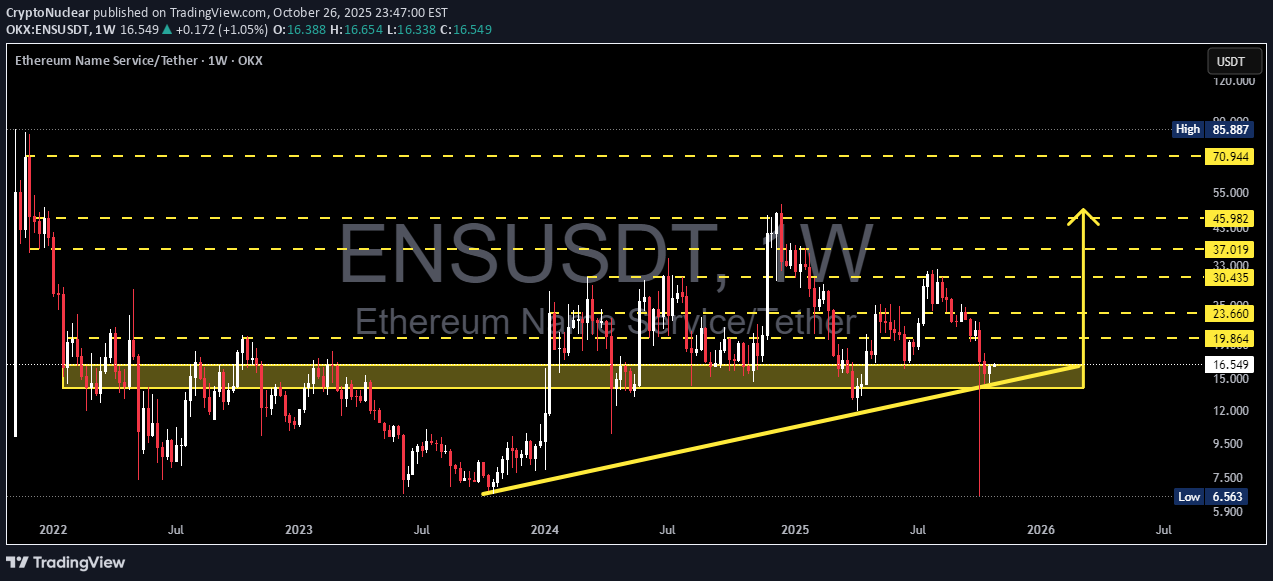
After months of wide consolidation, Ethereum Name Service (ENS) is once again testing one of its most critical structures — the golden confluence zone between 16.5–14.0 USDT, which has served as a major battleground between buyers and sellers since 2022. This isn’t just a price range: It’s where ENS repeatedly formed higher lows and launched new rallies. It’s also aligned perfectly with the multi-month ascending trendline, creating a high-value technical confluence. The market is holding its breath — waiting for a decisive move. --- Technical Structure & Pattern Ascending Trendline: still intact since 2023, providing medium-term bullish structure. Horizontal Support 16.5–14.0: long-term demand zone with multiple reactions in the past; a true make-or-break level. Compression Phase: price is coiling tighter against support — signaling a potential volatility expansion soon. --- 📈 Bullish Scenario If ENS manages to close above 16.5 on the weekly timeframe with a strong bullish candle (such as a pinbar or bullish engulfing), a rebound could unfold toward: Initial targets: 19.8 → 23.6 USDT Extended targets: 30.4 → 37.0 USDT This golden zone could act as a launchpad for the next major bullish leg. Long-term buyers may see this as a high-reward accumulation opportunity with limited downside risk. --- 📉 Bearish Scenario However, a weekly close below 14.0 would confirm a structural breakdown, potentially triggering a deeper move toward: Next supports: 12.0 → 9.5 USDT Extreme target: 7.5 – 6.56 USDT, the historical low on the chart. Such a breakdown would invalidate the medium-term higher-low structure and confirm full bearish control. --- Conclusion ENS stands at a technical cliff — this 16.5–14.0 zone will decide whether it marks the foundation for a new bullish cycle or the start of a major downtrend. Traders who stay patient and wait for clear weekly confirmation will find the best opportunities here — with defined risk and strong potential reward. --- #ENSUSDT #EthereumNameService #CryptoAnalysis #TradingView #SupportResistance #Trendline #Breakout #BullishScenario #BearishScenario #TechnicalAnalysis #CryptoWeekly #ENSAnalysis #CryptoChart
CryptoNuclear
نبرد نهایی ENS در منطقه بحرانی: خریدار پیروز میشود یا فروشنده؟

Overview ENS price is currently at a decisive point — compressed within a descending triangle formation, narrowing right above the major demand zone between 17.5–19.5 USDT. After a prolonged correction from its local highs, the market is now facing an intense battle between fading selling pressure and persistent buying defense around this key support. The upcoming move will likely define the next major trend for ENS in the following weeks. --- Structure and Pattern Main Pattern: Descending Triangle — signaling consistent selling pressure but also potential for a strong reversal if a breakout occurs. Critical Zone: The 17.5–19.5 USDT area acts as a long-standing demand zone that has repeatedly held price throughout 2025. Short-Term Dynamics: The series of lower highs forming the descending trendline indicates a phase of accumulation or waiting for a key catalyst. --- Bullish Scenario – Reversal from Demand Zone If ENS manages to break above the descending trendline and close a daily candle above 24.15 USDT, it would confirm a valid bullish breakout from the pattern. Confirmation: A daily candle with strong volume closing above the trendline. Upside Targets: 24.15 → 27.7 → 30.67 → 37.6 → up to 47.9 USDT if momentum continues. Strategy: Wait for a retest around the breakout area for confirmation. Maintain a stop-loss below 17.5 to manage risk. Such a breakout could mark the beginning of a major reversal, especially if supported by rising volume and positive sentiment within the Ethereum Name Service (ENS) and Web3 ecosystem. --- Bearish Scenario – Breakdown from Historical Support Conversely, if selling pressure pushes the price below the 17.5 USDT zone, the mid-term structure may shift into a bearish continuation. Confirmation: A daily close below 17.5 with strong volume. Downside Targets: 15.0 → 12.0 → potential retest of the historical low at 11.9. Strategy: Consider short positions after a breakdown and retest of the former support-turned-resistance area. A confirmed breakdown below this demand zone would reinforce the narrative that buyers are losing control, opening the door to a new downward trend phase. --- Technical Conclusion ENS is currently at a critical inflection point — the 17.5–19.5 zone represents the buyers’ last stand. A breakout above the descending trendline could ignite a significant rally toward 30–37 USDT, while a breakdown below the demand zone could extend the correction into the 12–15 USDT range. Watch price reaction and volume within the yellow zone, as it will determine the winner of this crucial market battle. --- #ENS #ENSUSDT #CryptoAnalysis #TechnicalAnalysis #PriceAction #DescendingTriangle #SupportResistance #BreakoutTrading #SwingTrade #Web3 #EthereumNameService #CryptoTrading

CryptoSanders9563
تحلیل تکنیکال ENS/USDT: سیگنال خرید در کانال نزولی! اهداف جدید تا ۳۰ دلار

ENS/USDT ENS is trading around $21.50, currently testing the upper trendline of a well-defined falling channel. Price has formed a bullish breakout structure, supported by higher lows on the 4H timeframe. the Volume shows early accumulation signs, suggesting buyers are stepping in near $20–$21. Long Setup: Entry zone: $20.5 – $21.5 Stop-loss: Below $19.8 (below the structure support) Targets: 🎯 $25.0 → First target 🎯 $27.5 → Second target 🎯 $29.9+ → Extended swing target DYOR | NFA

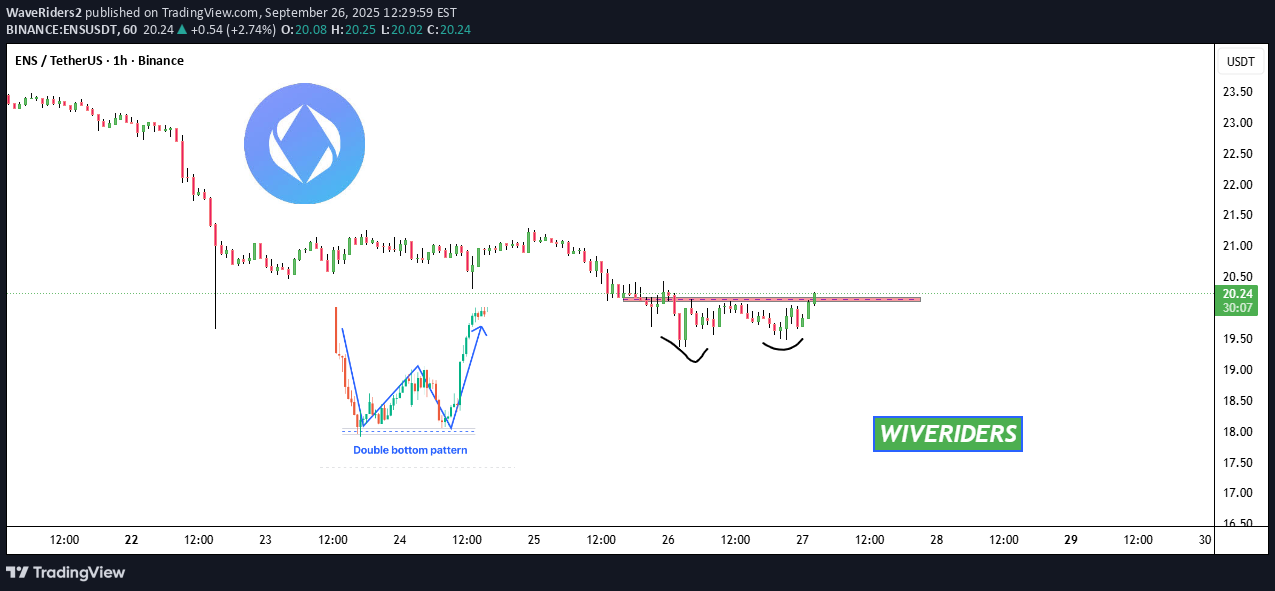
WaveRiders2

mahesh56a
ENS Ready for 100% Up Move
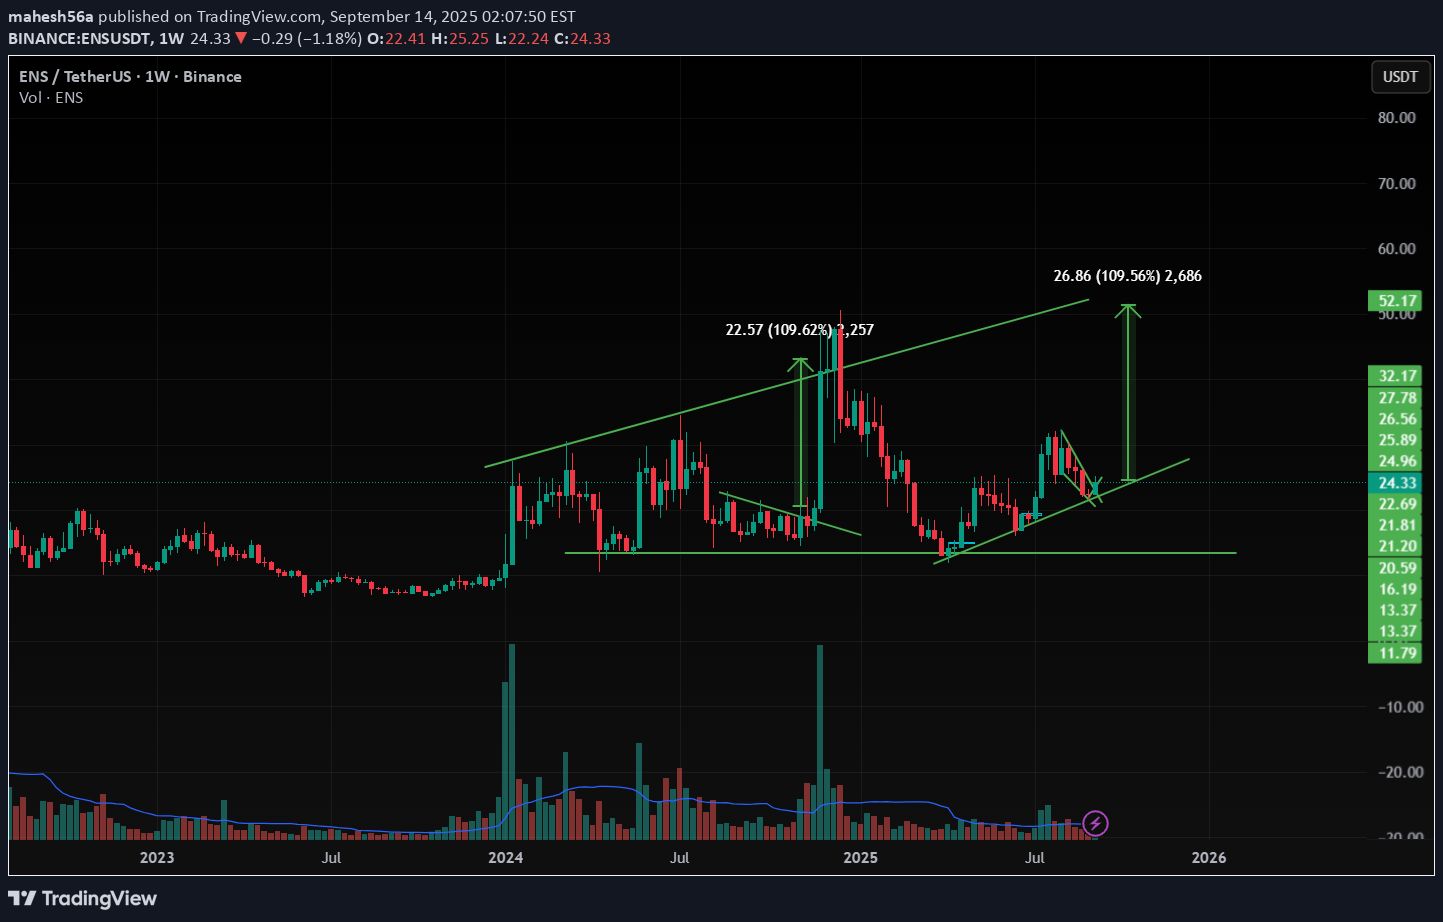
Now the price is at the Weekly support and forming a wedge pattern and ready to break from this pattern , enter after the strong candle close in weekly . and at the same time Bitcoin dominance is decreasing and altcoins dominance is started increasing , so look on all the altcoins and follow proper risk management , it has very good chances to move UP side but first we have to protect the down side , where risk management comes into game . Follow for more Ideas and potential coins/ Stocks .
Bithereum_io
ENSUSDT 1D
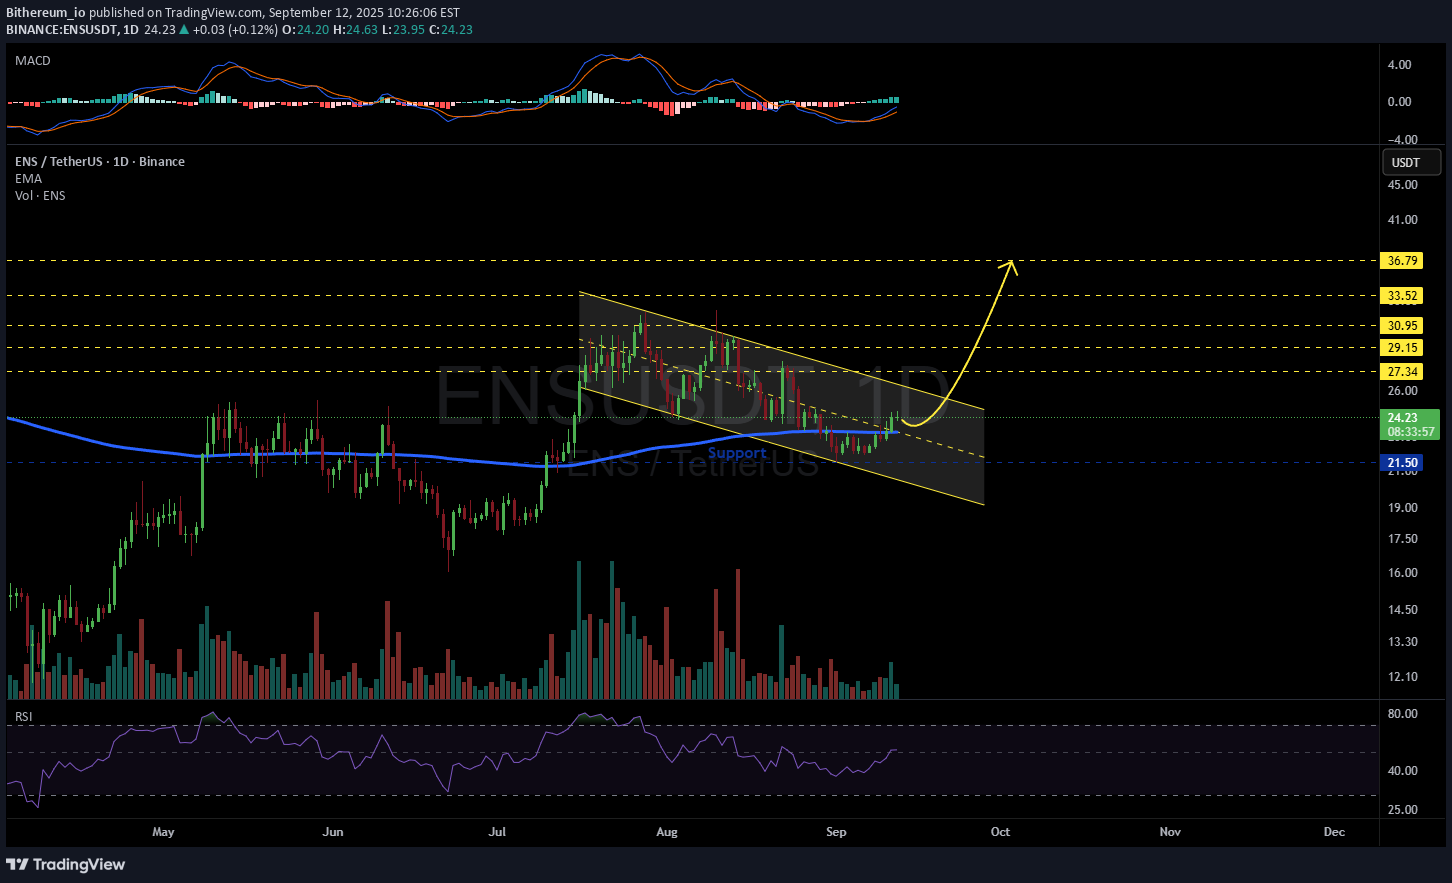
#ENS is moving within a bullish flag pattern on the daily chart and is currently trading above the midline of the flag and the daily EMA200. Consider buying at the current price and near the $21.50 support level. If it breaks out above the pattern resistance, the targets are: 🎯 $27.34 🎯 $29.15 🎯 $30.95 🎯 $33.52 🎯 $36.79 ⚠️ Always remember to use a tight stop-loss and follow proper risk management.
CryptoNuclear
ENS/USDT — Fibonacci Zone: Bullish Reversal or Bearish Breakdown
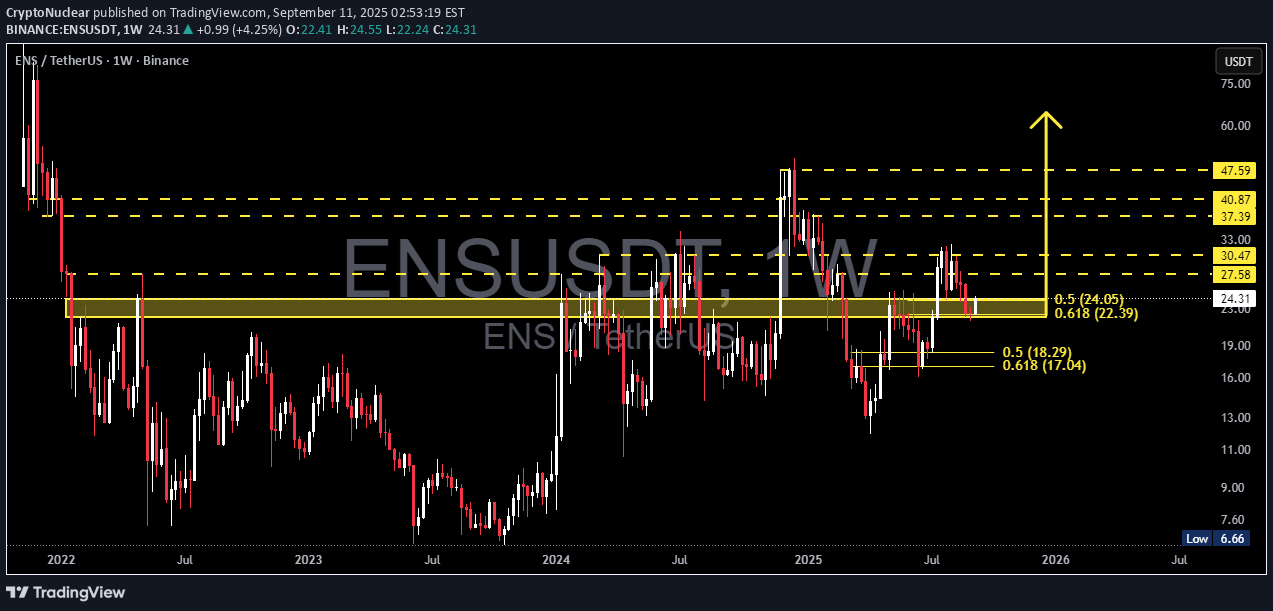
Chart Overview (1W Timeframe) ENS/USDT is currently trading at the critical zone of 22.4 – 24.1 USDT, a decisive area because: It represents a flip zone (previous resistance that may now act as strong support). It aligns with a Fibonacci confluence at 0.5 (≈24.05) and 0.618 (≈22.39), making it a high-probability demand area. This zone will decide whether ENS confirms a bullish continuation or faces a bearish breakdown in the coming weeks. --- 🔹 Market Structure & Pattern After a strong rebound from the 2023 lows, ENS formed a swing high in 2025 but failed to break higher → early signs of consolidation. The price is now retesting the golden support zone (22–24), acting as a pivotal decision level. Instead of a classic pattern (e.g., H&S, triangle), the chart shows signs of range accumulation vs. distribution → making reaction at key levels the primary focus. --- 🔹 Bullish Scenario Condition: Weekly close above 24.05 and ideally above 27.58. 📈 Upside targets: 1. 27.58 USDT → minor resistance, confirmation level. 2. 30.47 USDT → key psychological & structural resistance. 3. 37.39 – 40.87 USDT → major supply zone. 4. 47.59 USDT → extended target if strong momentum continues. ✅ Bullish confirmation = strong green weekly candle closing above the zone with rising volume. --- 🔹 Bearish Scenario Condition: Weekly close below 22.39 (0.618 Fib). 📉 Downside targets: 1. 18.29 USDT → 0.5 retracement support. 2. 17.04 USDT → 0.618 retracement support. 3. 6.66 USDT (historical low) → only if a deep breakdown unfolds. ⚠️ A breakdown and failed retest below 22.39 would confirm a larger distribution phase. --- 🔹 Key Takeaways for Traders The 22.4 – 24.1 USDT zone is the “make-or-break level.” Holding this level → opens the door for a multi-month bullish trend. Losing this level → signals risk of a mid-term bearish move. Risk management is crucial on the weekly timeframe — stops should be clear (e.g., below 22 for long setups). --- 🎯 Conclusion ENS is testing its golden Fibonacci zone — the defining level for its next major move. Bullish case: Hold & breakout → potential targets 30–47 USDT. Bearish case: Breakdown → risk of decline toward 18–17, possibly 6.6 in the long term. 📌 All eyes on the weekly close around 22–24 USDT — a key zone no swing trader or investor should ignore. --- #ENS #ENSUSDT #EthereumNameService #CryptoAnalysis #TechnicalAnalysis #SwingTrading #SupportResistance #Fibonacci #PriceAction

Jordan_Crypt_SA
Swing Trade Idea ENS/USDT – Long Setup (8H timeframe)
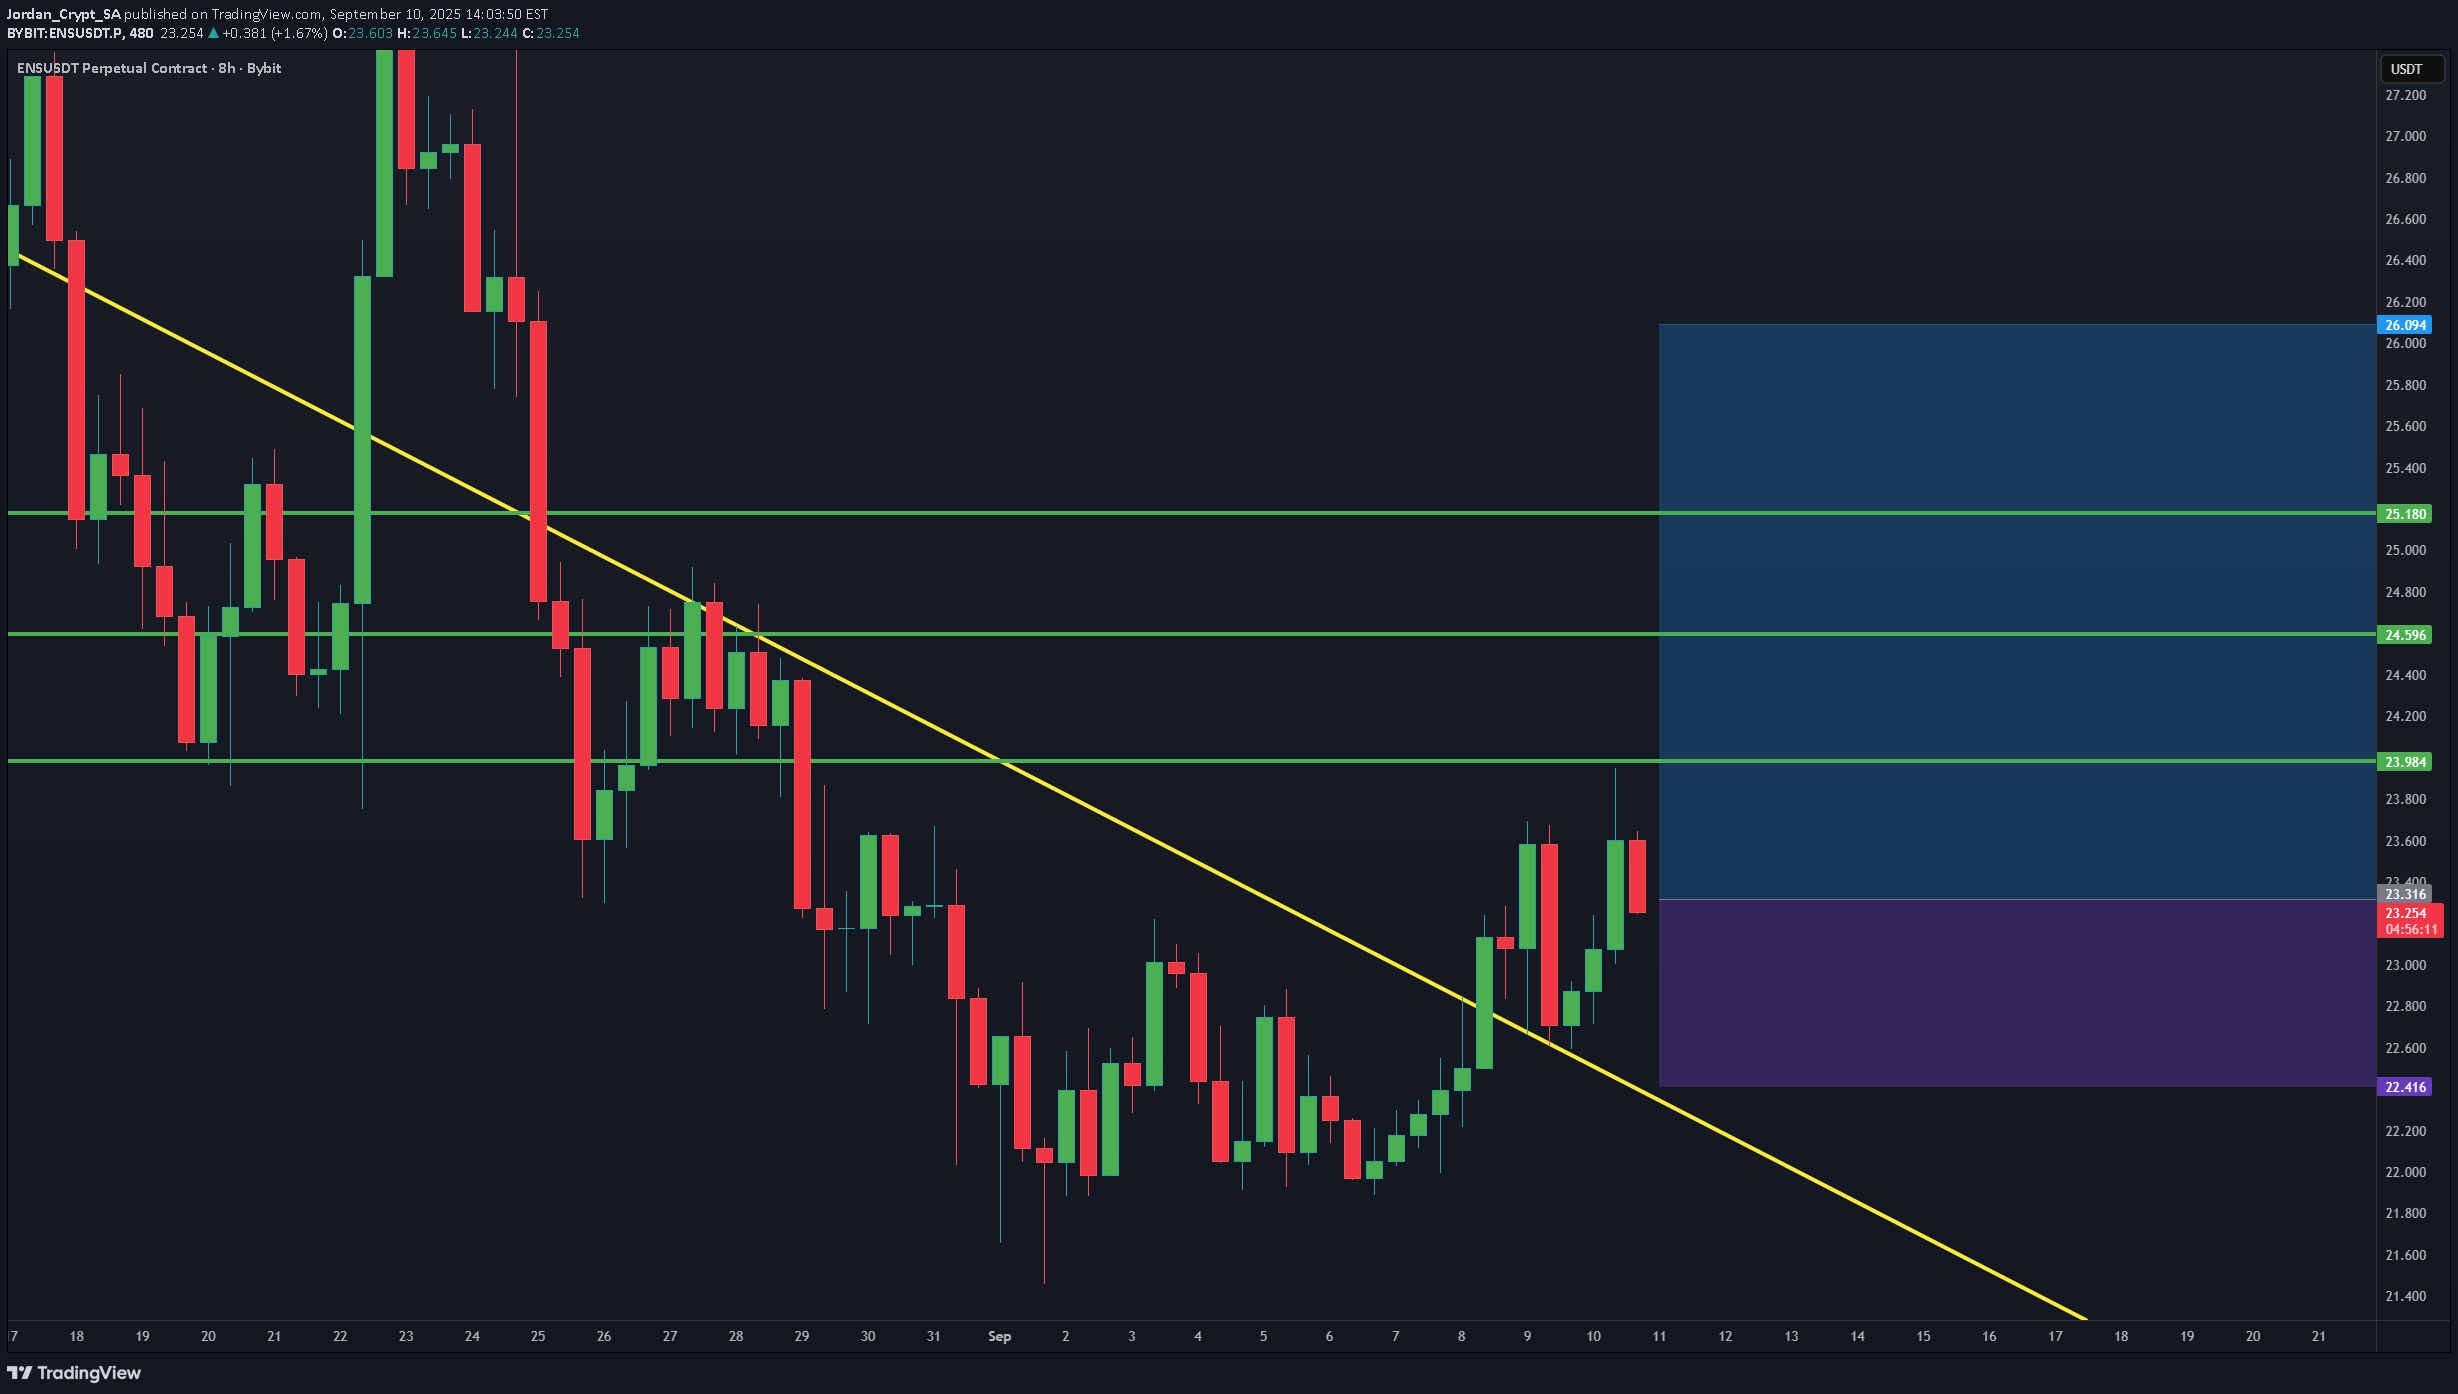
Entry Range: $23.30-23.50 Take Profit 1: $23.99 Take Profit 2: $24.59 Take Profit 3: $25.18 Stop Loss: $22.51 Leverage: 10-15x Please trade with care and use proper position sizing and risk management always ✅

VIPROSE
ENS Potential Bullish ABCD Pattern Forming!
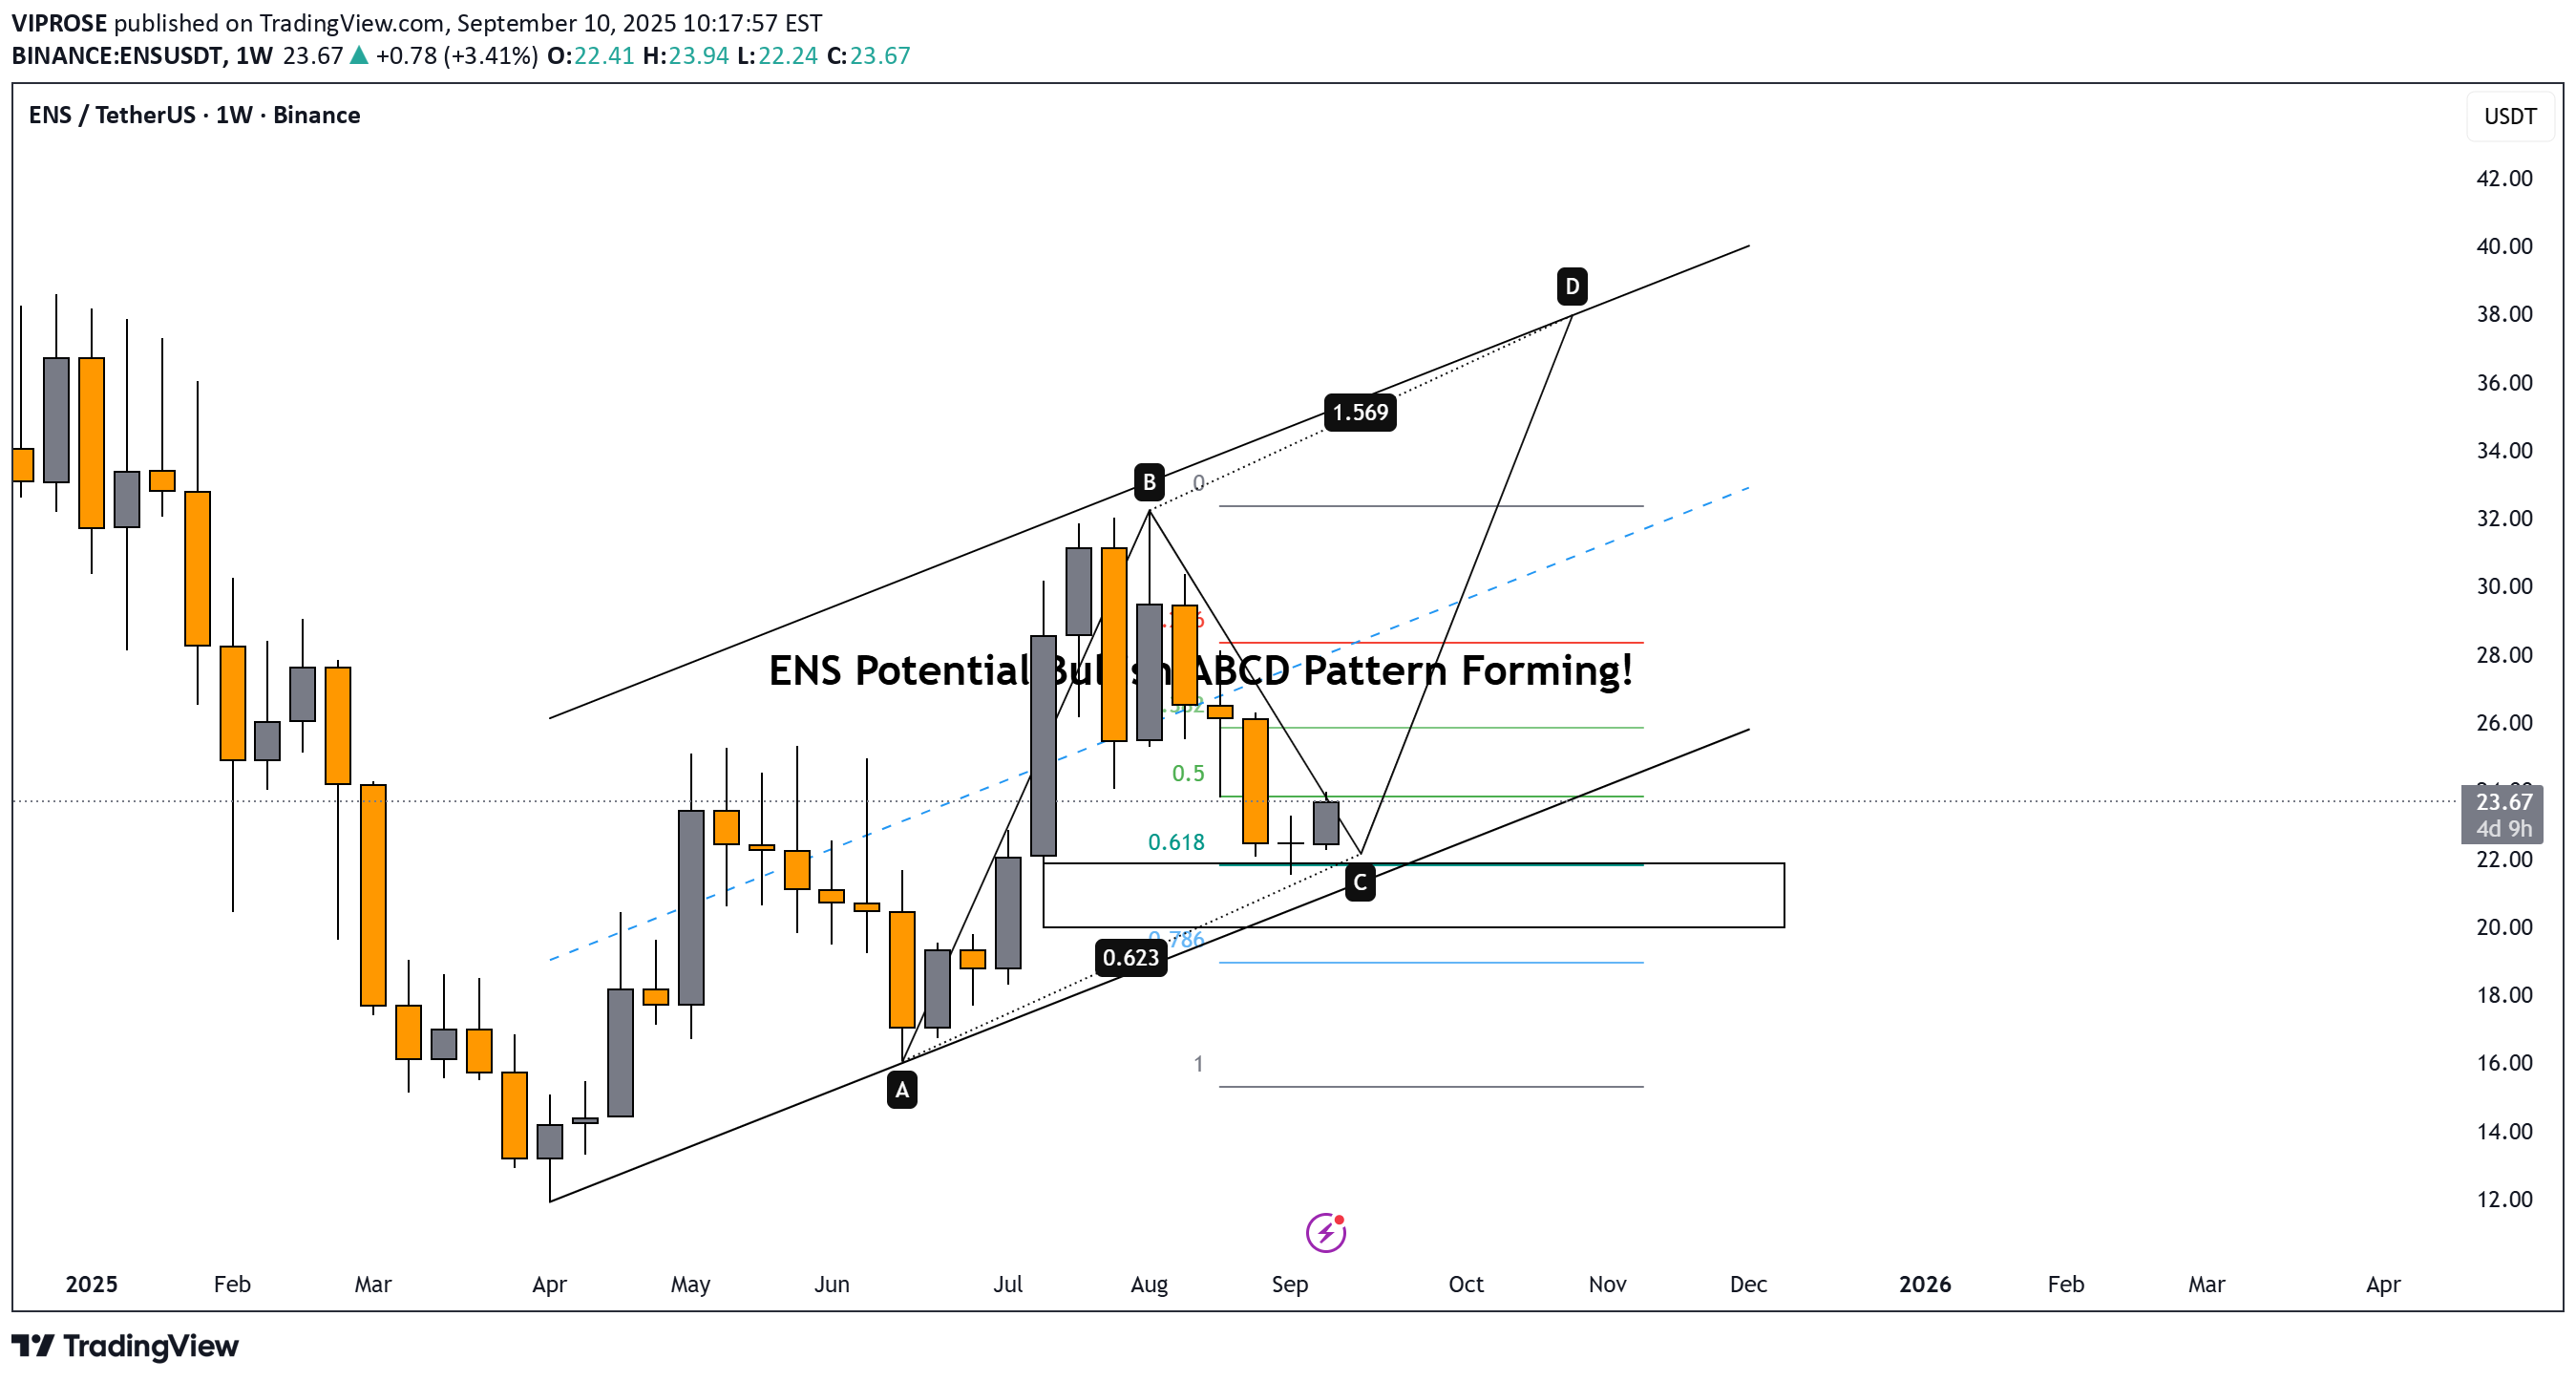
Price just tapped the 0.618 golden zone + support trendline 📉💥 We’re at point C, prepping for a potential move toward point D 👀 Pattern: ABCD Harmonic inside a bullish channel 🧠 • Fib levels aligning perfectly ✅ • Weekly structure still intact ✅ 🎯 Watching next leg toward D @ 1.569 Fib extension Stay sharp — this could be the beginning of a strong trend reversal! 📈
Disclaimer
Any content and materials included in Sahmeto's website and official communication channels are a compilation of personal opinions and analyses and are not binding. They do not constitute any recommendation for buying, selling, entering or exiting the stock market and cryptocurrency market. Also, all news and analyses included in the website and channels are merely republished information from official and unofficial domestic and foreign sources, and it is obvious that users of the said content are responsible for following up and ensuring the authenticity and accuracy of the materials. Therefore, while disclaiming responsibility, it is declared that the responsibility for any decision-making, action, and potential profit and loss in the capital market and cryptocurrency market lies with the trader.