Technical analysis by CryptoNuclear about Symbol ENS: Buy recommendation (9/11/2025)

CryptoNuclear
ENS/USDT — Fibonacci Zone: Bullish Reversal or Bearish Breakdown
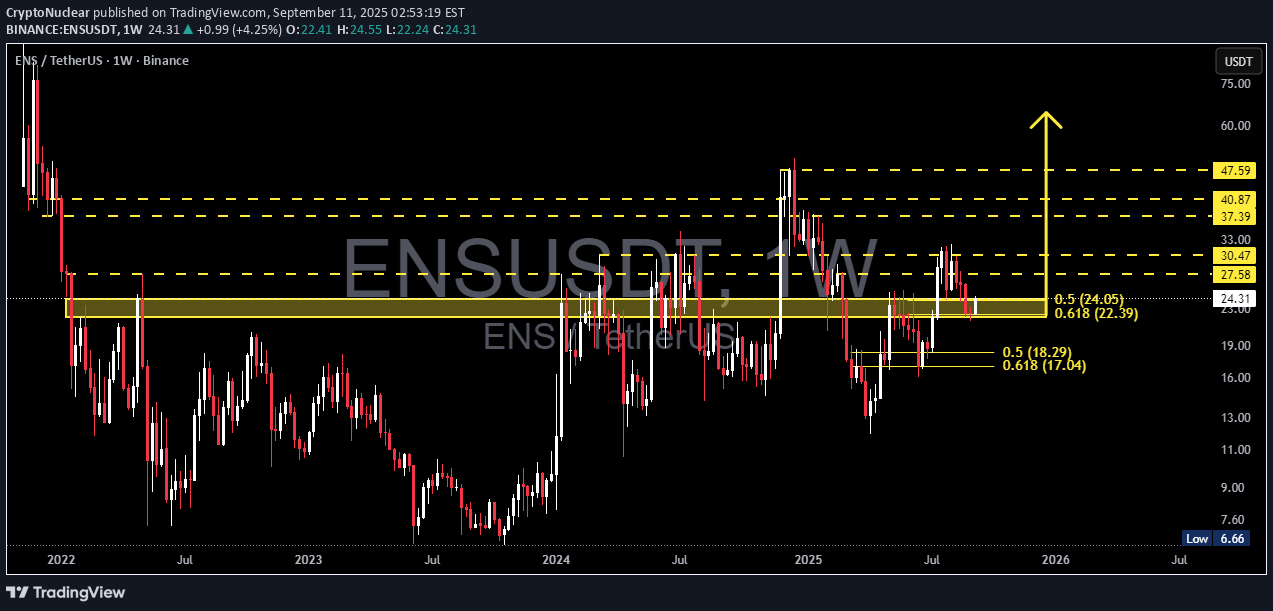
Chart Overview (1W Timeframe) ENS/USDT is currently trading at the critical zone of 22.4 – 24.1 USDT, a decisive area because: It represents a flip zone (previous resistance that may now act as strong support). It aligns with a Fibonacci confluence at 0.5 (≈24.05) and 0.618 (≈22.39), making it a high-probability demand area. This zone will decide whether ENS confirms a bullish continuation or faces a bearish breakdown in the coming weeks. --- 🔹 Market Structure & Pattern After a strong rebound from the 2023 lows, ENS formed a swing high in 2025 but failed to break higher → early signs of consolidation. The price is now retesting the golden support zone (22–24), acting as a pivotal decision level. Instead of a classic pattern (e.g., H&S, triangle), the chart shows signs of range accumulation vs. distribution → making reaction at key levels the primary focus. --- 🔹 Bullish Scenario Condition: Weekly close above 24.05 and ideally above 27.58. 📈 Upside targets: 1. 27.58 USDT → minor resistance, confirmation level. 2. 30.47 USDT → key psychological & structural resistance. 3. 37.39 – 40.87 USDT → major supply zone. 4. 47.59 USDT → extended target if strong momentum continues. ✅ Bullish confirmation = strong green weekly candle closing above the zone with rising volume. --- 🔹 Bearish Scenario Condition: Weekly close below 22.39 (0.618 Fib). 📉 Downside targets: 1. 18.29 USDT → 0.5 retracement support. 2. 17.04 USDT → 0.618 retracement support. 3. 6.66 USDT (historical low) → only if a deep breakdown unfolds. ⚠️ A breakdown and failed retest below 22.39 would confirm a larger distribution phase. --- 🔹 Key Takeaways for Traders The 22.4 – 24.1 USDT zone is the “make-or-break level.” Holding this level → opens the door for a multi-month bullish trend. Losing this level → signals risk of a mid-term bearish move. Risk management is crucial on the weekly timeframe — stops should be clear (e.g., below 22 for long setups). --- 🎯 Conclusion ENS is testing its golden Fibonacci zone — the defining level for its next major move. Bullish case: Hold & breakout → potential targets 30–47 USDT. Bearish case: Breakdown → risk of decline toward 18–17, possibly 6.6 in the long term. 📌 All eyes on the weekly close around 22–24 USDT — a key zone no swing trader or investor should ignore. --- #ENS #ENSUSDT #EthereumNameService #CryptoAnalysis #TechnicalAnalysis #SwingTrading #SupportResistance #Fibonacci #PriceAction