
ENA
Ethena
| تریدر | نوع سیگنال | حد سود/ضرر | زمان انتشار | مشاهده پیام |
|---|---|---|---|---|
 WaveRiders2Rank: 15095 | خرید | حد سود: تعیین نشده حد ضرر: تعیین نشده | 13 hour ago | |
 crypto_profileRank: 19526 | فروش | حد سود: تعیین نشده حد ضرر: تعیین نشده | 12/2/2025 | |
 MarketSnipingRank: 3153 | خرید | حد سود: تعیین نشده حد ضرر: تعیین نشده | 11/25/2025 | |
 Richtv_officialRank: 17518 | خرید | حد سود: تعیین نشده حد ضرر: تعیین نشده | 11/28/2025 | |
 Alpha-GoldFXRank: 34995 | خرید | حد سود: تعیین نشده حد ضرر: تعیین نشده | 11/25/2025 |
Price Chart of Ethena
سود 3 Months :
خلاصه سیگنالهای Ethena
سیگنالهای Ethena
Filter
Sort messages by
Trader Type
Time Frame
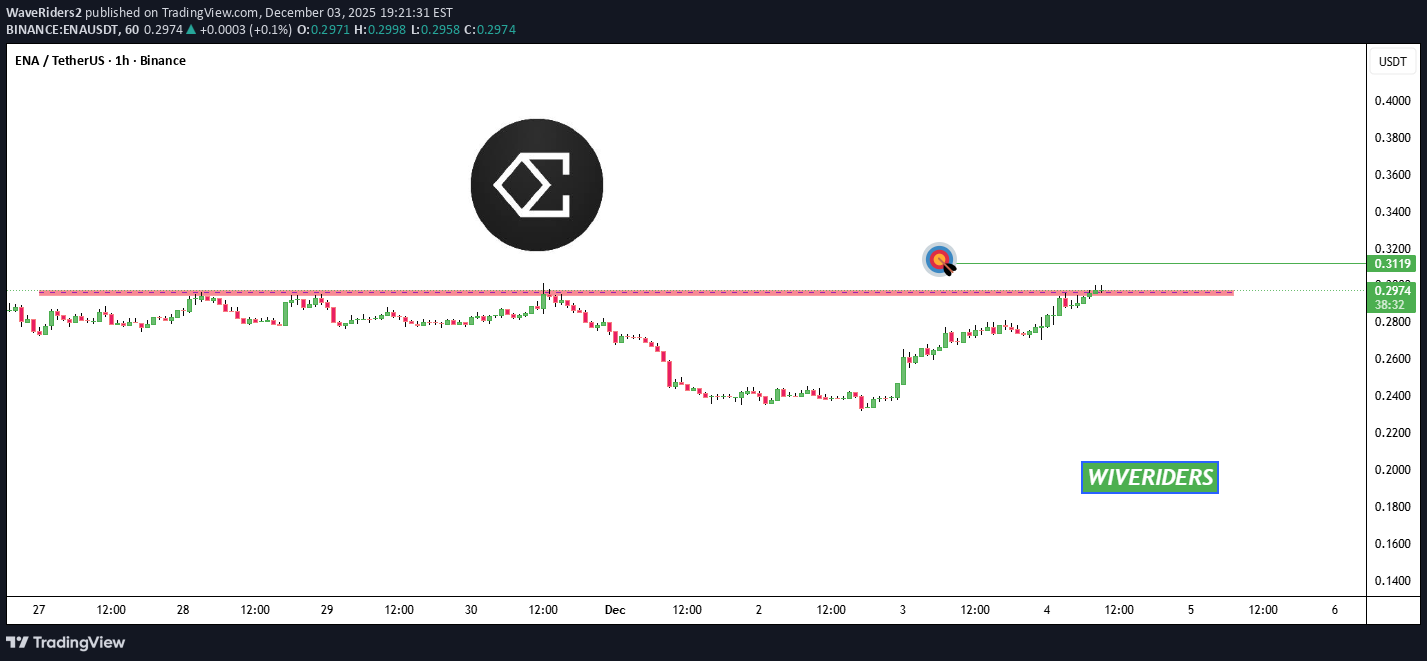
WaveRiders2
crypto_profile
هشدار مهم: سقوط قریبالوقوع بازار پس از تثبیت کوتاهمدت (تحلیل هفتگی)
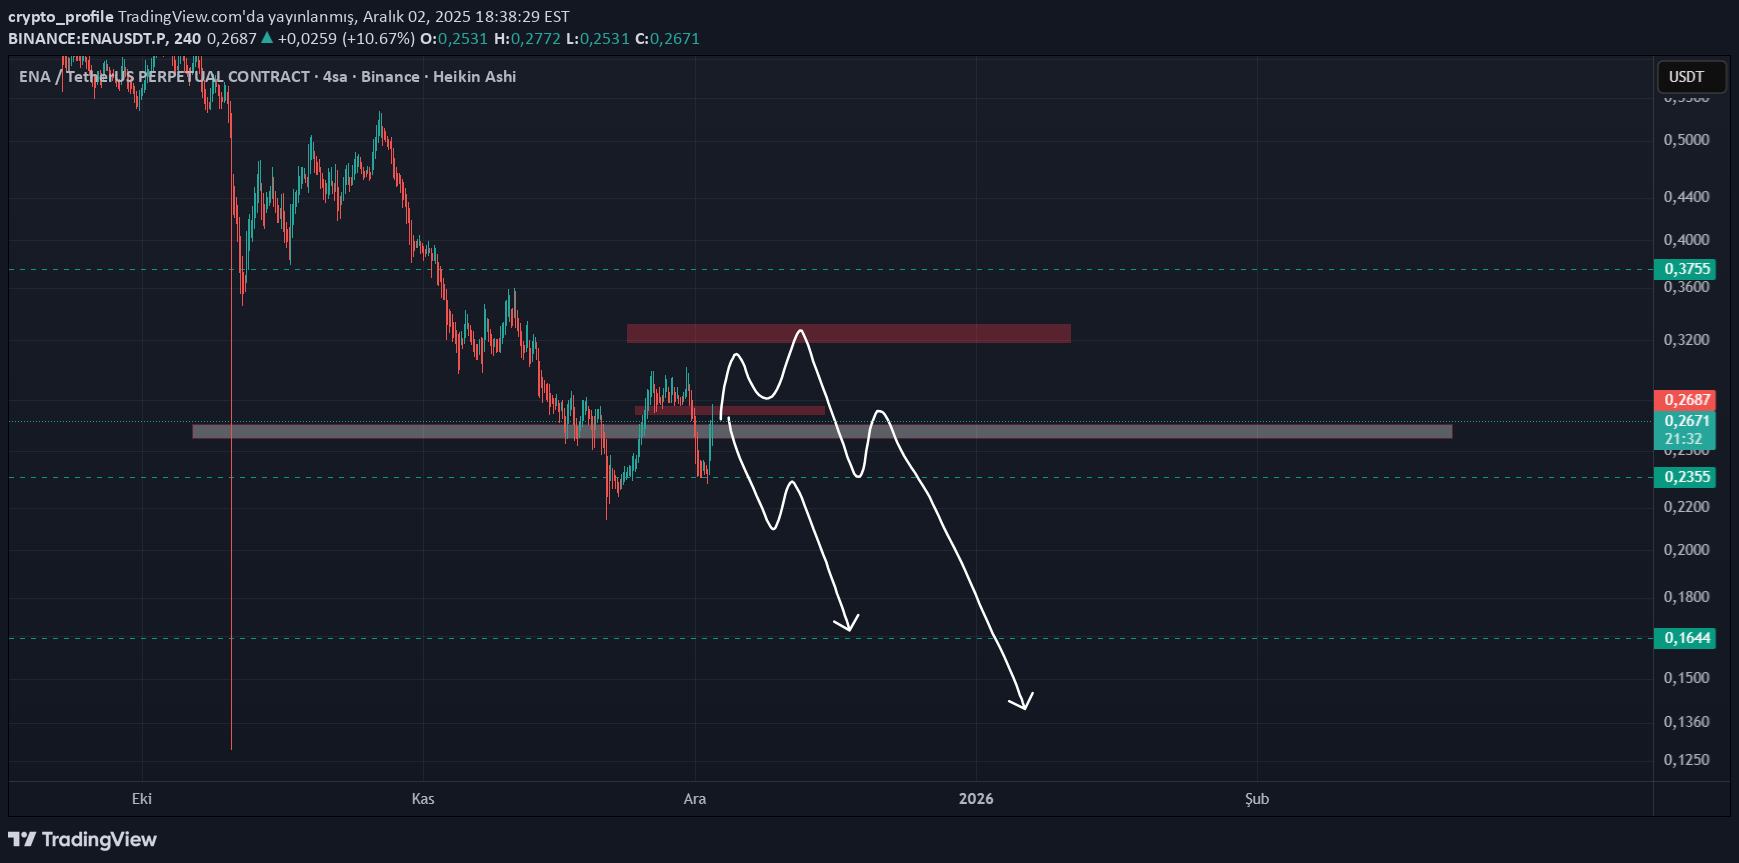
hello friends ena Maybe it may show a recovery here for a week or a few more weeks, but the result will be an inevitable decline of at least 40%. Do not let its current stance mislead you, so while I recommend you to be cautious, I would like to point out that it is not an investment recommendation. I'm trying to keep my graphics very simple and understandable. Be good to yourself. I'll be gone for a while. I love you and entrust you to yourself. Take care of your capital. Every penny will be very valuable.

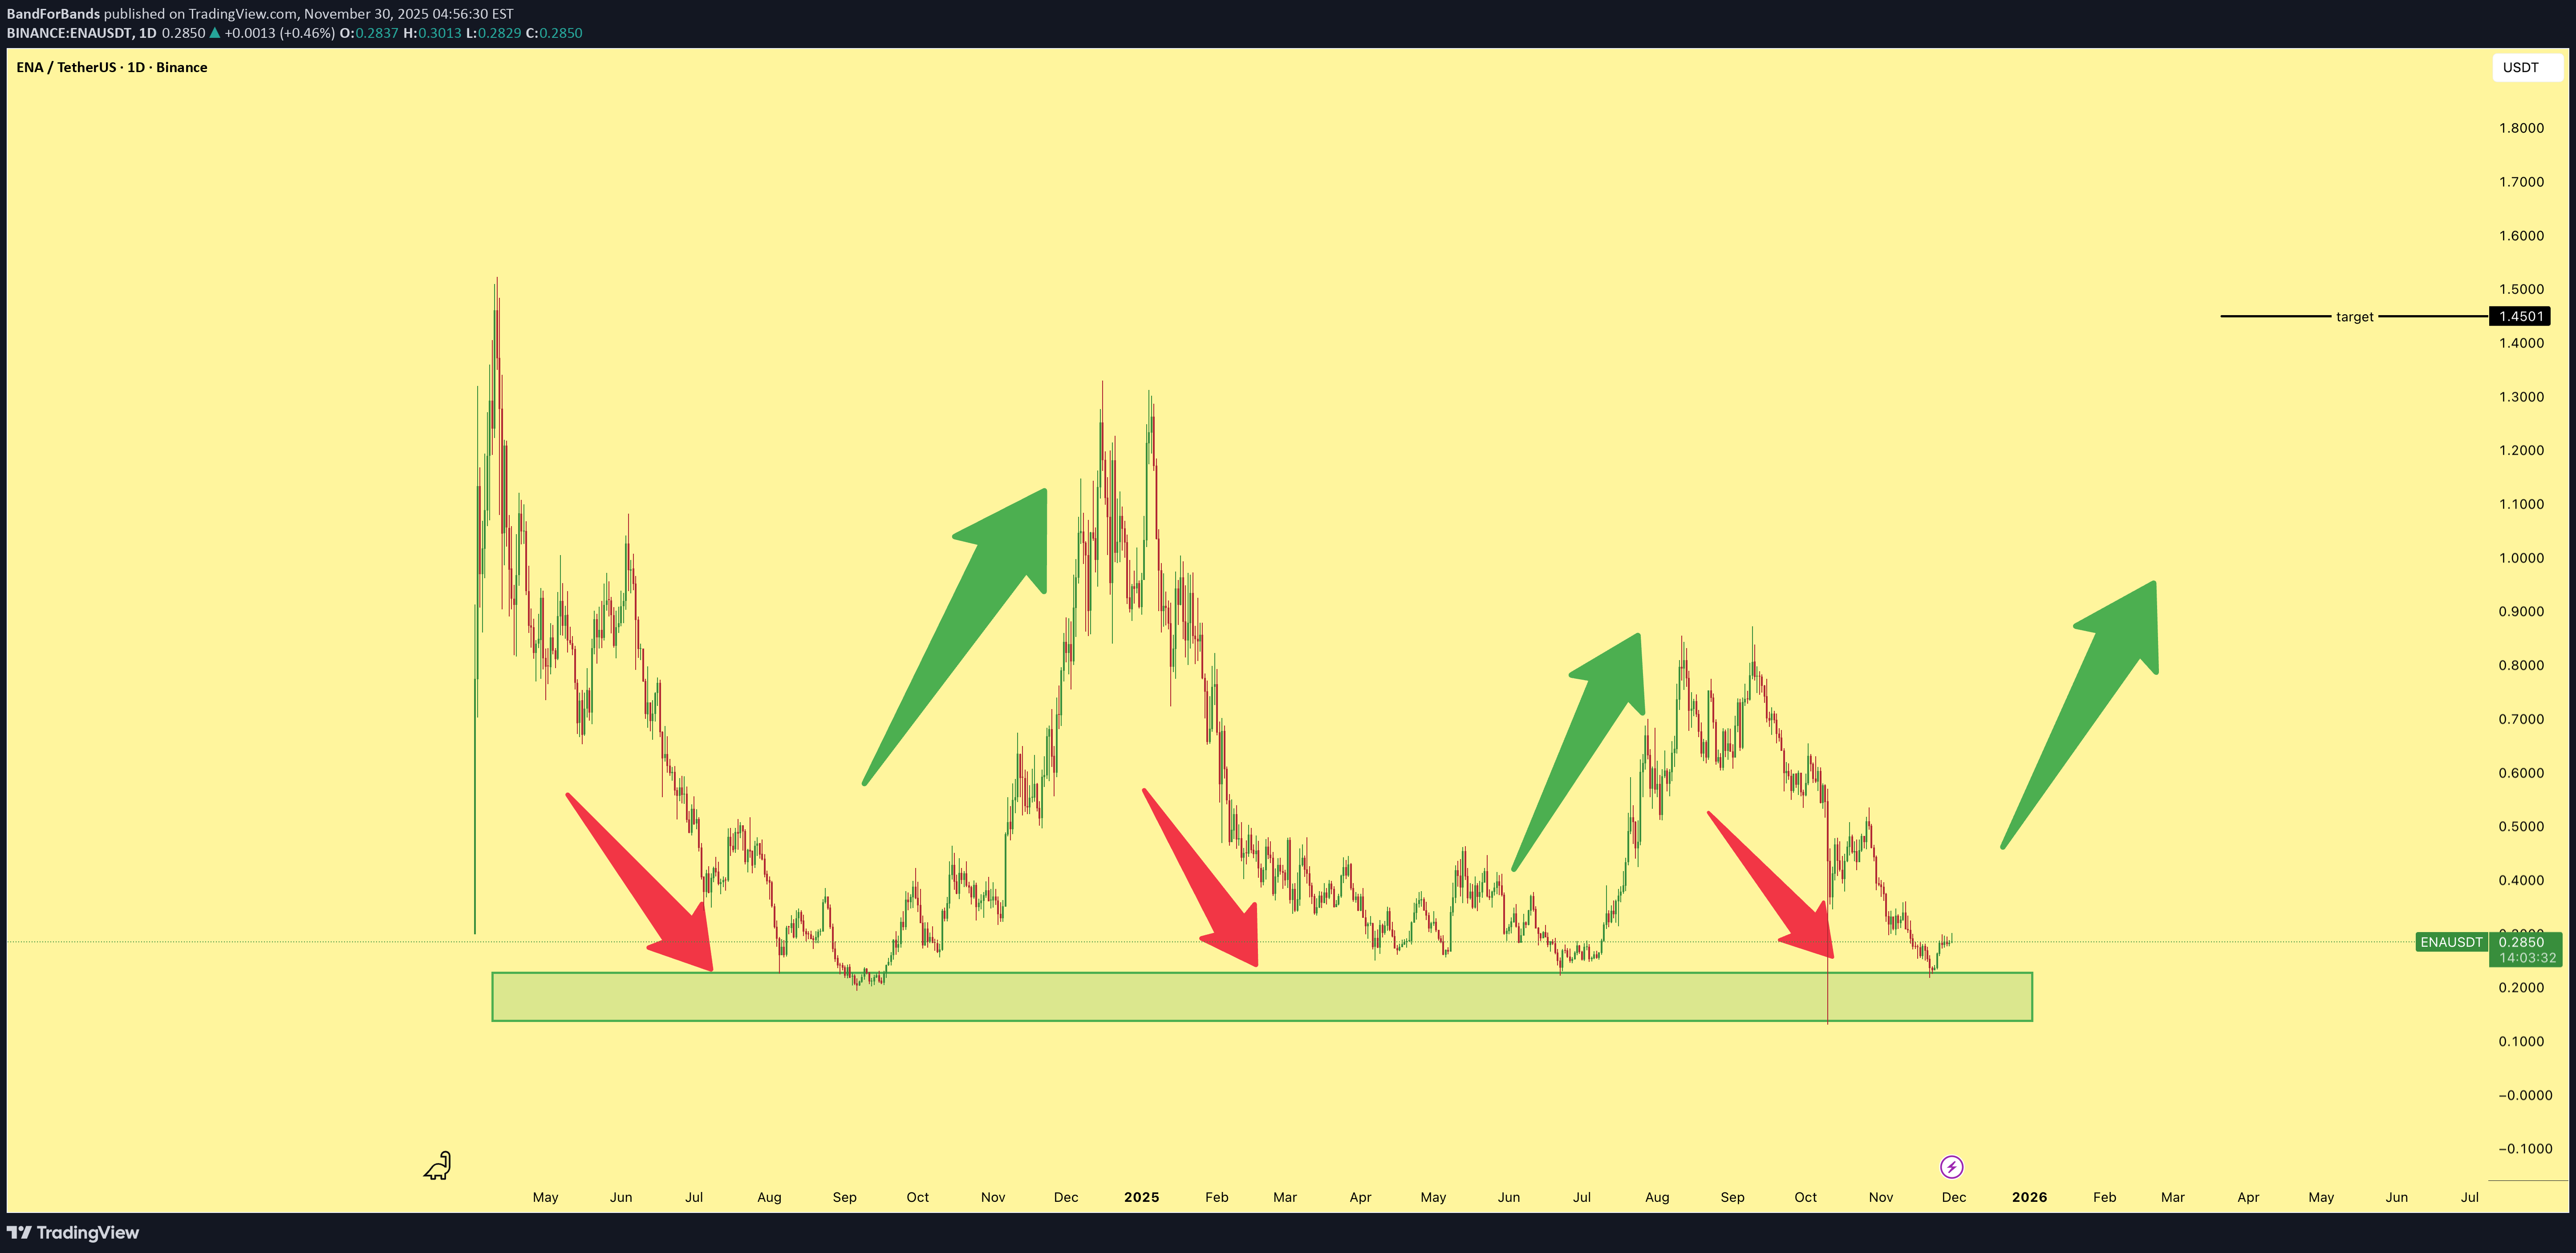
BandForBands
Richtv_official
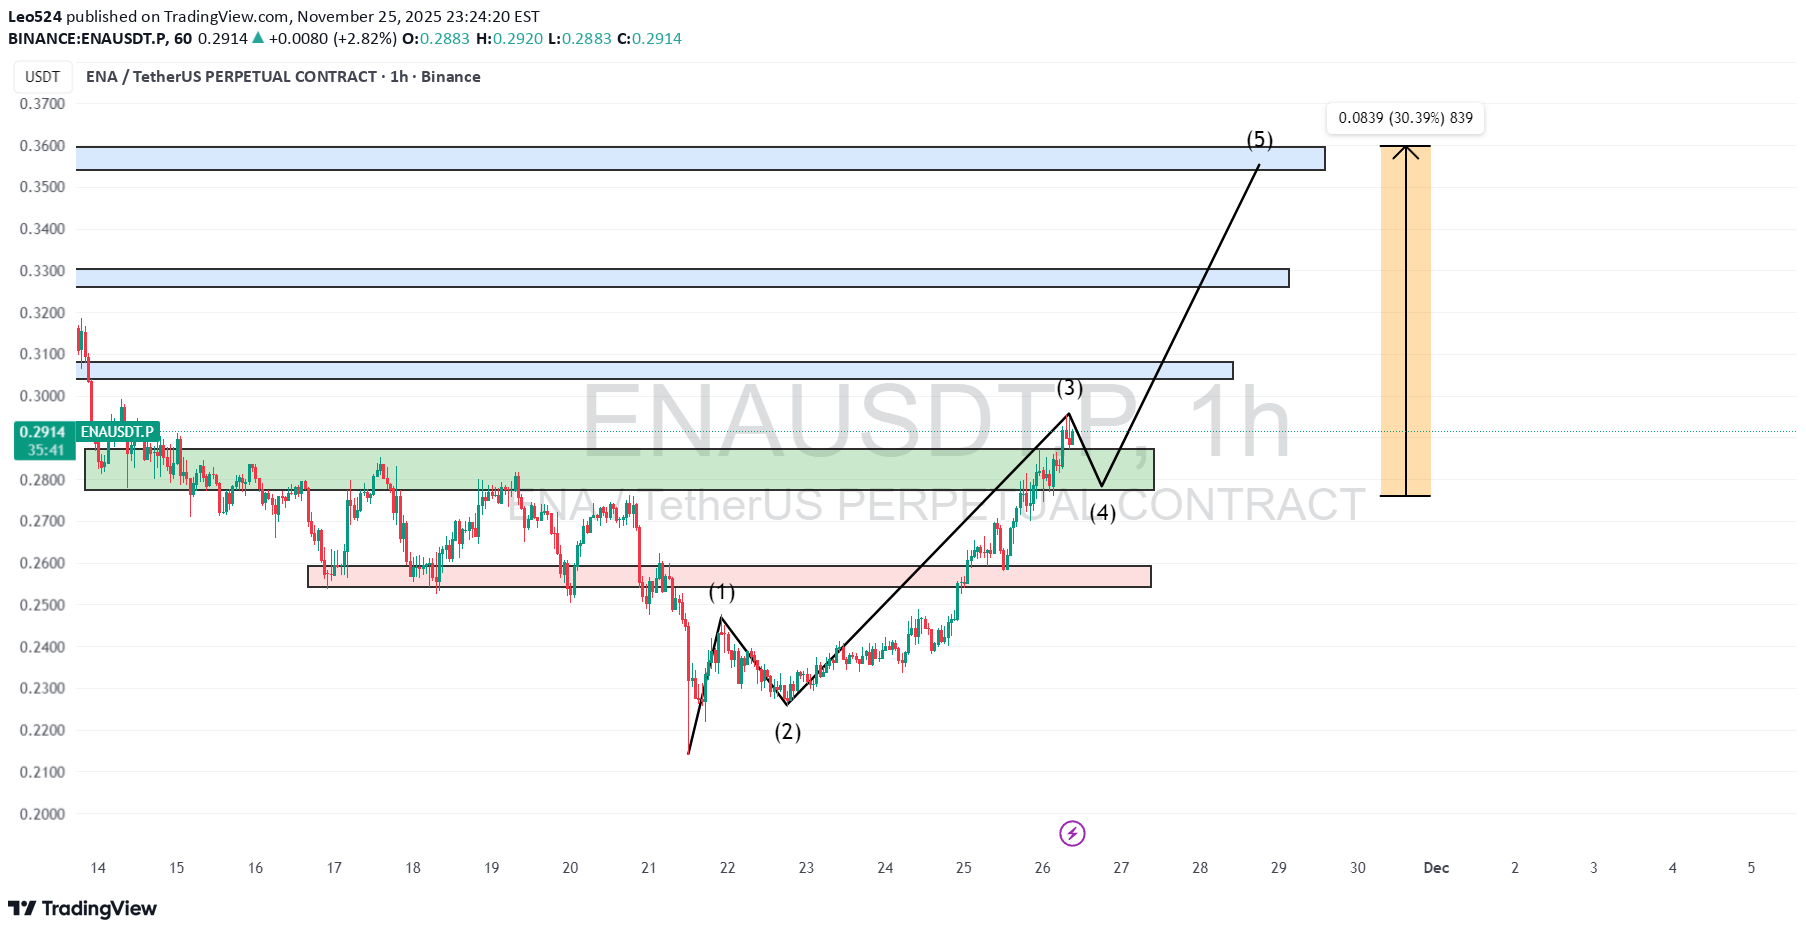
آمادگی ENA برای جهش بزرگ: فرصت خرید طلایی در حمایت ۰.۲۴ دلار!
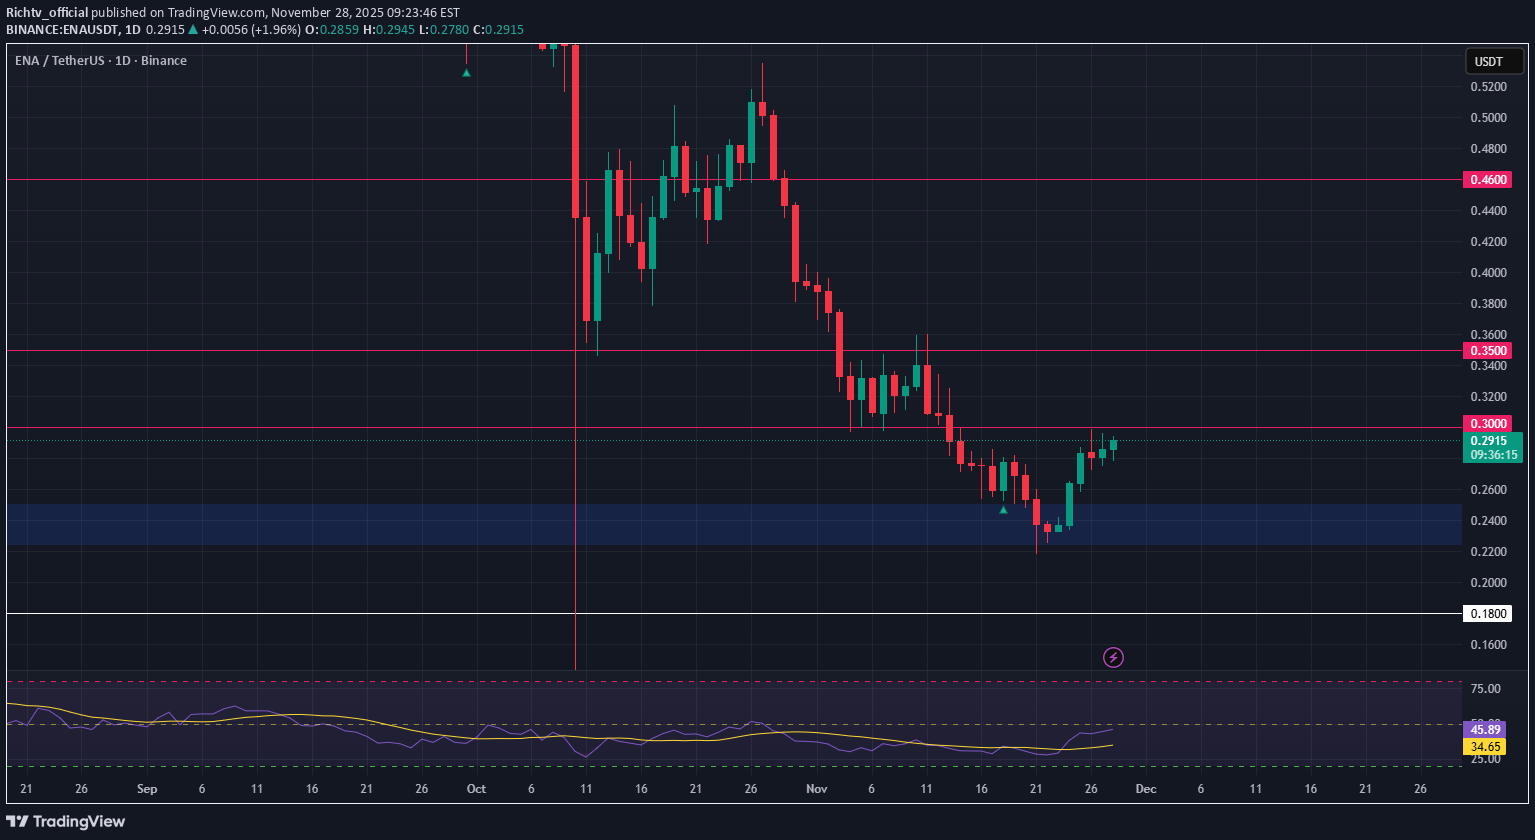
ENA surged 33% following our previous analysis, confirming bullish momentum. Now, price is attempting to reclaim the $0.30 resistance, a key level that could trigger the next leg up. However, failure to break and hold above this zone could lead to a retest of the recent lows, offering another potential long entry at stronger support. The current setup offers a high-conviction entry at $0.24, which aligns with a major support area where buyers have historically stepped in. If this zone holds, we may see a trend reversal and continued upward pressure. Risk is tightly defined, making it attractive for disciplined setups. 🔹 Trade Plan: Entry: $0.24 Take Profit Targets: $0.30 / $0.35 Stop Loss: $0.18 📌 Watching for a reaction near $0.30—break and hold above could shift momentum further bullish.

Crypto4light
تحلیل ENA: اهداف واقعبینانه و استراتژی هوشمندانه برای سودآوری!

ENA, following the IAP model with the wick from October 10, actually invalidated the idea! So, we'll consider that the wick formed a deviation from the yearly range! The first target will be the line marked in green, where the take-profit line on the Daily timeframe of the take-profit indicator is indicated! ENAUSDT Next up: a test of the yearly open and a test of the next daily timeframe's descending hypothetical line! By the end of 2025, there are already no volumes left either for selling or buying! The main volume was scooped up around 30 cents over the summer! If we stick to the plan that Bitcoin dominance will trend down closer to spring, we could see a new all-time high! But set conservative targets across all coins! This cycle is definitely not the time for easy, wild money! This is the time to approach any position and profit-taking with smarts and caution! I explained ENA in more detail earlier today!

mastercrypto2020
سیگنال قطعی فروش (شورت) ارز ENA/USDT: ورود، تارگتها و حد ضرر دقیق!
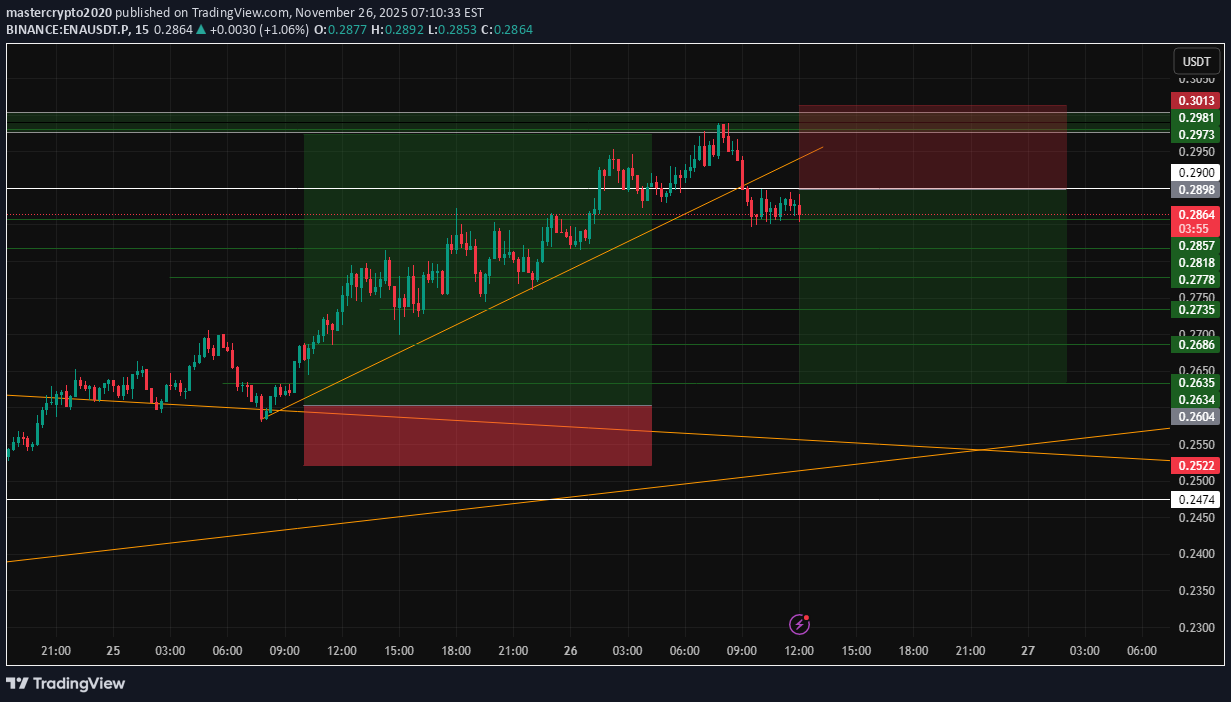
--- 📢 Official Trade Signal – ENA/USDT 📉 Position Type: SHORT 💰 Entry Price: 0.29 0.2960 --- 🎯 Take-Profit Targets (Partial Exits): • TP1 = 0.2857 • TP2 = 0.2818 • TP3 = 0.2778 • TP4 = 0.2734 • TP5 = 0.2686 • TP6 = 0.2635 --- 🛑 Stop-Loss: 0.3013 📊 Timeframe: 15m ⚖️ Risk/Reward Ratio: 3.65 💥 Suggested Leverage: 5× – 10× --- 🧠 Technical Analysis Summary ENA is showing clear bearish structure after rejecting strongly from the 0.2980–0.3020 supply zone. Price continues forming lower-highs & lower-lows, confirming short-term downside momentum on the 15m chart. Volume shift indicates seller dominance, with liquidity pockets aligning perfectly with our TP levels: 0.2857 → 0.2818 → 0.2778 → 0.2734 → 0.2686 → 0.2635 A breakdown below 0.2857 (TP1 zone) increases the probability of continuation toward deeper liquidity. --- ⚙️ Trade Management Rules ✔️ Take partial profit at TP1 ✔️ Move SL to Break-Even once TP1 hits ✔️ Trail SL as price approaches each new TP ✔️ Do NOT re-enter if SL is hit ✔️ Enter only with confirmed bearish structure --- ⚠️ Risk-Management Note After TP1 hits → SL moves to Break-Even. If price reverses & taps BE, it results in zero loss — capital protection mode. Risk management is always the top priority. --- 📌 TradingView Hashtags #ENAUSDT #ENA #CryptoSignal #ShortSetup #TradingView #FuturesTrading #Altcoins #TechnicalAnalysis -
mastercrypto2020
سیگنال شورت ENA/USDT: ورود به موقعیت فروش با اهداف سود مشخص و مدیریت ریسک حرفهای
--- 📢 Official Trade Signal – ENA/USDT 📉 Position Type: SHORT 💰 Entry Price: 0.29 0.2960 --- 🎯 Take-Profit Targets (Partial Exits): • TP1 = 0.2857 • TP2 = 0.2818 • TP3 = 0.2778 • TP4 = 0.2734 • TP5 = 0.2686 • TP6 = 0.2635 --- 🛑 Stop-Loss: 0.3013 📊 Timeframe: 15m ⚖️ Risk/Reward Ratio: 3.65 💥 Suggested Leverage: 5× – 10× --- 🧠 Technical Analysis Summary ENA is showing clear bearish structure after rejecting strongly from the 0.2980–0.3020 supply zone. Price continues forming lower-highs & lower-lows, confirming short-term downside momentum on the 15m chart. Volume shift indicates seller dominance, with liquidity pockets aligning perfectly with our TP levels: 0.2857 → 0.2818 → 0.2778 → 0.2734 → 0.2686 → 0.2635 A breakdown below 0.2857 (TP1 zone) increases the probability of continuation toward deeper liquidity. --- ⚙️ Trade Management Rules ✔️ Take partial profit at TP1 ✔️ Move SL to Break-Even once TP1 hits ✔️ Trail SL as price approaches each new TP ✔️ Do NOT re-enter if SL is hit ✔️ Enter only with confirmed bearish structure --- ⚠️ Risk-Management Note After TP1 hits → SL moves to Break-Even. If price reverses & taps BE, it results in zero loss — capital protection mode. Risk management is always the top priority. --- 📌 TradingView Hashtags #ENAUSDT #ENA #CryptoSignal #ShortSetup #TradingView #FuturesTrading #Altcoins #TechnicalAnalysis -
mastercrypto2020
سیگنال فروش فوری: معامله ارز ENA/USDT با اهداف سود مشخص و استاپلاس دقیق!
--- 📢 Official Trade Signal – ENA/USDT 📉 Position Type: SHORT 💰 Entry Price: 0.29 0.2960 --- 🎯 Take-Profit Targets (Partial Exits): • TP1 = 0.2857 • TP2 = 0.2818 • TP3 = 0.2778 • TP4 = 0.2734 • TP5 = 0.2686 • TP6 = 0.2635 --- 🛑 Stop-Loss: 0.3013 📊 Timeframe: 15m ⚖️ Risk/Reward Ratio: 3.65 💥 Suggested Leverage: 5× – 10× --- 🧠 Technical Analysis Summary ENA is showing clear bearish structure after rejecting strongly from the 0.2980–0.3020 supply zone. Price continues forming lower-highs & lower-lows, confirming short-term downside momentum on the 15m chart. Volume shift indicates seller dominance, with liquidity pockets aligning perfectly with our TP levels: 0.2857 → 0.2818 → 0.2778 → 0.2734 → 0.2686 → 0.2635 A breakdown below 0.2857 (TP1 zone) increases the probability of continuation toward deeper liquidity. --- ⚙️ Trade Management Rules ✔️ Take partial profit at TP1 ✔️ Move SL to Break-Even once TP1 hits ✔️ Trail SL as price approaches each new TP ✔️ Do NOT re-enter if SL is hit ✔️ Enter only with confirmed bearish structure --- ⚠️ Risk-Management Note After TP1 hits → SL moves to Break-Even. If price reverses & taps BE, it results in zero loss — capital protection mode. Risk management is always the top priority. --- 📌 TradingView Hashtags #ENAUSDT #ENA #CryptoSignal #ShortSetup #TradingView #FuturesTrading #Altcoins #TechnicalAnalysis -
mastercrypto2020
سیگنال فروش فوری ارز ENA/USDT: ورود به موقعیت شورت با اهداف سود جذاب!
--- 📢 Official Trade Signal – ENA/USDT 📉 Position Type: SHORT 💰 Entry Price: 0.29 0.2960 --- 🎯 Take-Profit Targets (Partial Exits): • TP1 = 0.2857 • TP2 = 0.2818 • TP3 = 0.2778 • TP4 = 0.2734 • TP5 = 0.2686 • TP6 = 0.2635 --- 🛑 Stop-Loss: 0.3013 📊 Timeframe: 15m ⚖️ Risk/Reward Ratio: 3.65 💥 Suggested Leverage: 5× – 10× --- 🧠 Technical Analysis Summary ENA is showing clear bearish structure after rejecting strongly from the 0.2980–0.3020 supply zone. Price continues forming lower-highs & lower-lows, confirming short-term downside momentum on the 15m chart. Volume shift indicates seller dominance, with liquidity pockets aligning perfectly with our TP levels: 0.2857 → 0.2818 → 0.2778 → 0.2734 → 0.2686 → 0.2635 A breakdown below 0.2857 (TP1 zone) increases the probability of continuation toward deeper liquidity. --- ⚙️ Trade Management Rules ✔️ Take partial profit at TP1 ✔️ Move SL to Break-Even once TP1 hits ✔️ Trail SL as price approaches each new TP ✔️ Do NOT re-enter if SL is hit ✔️ Enter only with confirmed bearish structure --- ⚠️ Risk-Management Note After TP1 hits → SL moves to Break-Even. If price reverses & taps BE, it results in zero loss — capital protection mode. Risk management is always the top priority. --- 📌 TradingView Hashtags #ENAUSDT #ENA #CryptoSignal #ShortSetup #TradingView #FuturesTrading #Altcoins #TechnicalAnalysis -

تحلیل لحظهای ENA: آیا این حمایت کلید صعود کوتاه مدت است؟
📌If ENA RETESTS this SUPPORT ZONE, a short-term price increase can be expected🔥 🔴This support zone must be held for the price to increase ✅
Disclaimer
Any content and materials included in Sahmeto's website and official communication channels are a compilation of personal opinions and analyses and are not binding. They do not constitute any recommendation for buying, selling, entering or exiting the stock market and cryptocurrency market. Also, all news and analyses included in the website and channels are merely republished information from official and unofficial domestic and foreign sources, and it is obvious that users of the said content are responsible for following up and ensuring the authenticity and accuracy of the materials. Therefore, while disclaiming responsibility, it is declared that the responsibility for any decision-making, action, and potential profit and loss in the capital market and cryptocurrency market lies with the trader.