
EGLD
Elrond
| تریدر | نوع سیگنال | حد سود/ضرر | زمان انتشار | مشاهده پیام |
|---|---|---|---|---|
No results found. | ||||
Price Chart of Elrond
سود 3 Months :
سیگنالهای Elrond
Filter
Sort messages by
Trader Type
Time Frame

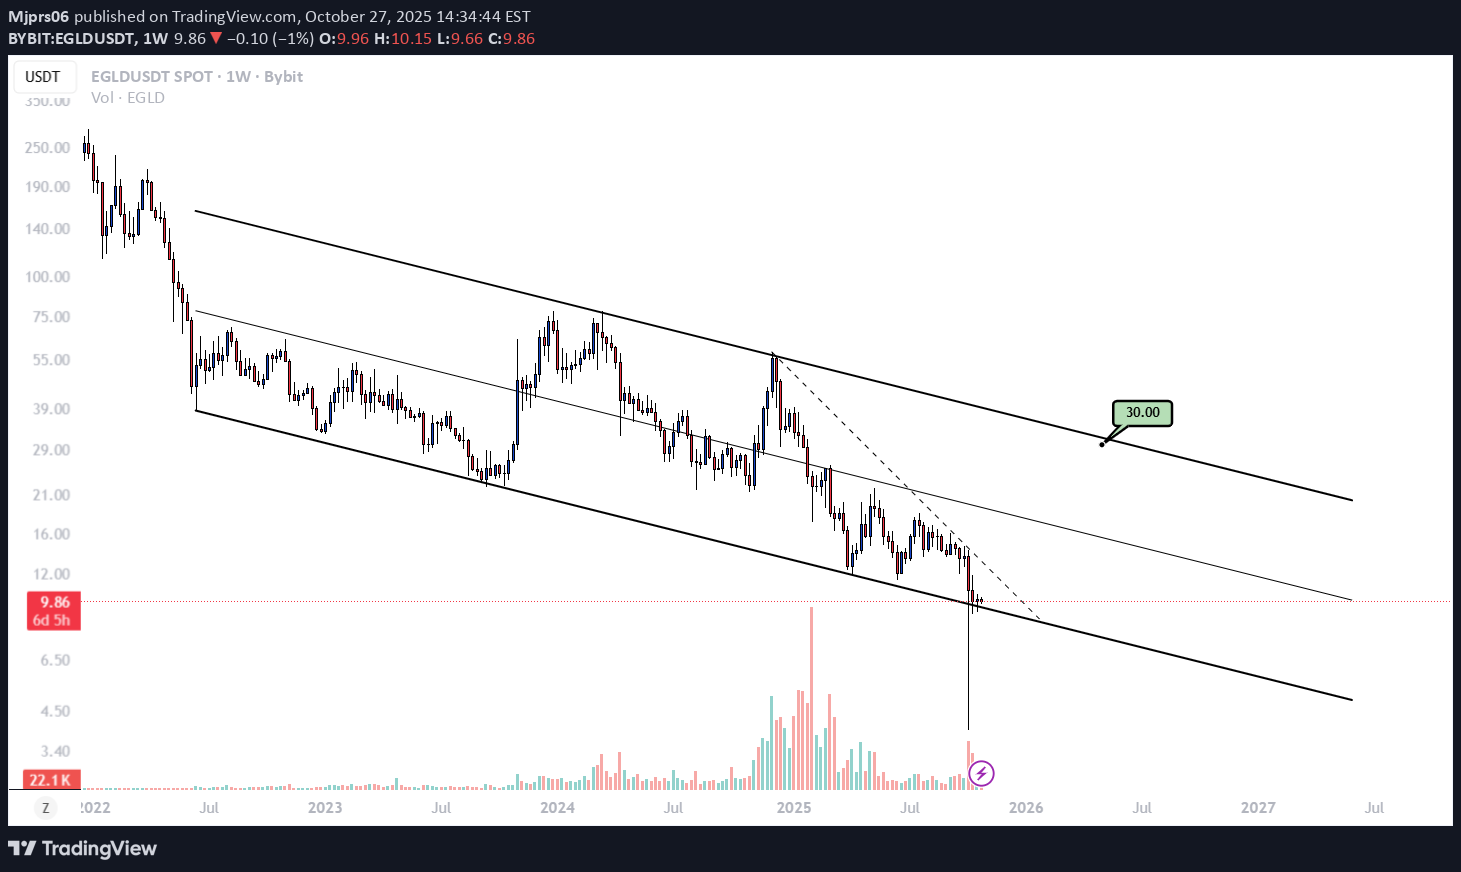
سقوط ادامهدار EGLD: آیا کانال نزولی شکسته میشود یا تله خریداران است؟

The price action for EGLD is in a well-defined descending channel since early 2022, mapping out lower highs and lower lows as the asset retraced from its previous bull market peak. Whenever EGLD reached the lower part of its descending channel, price has historically tended to reverse upward, offering short-lived relief rallies. This setup remains highly speculative and should be approached with caution. The downtrend has repeatedly disappointed, with many previous bounces failing to deliver sustained upside or meaningful trend changes. For this reason, any trades initiated at the channel lows are best sized conservatively, allocate only a small portion of capital. The $21 level represents a significant resistance for EGLD, if price approaches $21 during a reversal, taking profit will be a good idea.

Mjprs06
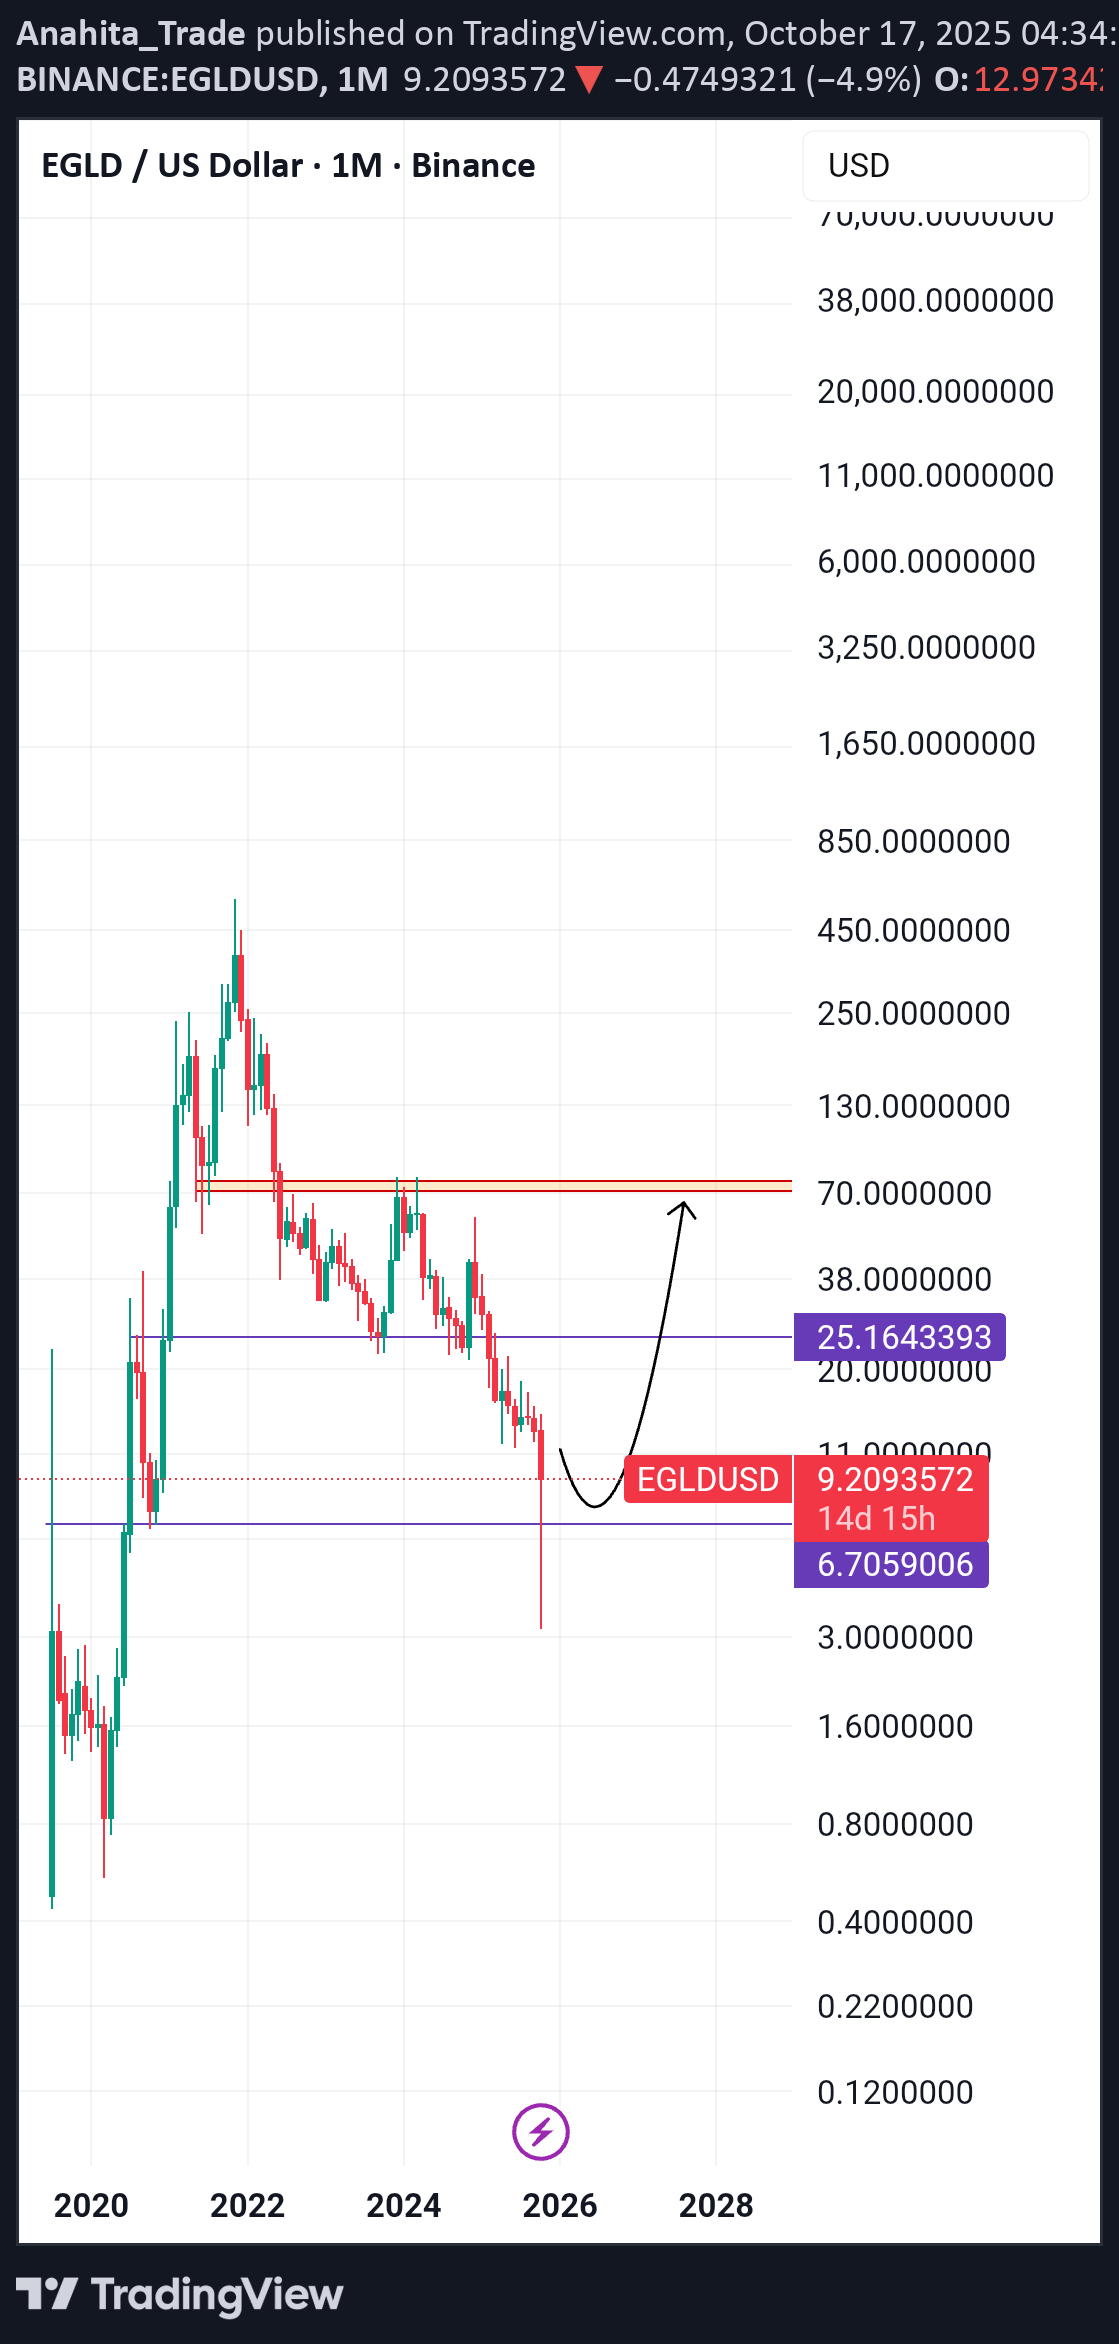
تحلیل شگفتانگیز EGLD: آیا وقت خروج از کانال نزولی فرا رسیده است؟
The EGLD currency is at the bottom of a descending channel in which it has been moving for more than 1200 days. Positive divergences are observed on the MACD and RSI, and in my opinion, it could move towards the midline and then the upper range of the channel if it breaks its downward trendline. What is your opinion on this?

Anahita_Trade
الروند (EGLD) به اوج بازمیگردد؟ پایان اصلاح قیمت و طلوع دوباره!
Elrond could be grow up to zone level It has been a long time in price correction and decline

Mihai_Iacob
بررسی اجمالی EGLD: آیا لمس مجدد حمایت ۱۲ دلاری، آغازگر صعود انفجاری خواهد بود؟

EGLD has been on my radar for quite some time... After forming a major low in April and rallying back toward the $22 zone, the coin pulled back again — effectively confirming that level as strong support. By the end of September, price revisited the $12 area for the third time, and once again buyers stepped in decisively, triggering a solid rebound. Now, EGLD trades around $14, sitting just below a falling trendline that has capped upside momentum for months. ________________________________________ Technical Outlook •Support: $12 (triple-tested, major demand zone) •Resistance: Falling trendline around $14–15 •Soft target: $22 (key resistance and prior reversal area) ________________________________________ My Trading View Given the strength of this repeated support and the contracting structure, I believe this trendline resistance is likely to break soon. If momentum follows through, EGLD could accelerate sharply to the upside, mirroring past explosive moves. The setup remains constructive — buying dips above $12 could offer a strong risk–reward opportunity heading into the next leg higher.

Bithereum_io
تحلیل تکنیکال EGLD: شکست مثلث نزولی و اهداف صعودی جدید!

#EGLD is trading within a descending triangle on the daily chart. In case of a breakout above the triangle resistance and the daily SMA50, the potential targets are: 🎯 $15.20 🎯 $16.19 🎯 $17.17 🎯 $18.58 🎯 $20.37 ⚠️ Always remember to use a tight stop-loss and maintain proper risk management.

CryptoWithJames
تحلیل تکنیکال EGLD: شکسته شدن الگوی گوه نزولی و هدف قیمتی خیرهکننده!

#EGLD UPDATE EGLD Technical Setup Pattern: Bullish falling wedge pattern Current Price: $27.60 Target Price: $43.20 Target % Gain: 56.52% EGLD is breaking out of a falling wedge pattern on the 1D timeframe. Current price is $27.60 with a target near $43.20, showing about 56% potential upside. The breakout confirms bullish momentum, suggesting possible continuation if volume sustains. Always use proper risk management. Time Frame: 1D Risk Management Tip: Always use proper risk management.

Coin-Hastasi
آینده درخشان EGLD/USDT: چرا این ارز دیجیتال باید به 500 دلار برسد؟

02.10.2025 #egldusdt this coin is not these places, friends, who believes in me, if there are 550s, it is a pity that I will buy it a little.

Adel_aboalainain
تحلیل انفجاری EGLD: آیا موج صعودی عظیم در راه است؟ (هدف ۳۰ تا ۷۰ دلار!)

🚀 Technical Analysis Summary: EGLD has successfully completed a textbook inverse head and shoulders pattern, signaling a strong bullish reversal after an extended downtrend. The neckline breakout is imminent and could ignite a significant upside move. 📈 Accumulation Zone: Price has consolidated within a well-defined range over the past several months, forming a large accumulation base, which typically precedes a strong bullish rally — especially when whales and smart money are involved. 🧠 Prediction Using AI Models: Our internal LSTM-based model projects an initial price target of $30 post-breakout. If EGLD manages to flip the $30 resistance into support, the next leg could take us to $70, especially under strong liquidity inflow and market-wide bullish sentiment. 📊 Key Technical Indicators: MACD: Bullish crossover forming — momentum shift confirmed. RSI: Turning upwards from neutral zone (~50), suggesting early momentum. Volume: Gradually increasing on upswings — signaling smart money activity. 💡 Trade Setup: Entry: Current zone ($13.90–$14.20) upon breakout confirmation Stop Loss: Below right shoulder ~$11.80 Target 1: $30 Target 2: $70 (with volume expansion and market confirmation) 📉 Risk/Reward: Highly favorable (~1:5 or more if held to $70). 🧠 Strategic Notes: Strong weekly and monthly resistance near $30 — watch for reaction. If we observe a volume spike + RSI breakout above 60, it confirms bullish continuation. This idea aligns with historical behavior of EGLD following major reversal patterns. 📬 Exit Strategy (if expecting parabolic move): Sell 25% at $30. Sell another 25% at $50. Keep 25% for $70. Last 25% trailing stop-loss or exit at overbought RSI divergence.

The_Alchemist_Trader_
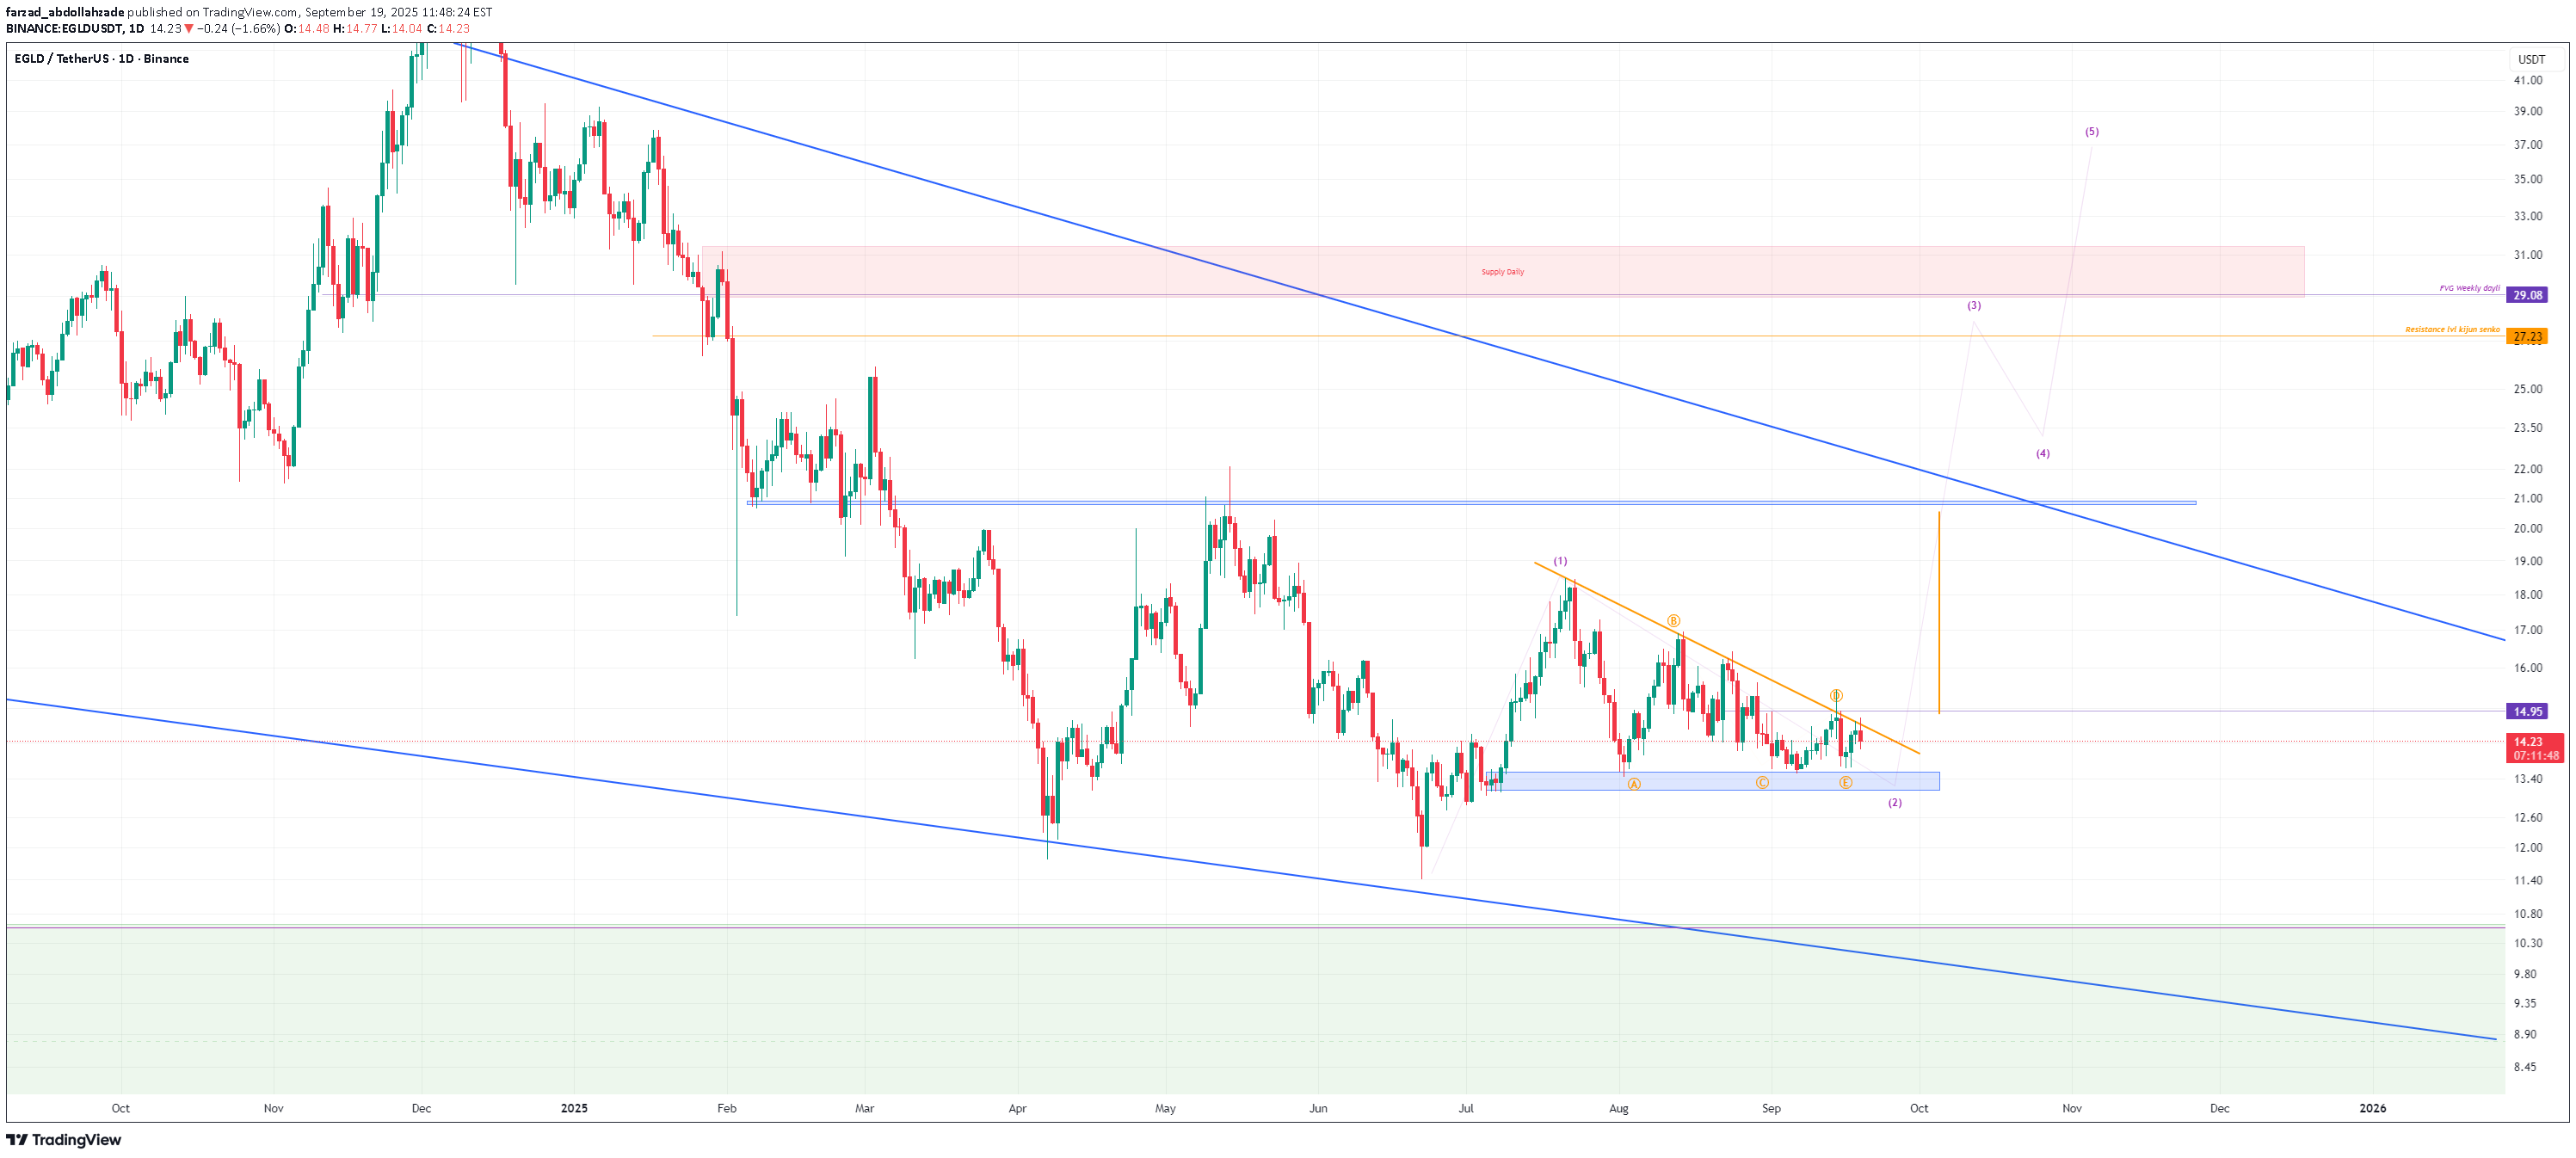
EGOLD Consolidates at Critical Swing Low Around $11.47

EGOLD is consolidating at support, with traders closely monitoring the $11.47 level. A sweep here could fuel bullish expansion toward $20, while a breakdown risks further correction. Introduction: EGOLD’s prolonged consolidation has placed the spotlight on its key swing low at $11.47. How price reacts around this level will determine whether a bullish reversal unfolds or a deeper correction takes hold. Key Technical Points: - $11.47 is the critical swing low level. - A liquidity sweep opens potential for bullish expansion. - Breakdown below $11.47 could trigger a deeper correction. Price action has been consolidating, with multiple retests reinforcing $11.47 as a major decision point. A wick through this swing low could act as a liquidity grab, fueling a bullish impulse toward $20. On the other hand, a decisive close below this level would confirm bearish continuation. Market participants should be cautious, as consolidation near such a critical swing low often precedes high-volatility moves. What to Expect in the Coming Price Action: If EGOLD can hold above $11.47, a bullish push toward $20 is possible. However, failure here could deepen the correction significantly.

farzad_abdollahzade
egldusdt
The EGLD currency is in a triangle pattern. I think the targets are clear with an upward breakout.
Disclaimer
Any content and materials included in Sahmeto's website and official communication channels are a compilation of personal opinions and analyses and are not binding. They do not constitute any recommendation for buying, selling, entering or exiting the stock market and cryptocurrency market. Also, all news and analyses included in the website and channels are merely republished information from official and unofficial domestic and foreign sources, and it is obvious that users of the said content are responsible for following up and ensuring the authenticity and accuracy of the materials. Therefore, while disclaiming responsibility, it is declared that the responsibility for any decision-making, action, and potential profit and loss in the capital market and cryptocurrency market lies with the trader.