
florin_9494
@t_florin_9494

What symbols does the trader recommend buying?
Purchase History
پیام های تریدر
Filter
ENA: Bullish Setup
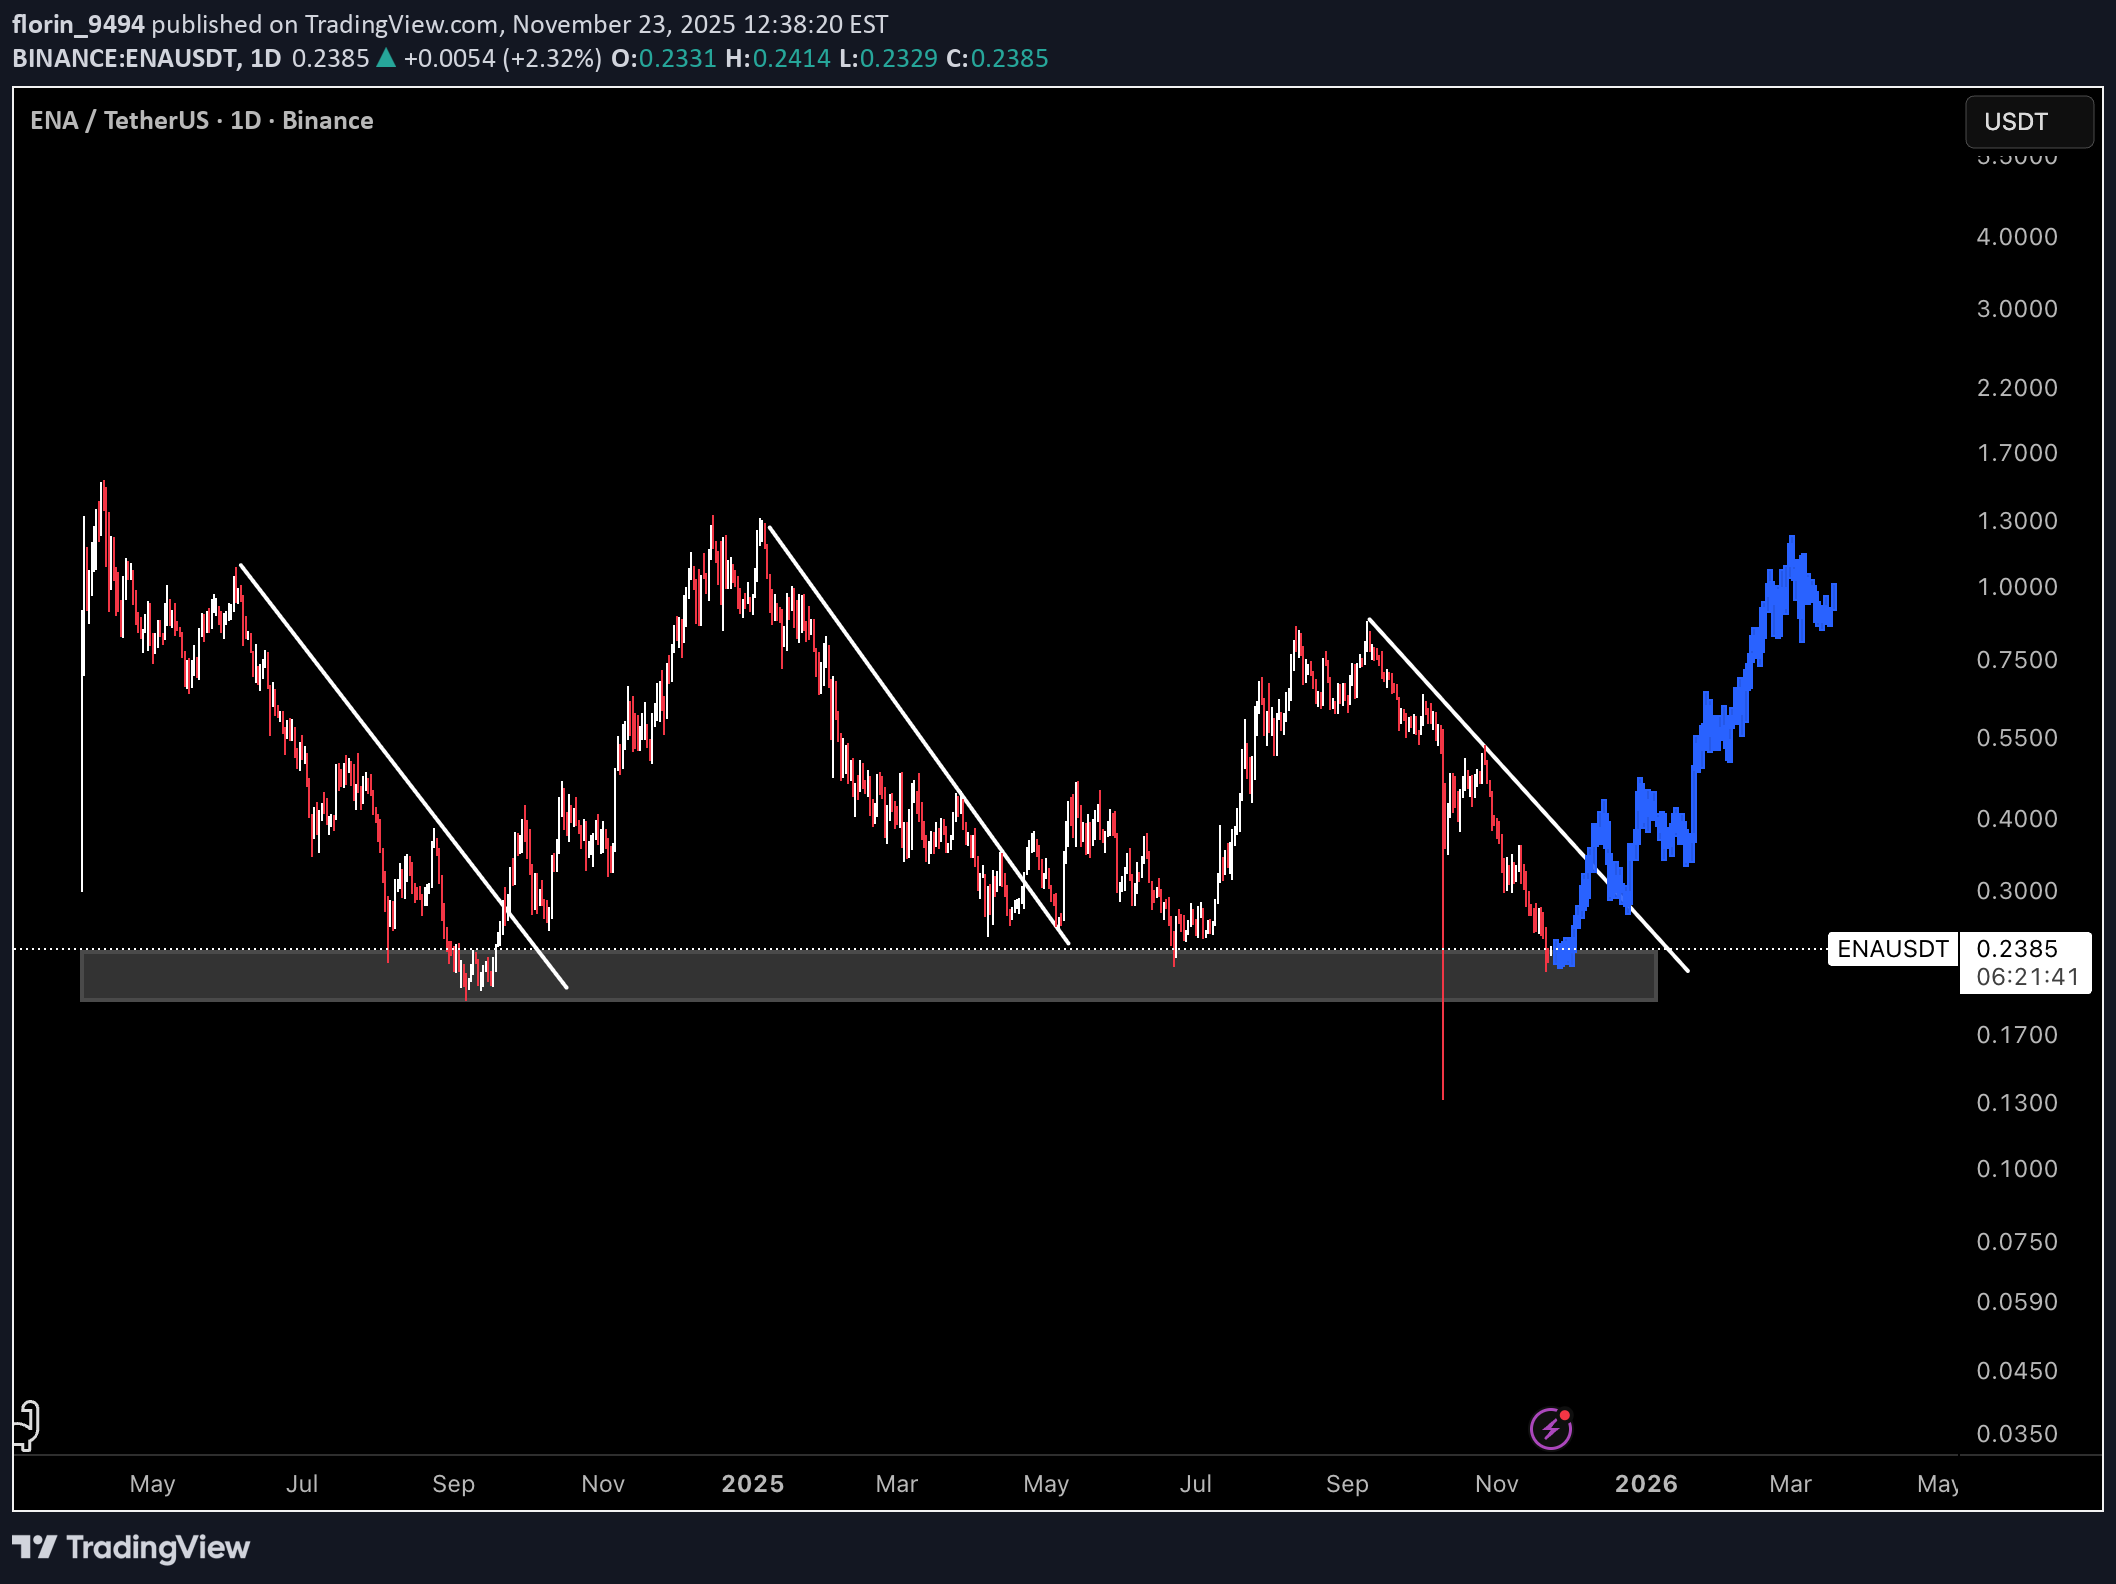
This chart displays ENA on a daily timeframe, with clear structure pointing to a favorable long entry. The current price action is trading within a major support zone, where previous trendline breaks have consistently marked the start of impulsive moves. Historically, every time ENA breaks out above the descending trendline, the asset tends to retest the breakout level before accelerating higher. A blue fractal shows past price evolution from October last year, highlighting the repeatable bullish pattern as price reverses trend, retests the breakout, and rallies to new highs. As always, use prudent position sizing and stop-losses, particularly if support fails to hold. This bullish setup is most likely to play out if the FED decides to cut interest rates in December. It could serve as a strong macro catalyst to support the pattern shown here. Thus, watch for confirmation from the Fed policy easing may power the next leg up for ENA and similar assets.
سقوط ادامهدار EGLD: آیا کانال نزولی شکسته میشود یا تله خریداران است؟

The price action for EGLD is in a well-defined descending channel since early 2022, mapping out lower highs and lower lows as the asset retraced from its previous bull market peak. Whenever EGLD reached the lower part of its descending channel, price has historically tended to reverse upward, offering short-lived relief rallies. This setup remains highly speculative and should be approached with caution. The downtrend has repeatedly disappointed, with many previous bounces failing to deliver sustained upside or meaningful trend changes. For this reason, any trades initiated at the channel lows are best sized conservatively, allocate only a small portion of capital. The $21 level represents a significant resistance for EGLD, if price approaches $21 during a reversal, taking profit will be a good idea.
رمزگشایی رفتار بیت کوین: لمس میانگین متحرک 100 هفتهای در بازار صعودی چه هشداری میدهد؟
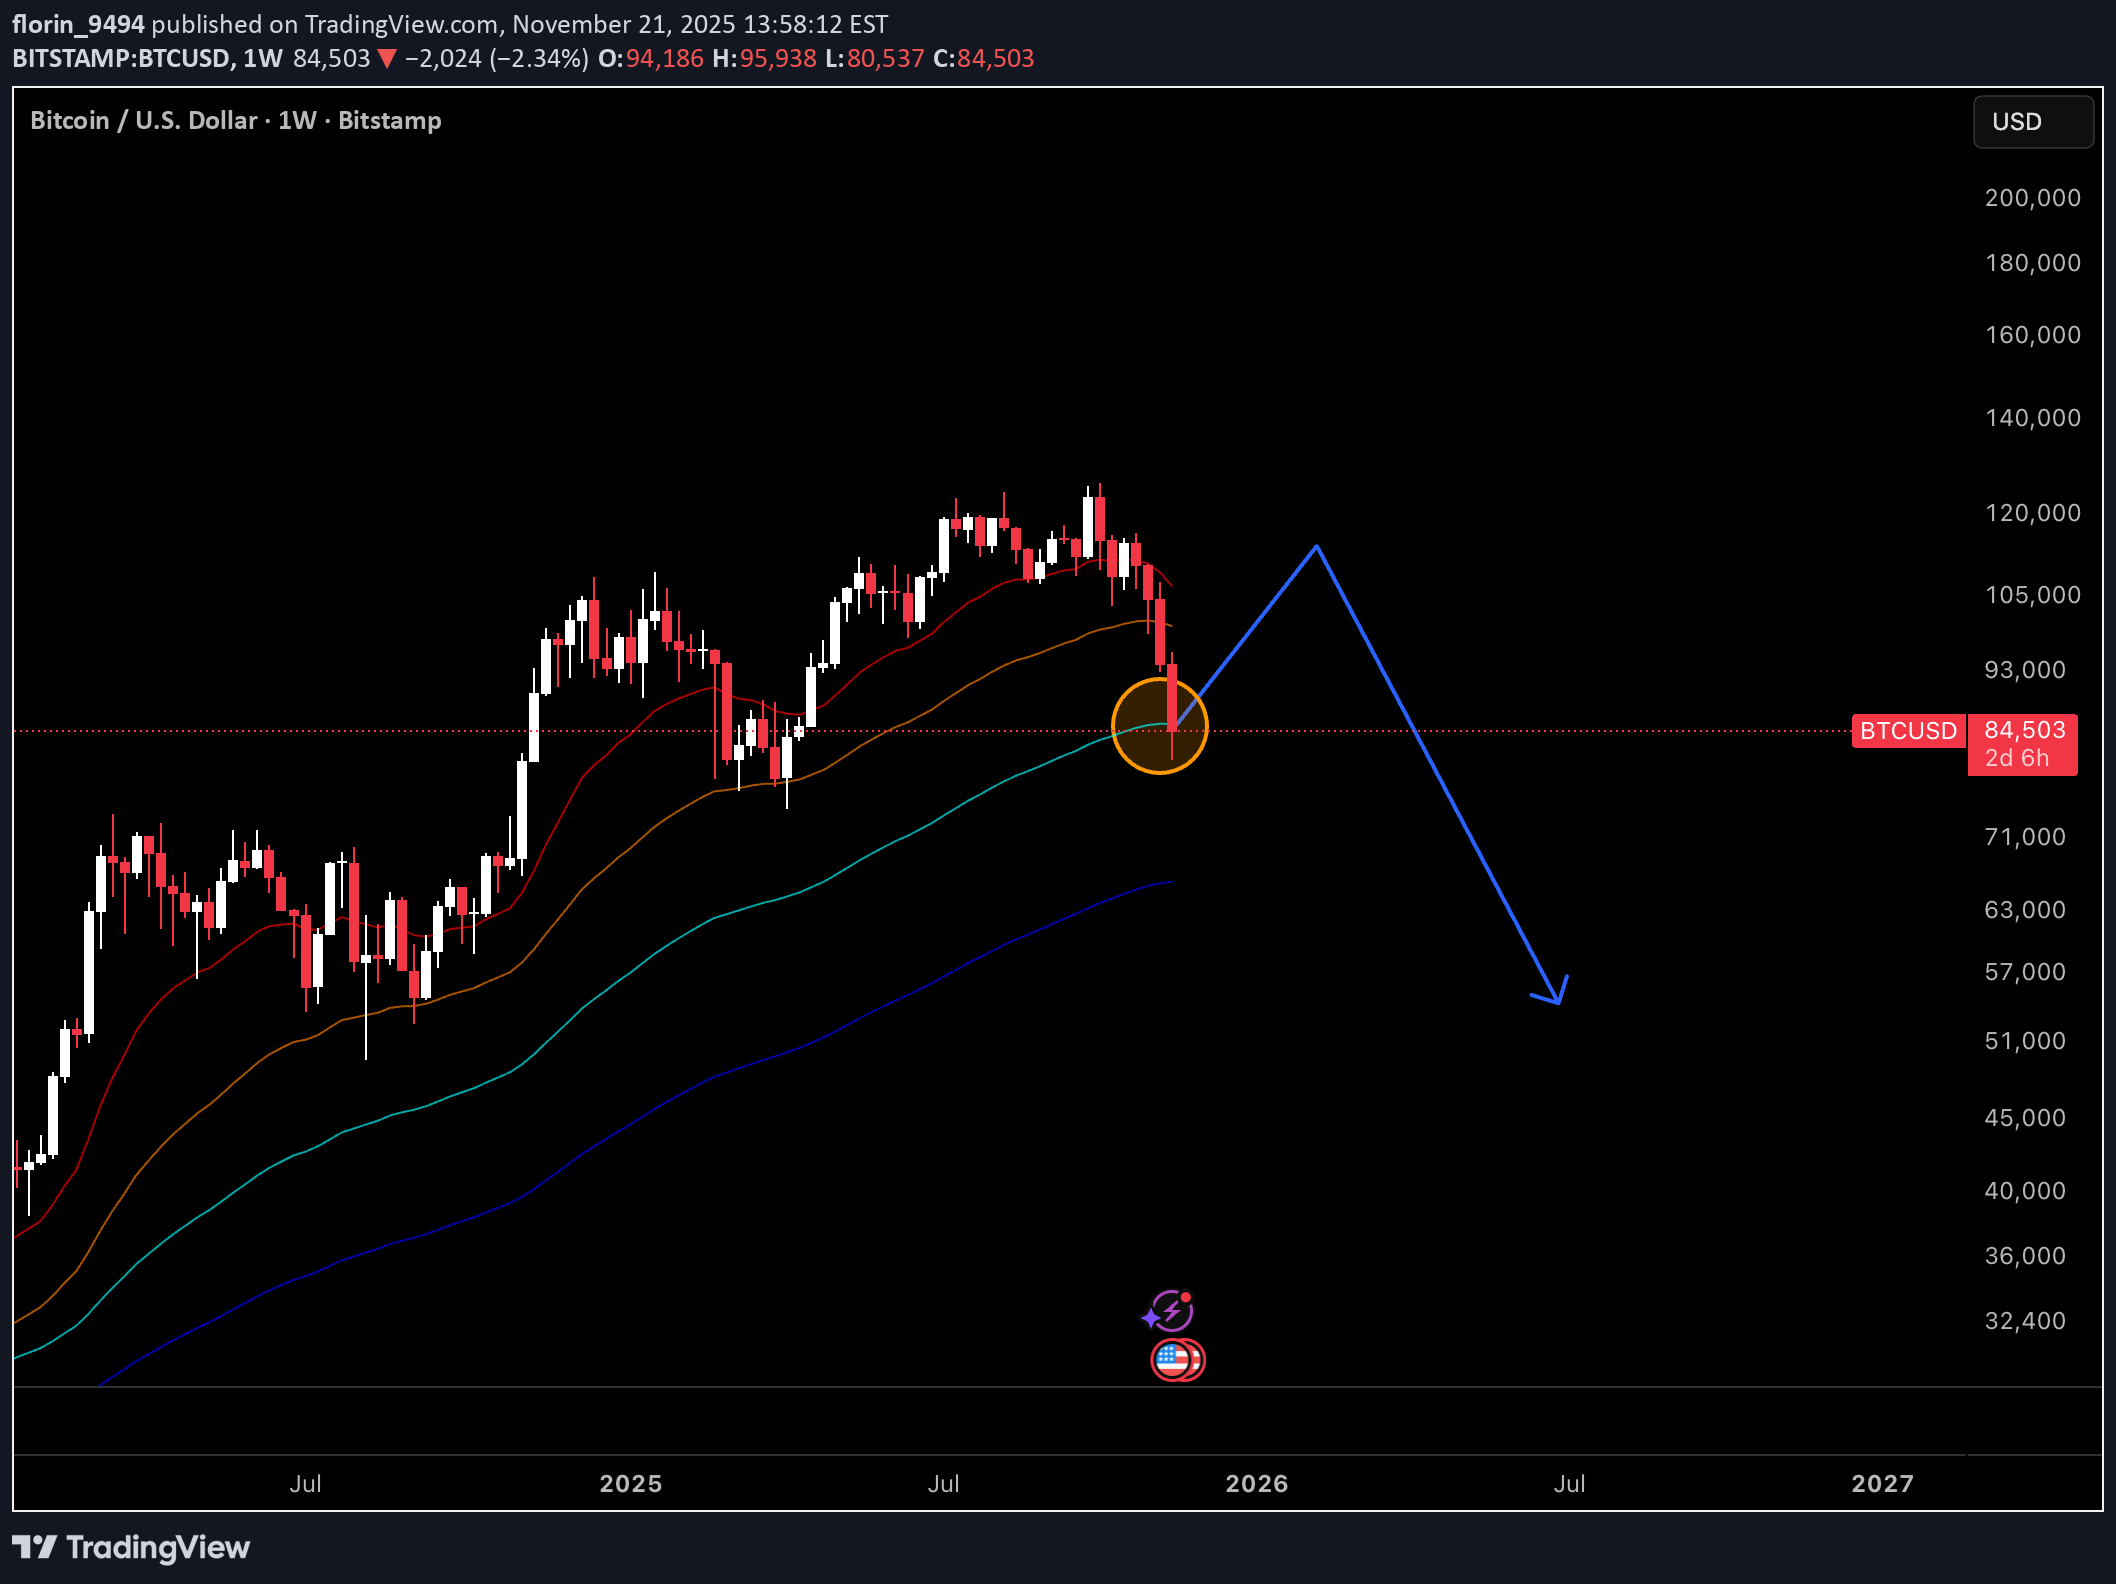
This chart analyzes the historical behavior of Bitcoin whenever price revisits the 100-week moving average (MA) during bull market phases. Historically, each tag of the 100-week MA after a strong run is followed by a relief rally—typically resulting in a lower high of about 40% off the MA touch. However, these moves are often not the start of a new uptrend, but rather countertrend bounces that precede major bear market phases. This setup repeats across cycles: after the 100-week MA touch in a bull market, price frequently prints a significant lower high before breaking down further as broader bearish conditions take hold.
راز کفهای تاریخی بیت کوین: استراتژی خرید با اسیلاتور فیشر
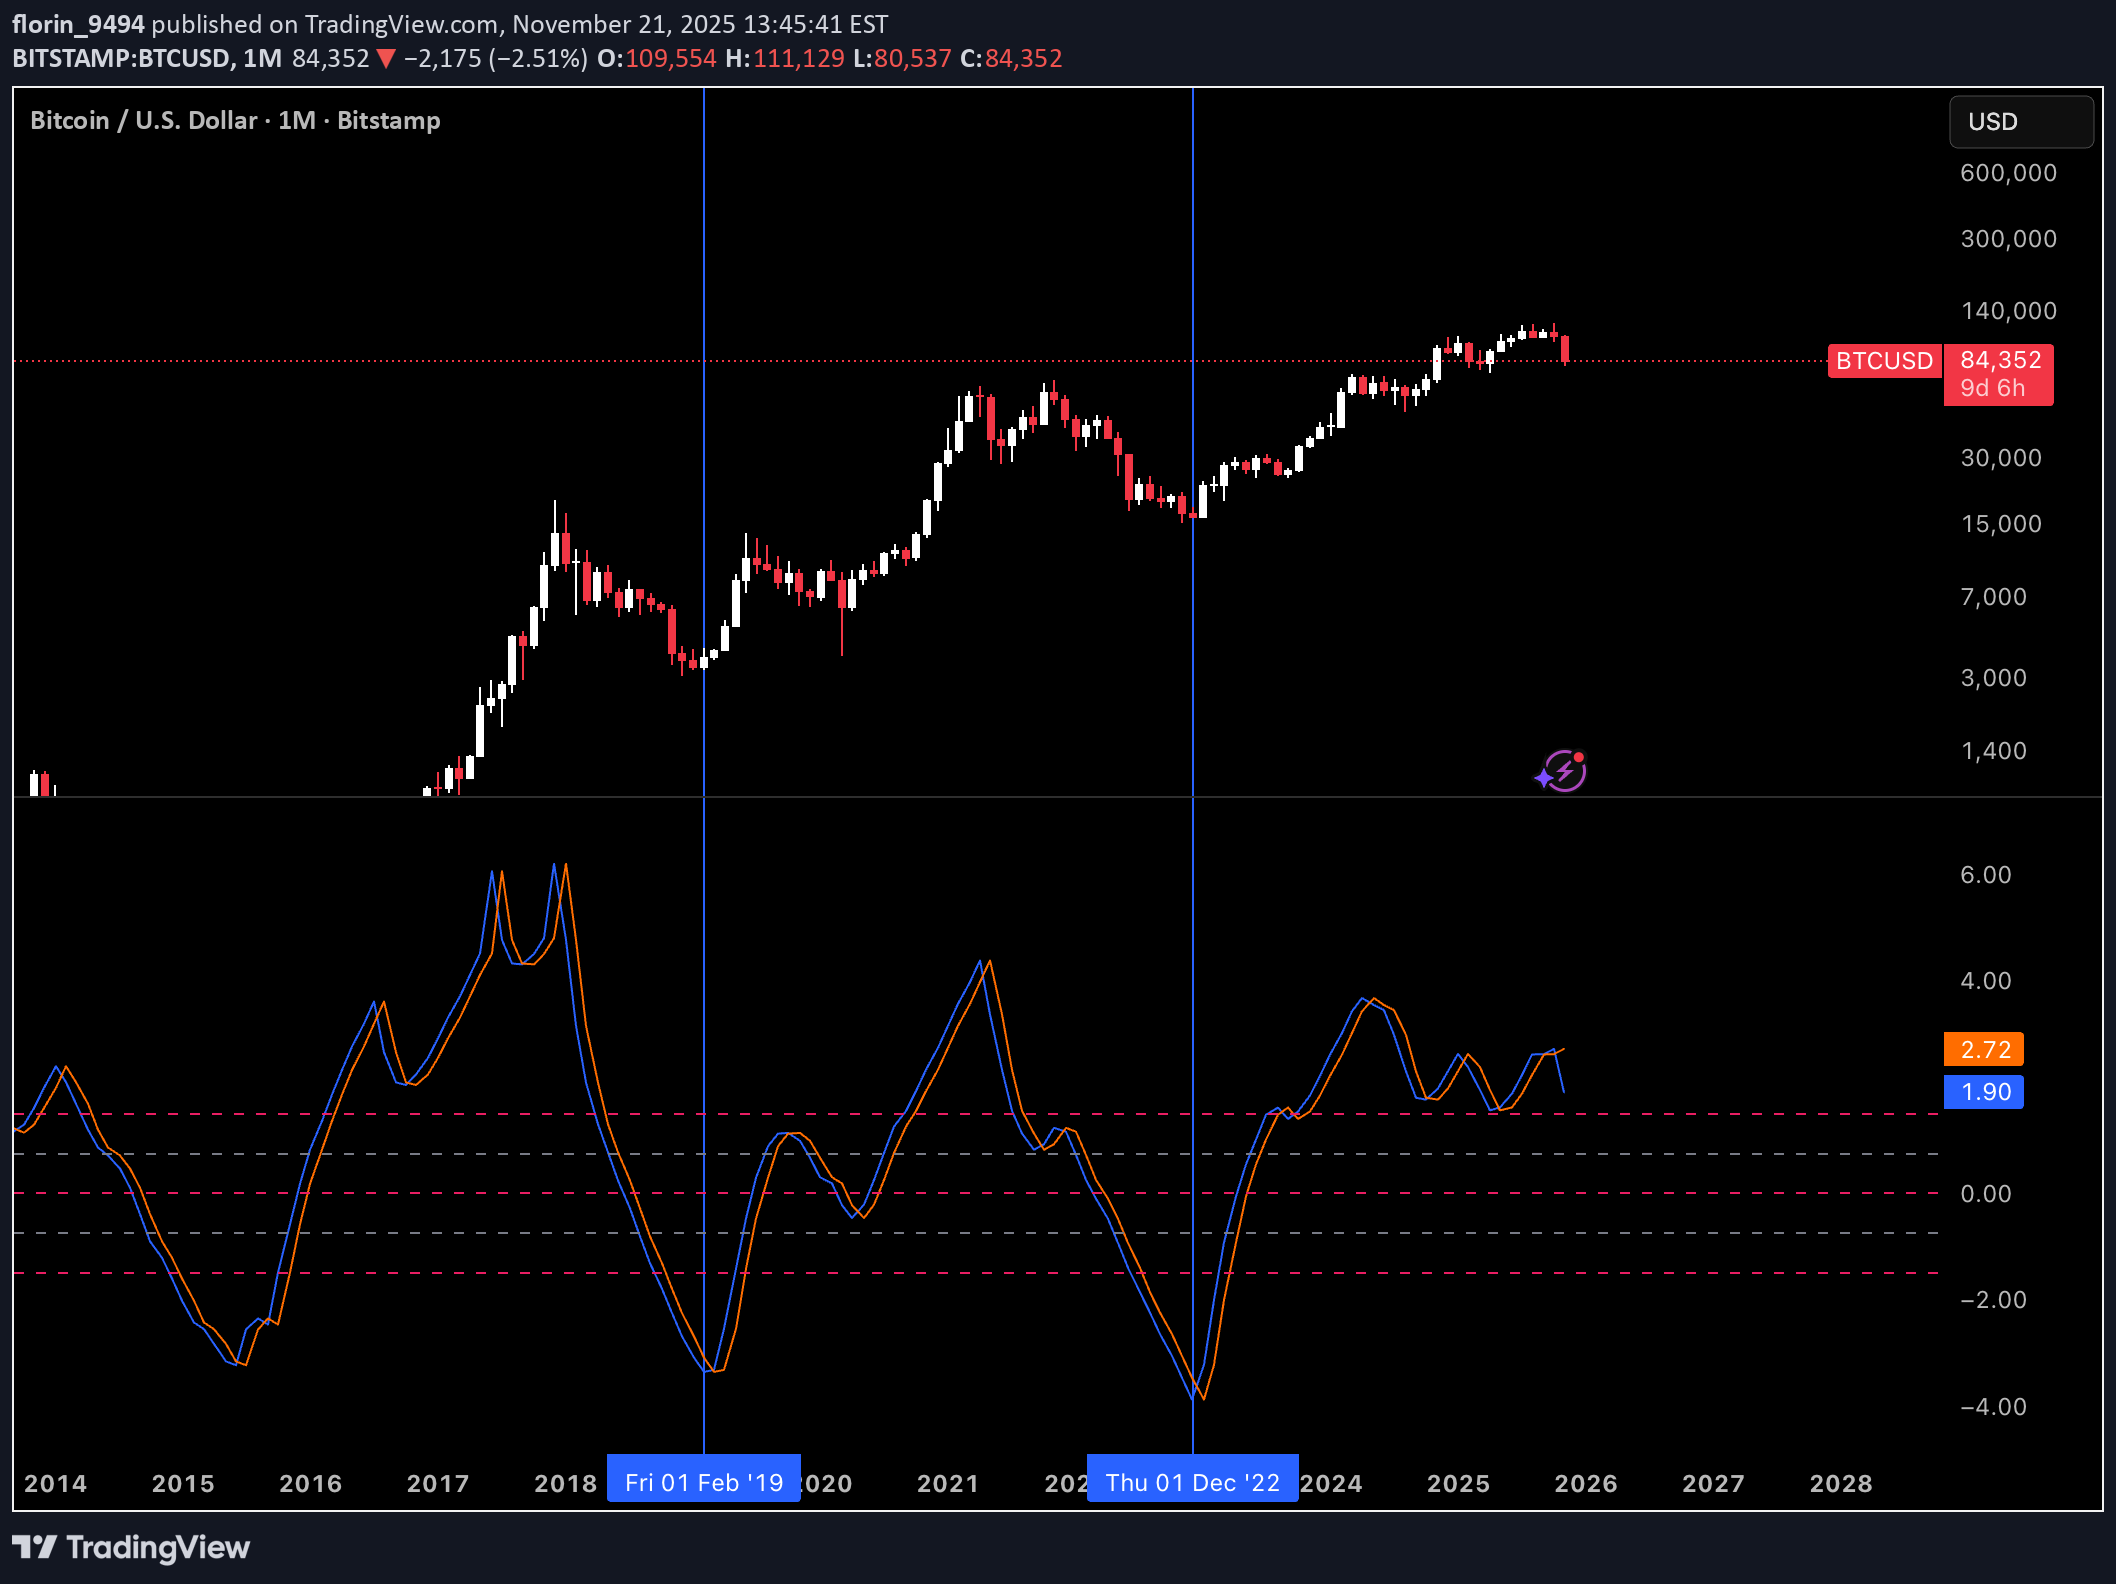
This chart displays the long-term monthly price evolution of Bitcoin alongside the Fisher Transform oscillator, highlighting key turning points and trend reversals from bear market lows. Fisher Transform measures market cycles and helps visualize extreme conditions, with horizontal dashed lines marking typical reference levels near ±2.0. By spotting these extreme negative values, long-term investors can use the Fisher Transform as a guide for systematic accumulation—gradually averaging in when the oscillator bottoms out and signals oversold conditions. This approach aligns with dollar-cost averaging and can help build a position ahead of subsequent bull runs, without relying on perfect market timing.
Disclaimer
Any content and materials included in Sahmeto's website and official communication channels are a compilation of personal opinions and analyses and are not binding. They do not constitute any recommendation for buying, selling, entering or exiting the stock market and cryptocurrency market. Also, all news and analyses included in the website and channels are merely republished information from official and unofficial domestic and foreign sources, and it is obvious that users of the said content are responsible for following up and ensuring the authenticity and accuracy of the materials. Therefore, while disclaiming responsibility, it is declared that the responsibility for any decision-making, action, and potential profit and loss in the capital market and cryptocurrency market lies with the trader.