
DOT
Polkadot
| تریدر | نوع سیگنال | حد سود/ضرر | زمان انتشار | مشاهده پیام |
|---|---|---|---|---|
 AAK_Rank: 303 | خرید | حد سود: تعیین نشده حد ضرر: تعیین نشده | 12/19/2025 | |
 Sohaib_zafar007Rank: 2898 | خرید | حد سود: تعیین نشده حد ضرر: تعیین نشده | 12/18/2025 | |
 SaykoCryptoRank: 30928 | خرید | حد سود: تعیین نشده حد ضرر: تعیین نشده | 12/27/2025 | |
 SwallowAcademyRank: 30658 | خرید | حد سود: تعیین نشده حد ضرر: تعیین نشده | 12/22/2025 | |
خرید | حد سود: تعیین نشده حد ضرر: تعیین نشده | 12/30/2025 |

Price Chart of Polkadot
سود 3 Months :
خلاصه سیگنالهای Polkadot
سیگنالهای Polkadot
Filter
Sort messages by
Trader Type
Time Frame
سطح عرضه/تقاضا در دات کوین (DOT): منتظر چه جهشی باشیم؟

The market needs a retracement to continue further uptrend. The demand zone has been marked for a possible bounce

پولکادات (DOT/USD) در آستانه انفجار؟ تحلیل الگوی انباشت وایکاف در تایم فریمهای بزرگ

DOTUSD -> Potential Wyckoff Accumulation This looks like a Model 1 Wyckoff Accumulation to me. It is evident on the monthly timeframe, but more clear on the weekly. If this is the case, currently we would be in the wyckoff spring phase. What do you think?

Setupsfx_
#DOTUSDT: Three Targets Swing Buy With Final Target At $12

DOTUSDT WEEKLY ANALYSIS BASED ON SMART MONEY CONCEPT🏆📊 🔺Over the last couple of weeks, we’ve noticed a change in how prices are moving and how strong the trend is, which might mean we’re seeing a possible turn for the better from the 2.139 level. Before, when DOTUSDT dropped from its highest point of 11.94, it seemed like the bearish trend was sticking around. But now, we’re hoping to break through that trendline, which could lead to prices going up towards our three set targets. 🔺A good time to jump in would be when the bearish trendline is definitely broken. Since cryptocurrency markets can be so unpredictable, it’s important to be patient. We really recommend using strong risk management techniques, as this kind of asset can be more volatile than regular investments. Also, we’ve found three different price points where you could think about taking profits, and it’s a good idea to match these with what you think and how much risk you’re comfortable with. 🔺We’d love to hear what you think about this analysis and if you have any questions. If you want to learn more, please keep an eye on our updates. Team SetupsFX_👨💻💥
پولکادات (DOT) در کانال نزولی گیر افتاده است: آیا فرصت صعودی از دست رفت؟

DOT continues to respect a well-defined descending channel on the 4H timeframe. Price recently pushed into the upper boundary but failed to hold above it, resulting in another rejection and continuation within the structure. This behavior confirms that the channel remains valid and that supply is still active at resistance. As long as price trades below the upper trendline, any upside move should be treated as a corrective pullback rather than a trend reversal. For a structural shift to the upside, DOT needs a clean breakout and acceptance above channel resistance, followed by higher lows. Until that happens, the bias remains cautious, with focus on reactions at key levels rather than predicting breakouts.
DOT: locally long idea

The dot looks long, both locally and structurally. We need to eliminate the accumulated long-term liquidity, and then we can take off. That's the idea! It's not a setup. If we create this model, we're in. If we fail, we'll just skip it! DOTUSDT.PTAKE

CryptoAnalystSignal
#DOT/USDT Ready to go higher
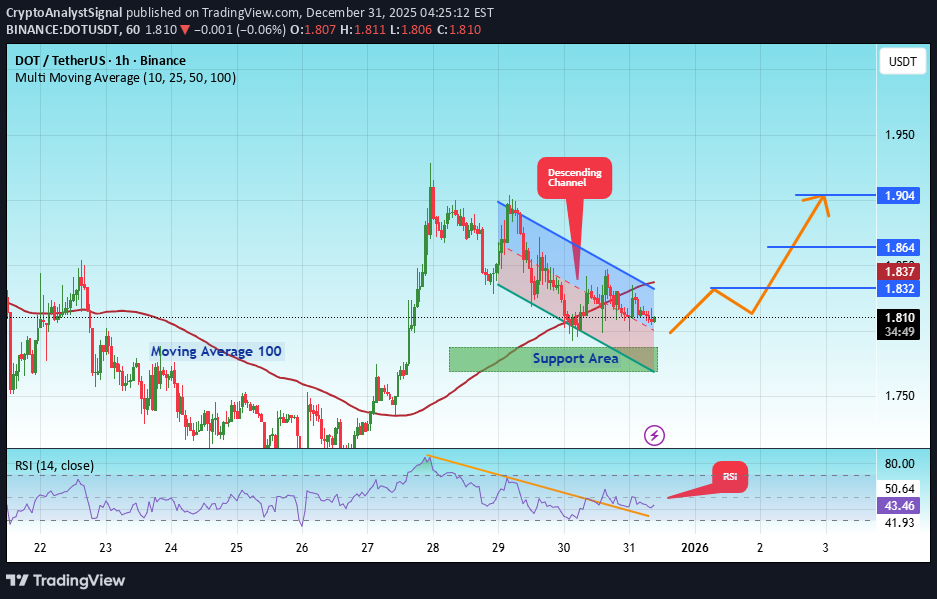
#DOT The price is moving in a descending channel on the 1-hour timeframe. It has reached the lower boundary and is heading towards breaking above it, with a retest of the upper boundary expected. We have a downtrend on the RSI indicator, which has reached near the lower boundary, and an upward rebound is expected. There is a key support zone in green at 1.77. The price has bounced from this zone multiple times and is expected to bounce again. We have a trend towards stability above the 100-period moving average, as we are moving close to it, which supports the upward movement. Entry price: 1.80 First target: 1.83 Second target: 1.86 Third target: 1.90 Stop loss: Below the support zone in green. Don't forget a simple thing: capital management. For inquiries, please leave a comment. Thank you.#DOT First target: 1.83 Reached Second target: 1.86 Reached#DOT First target: 1.83 Reached Second target: 1.86 Reached Third target: 1.90 Reached
Wedge Breakout, Bull Flag, & All Time Low

1D Chart Technical Analysis. An inside bar bull flag pattern in a parallel channel is forming after a breakout of descending wedge pattern highlighted in the bluish green triangle. Immediate support is at the bottom of the bull flag parallel channel. Next, and stronger support is at the white descending trendline that has had 3 hits over a much longer timeframe: (1st) First starting at the pivot low of $4.224 on December 30, 2022, connecting to (2nd) Second pivot low of $3.566 on October 19, 2023, and finally connecting to (3rd) Third and most recent low (ATL) of $1.654 on last Friday, December 26. Price should make a move up through the top of the parallel channel to test the recent resistance zone highlighted in the purple box. If price breaks through the purple resistance zone between $2.35 - $2.54, then look for a test of next resistance level of $3.377 marked with the red line. Overall, this is a very decent bullish setup that is bouncing up from an all time low.
WEDGE BREAKOUT, BULL FLAG, ALL TIME LOW

1D Chart Technical Analysis. An inside bar bull flag pattern in a parallel channel is forming after a breakout of descending wedge pattern highlighted in the bluish green triangle. Immediate support is at the bottom of the bull flag parallel channel. Next, and more strong support is at the white descending trendline that has had 3 hits over a much longer timeframe: (1st) First starting at the pivot low of $4.224 on December 30, 2022, connecting to (2nd) Second pivot low of $3.566 on October 19, 2023, and finally connecting to (3rd) third and most recent low (ATL) of $1.654 on last Friday, December 26. Price should make a move up to test the recent resistance zone highlighted in the purple box. If price breaks through the purple resistance zone between $2.35 - $2.54, then look for a test of next resistance level of $3.377 marked with the red line. Overall, this is a very decent bullish setup that is bouncing up from an all time low.

citexco_trade
DOT.USDT

We have a seven-wave structure that is diametric and is completing. The completion of this wave could give a good temporary move.
پولکادات (DOT) در آستانه تصمیمگیری بزرگ: آیا کانال نزولی شکسته میشود؟

DOT has been respecting a clean descending channel, with price consistently reacting at both boundaries. The recent bounce from the lower trendline confirms that demand is still present at this level, making this zone technically significant. Price is now approaching the upper boundary of the channel, which has acted as dynamic resistance throughout the downtrend. A confirmed breakout and acceptance above this trendline would invalidate the bearish channel and open the door for a broader trend reversal. Until a breakout occurs, this remains a corrective structure. The reaction here will determine whether DOT transitions into a recovery phase or continues consolidating within the channel.
Disclaimer
Any content and materials included in Sahmeto's website and official communication channels are a compilation of personal opinions and analyses and are not binding. They do not constitute any recommendation for buying, selling, entering or exiting the stock market and cryptocurrency market. Also, all news and analyses included in the website and channels are merely republished information from official and unofficial domestic and foreign sources, and it is obvious that users of the said content are responsible for following up and ensuring the authenticity and accuracy of the materials. Therefore, while disclaiming responsibility, it is declared that the responsibility for any decision-making, action, and potential profit and loss in the capital market and cryptocurrency market lies with the trader.