
DEGEN
Degen
| تریدر | نوع سیگنال | حد سود/ضرر | زمان انتشار | مشاهده پیام |
|---|---|---|---|---|
No results found. | ||||
Price Chart of Degen
سود 3 Months :
سیگنالهای Degen
Filter
Sort messages by
Trader Type
Time Frame

DEGEN short trade idea

DEGEN has recently broken its ascending trendline on the 1H timeframe, signaling a potential shift in short term market structure. Price is currently trading inside a higher timeframe bearish order block on the 4H chart. This area has previously acted as a strong reaction zone and remains an important level to monitor. After the trendline break, price is consolidating and I am now waiting for a retest of the broken structure to assess the next move. Key observations: Higher timeframe bias remains bearish Trendline on the 1H has been broken Lower timeframe price action suggests consolidation after the break A 4H fair value gap remains below as a potential draw on liquidity At this stage, no trade has been taken. I am waiting for the retest to enter this trade. No hit, no trade! MrCClosing this limit order. Didnt hit my order

without_worries
Coinbase token DEGEN: Bull Flag signals potential 340% rally
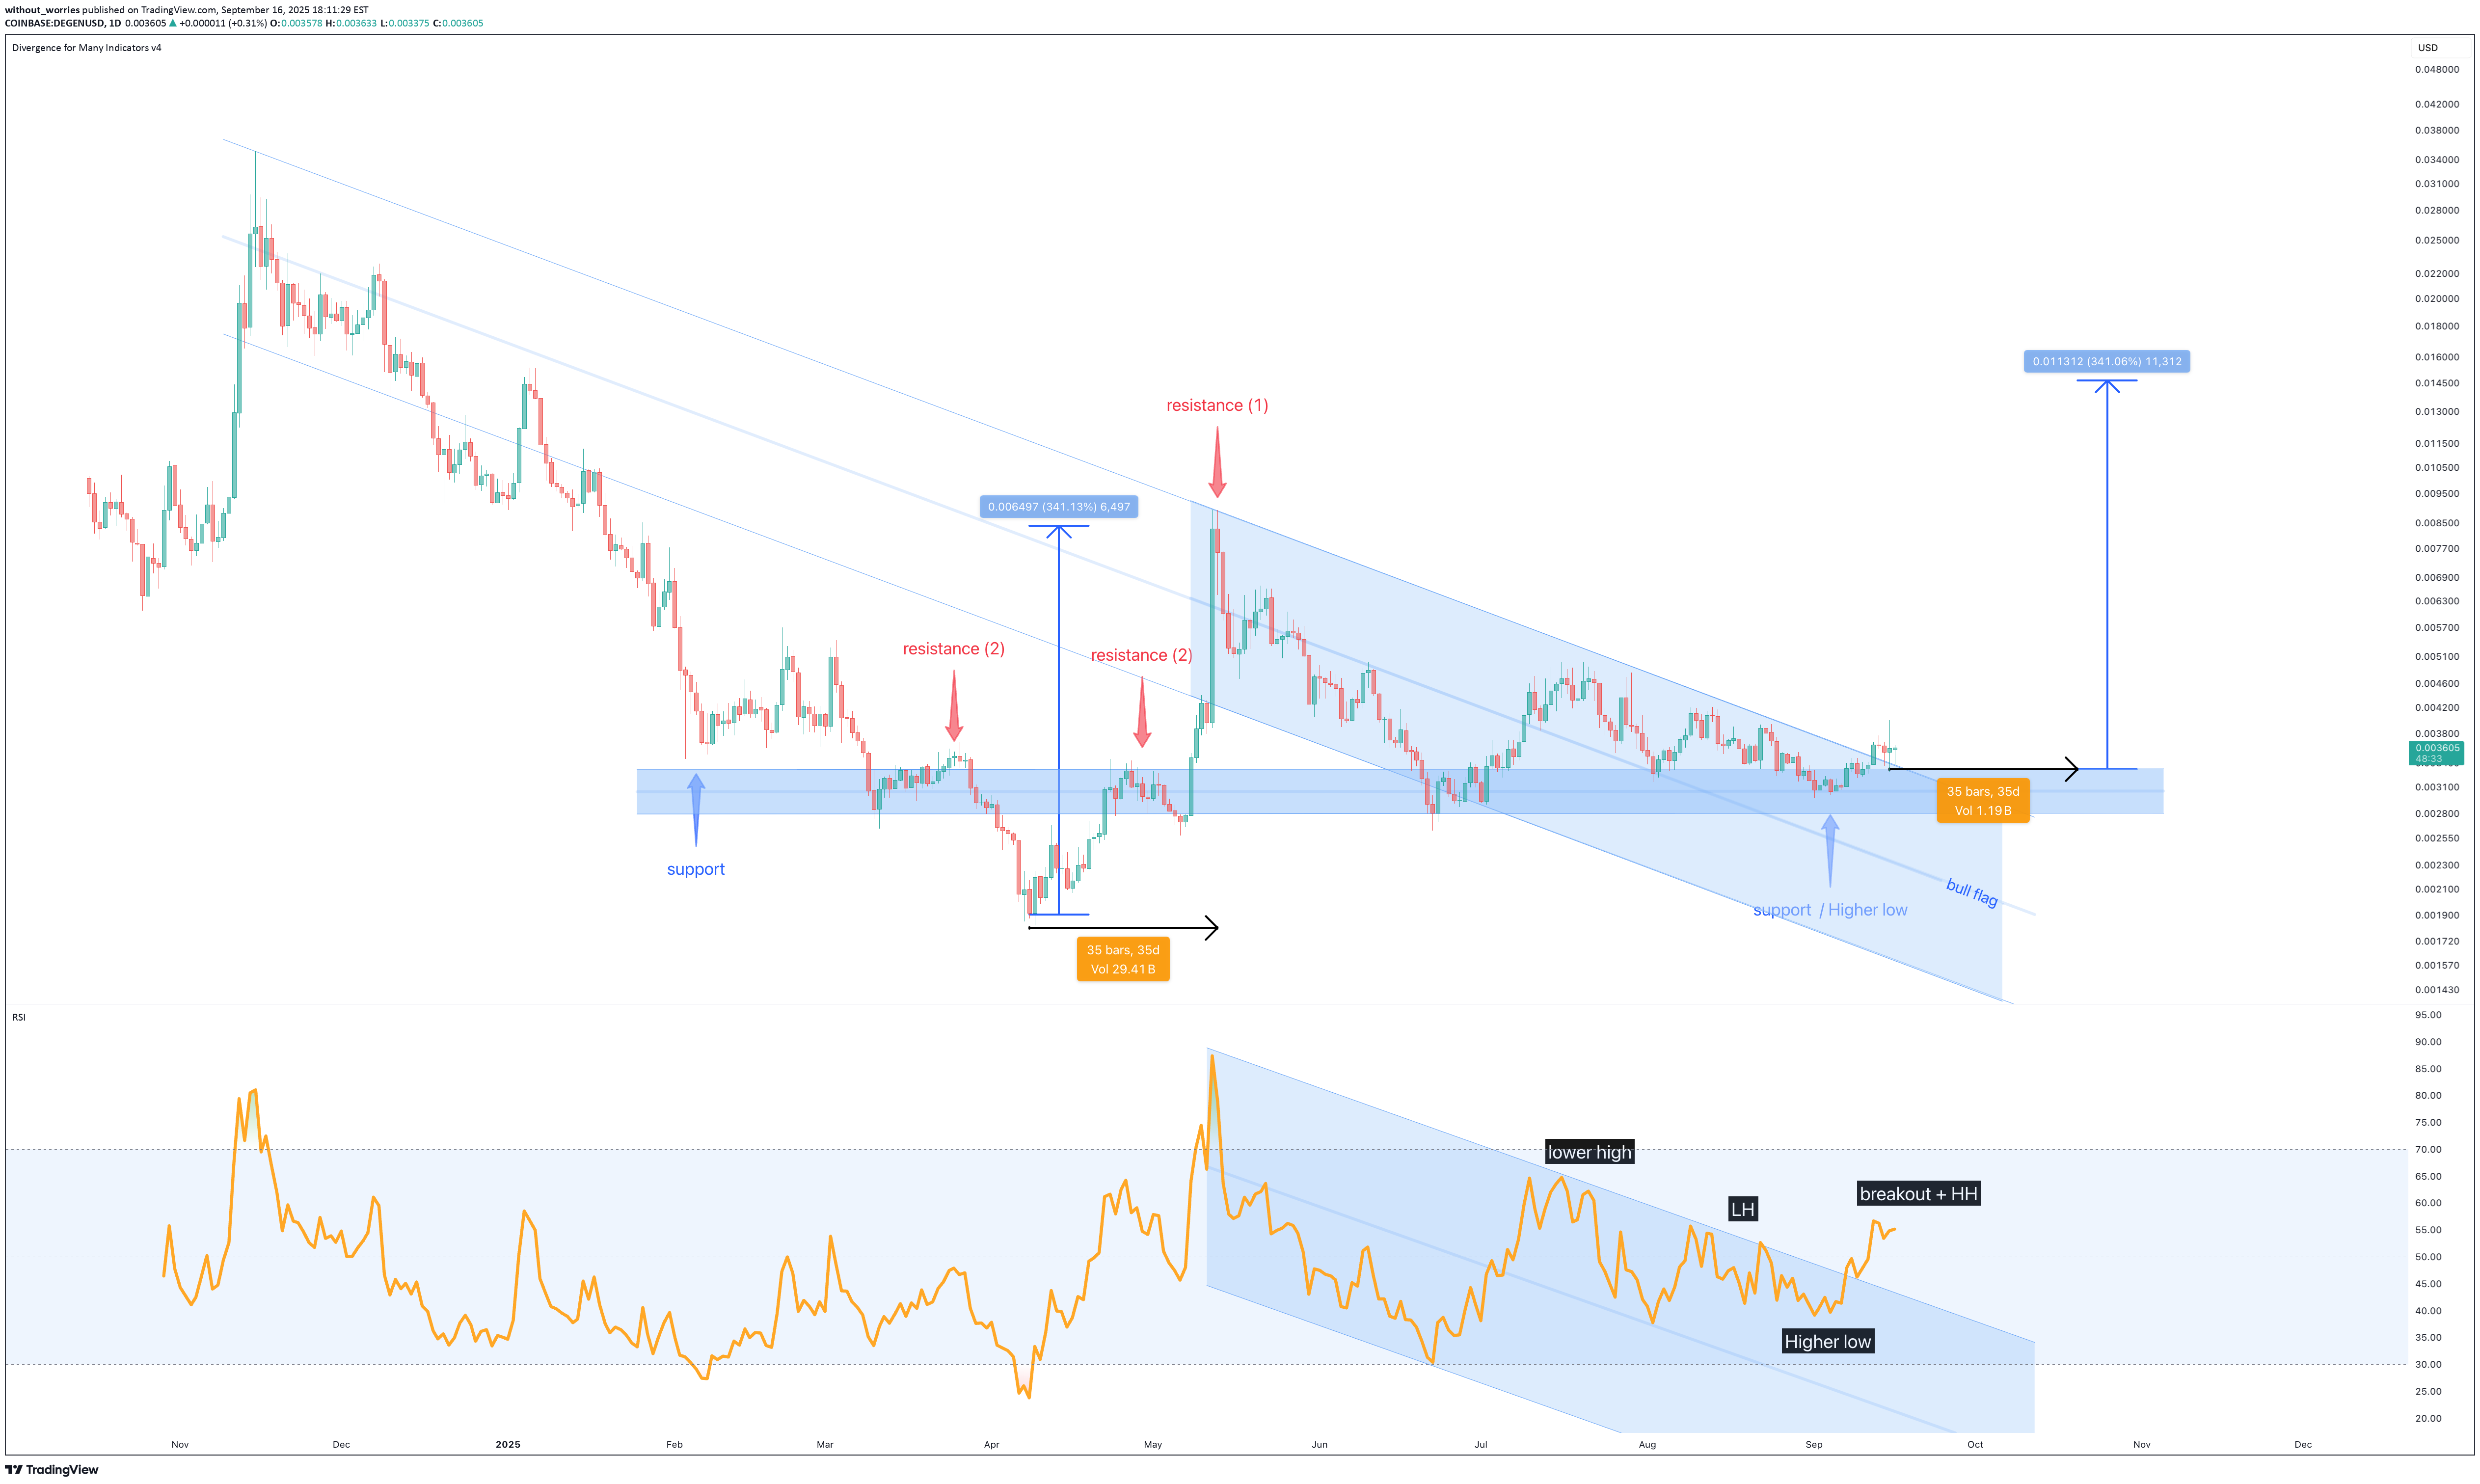
After a significant 70% correction from its highs in May, DEGEN appears to be setting the stage for a strong bullish reversal. The above chart, prepared from observations on weekly and daily timeframes, indicates the correction has now concluded. Support and Resistance The former resistance level from March and April (2) has now been established as a support zone since early September. This "flip" from resistance to support is a classic technical signal. Trend Reversal A clear trend reversal is visible in both price action and the Relative Strength Index (RSI). Price action has broken out of its short-term downtrend channel, and the RSI has similarly broken above its own downtrend resistance, confirming renewed momentum. Bull Flag pattern A well defined bull flag pattern has formed on the daily chart. This is a continuation pattern that typically follows a strong, impulsive move (the flagpole). The current consolidation is the "flag," and it is expected to lead to another impulsive move equal in size to the first. Price Target and Forecast Flagpole Measurement: The first impulsive wave from its low to the recent high was approximately 340%. A repeat of this impulsive move from the base of the bull flag projects a price target of 1.5 cents. Assuming the next impulsive wave follows a similar duration to the first, we can anticipate this forecast is reached in approximately 35 days. Conclusion The technical setup for DEGEN is highly bullish. The combination of a confirmed support level, a trend reversal in both price and RSI, and the formation of a textbook bull flag pattern provides a high conviction long signal. Is is possible price action continues to correct? Sure. Is it probable? No Ww Disclaimer: This is for educational purposes and should not be considered financial advice. Always do your own research and manage your risk accordingly.Active on publication.

helsenberg

Z3usus
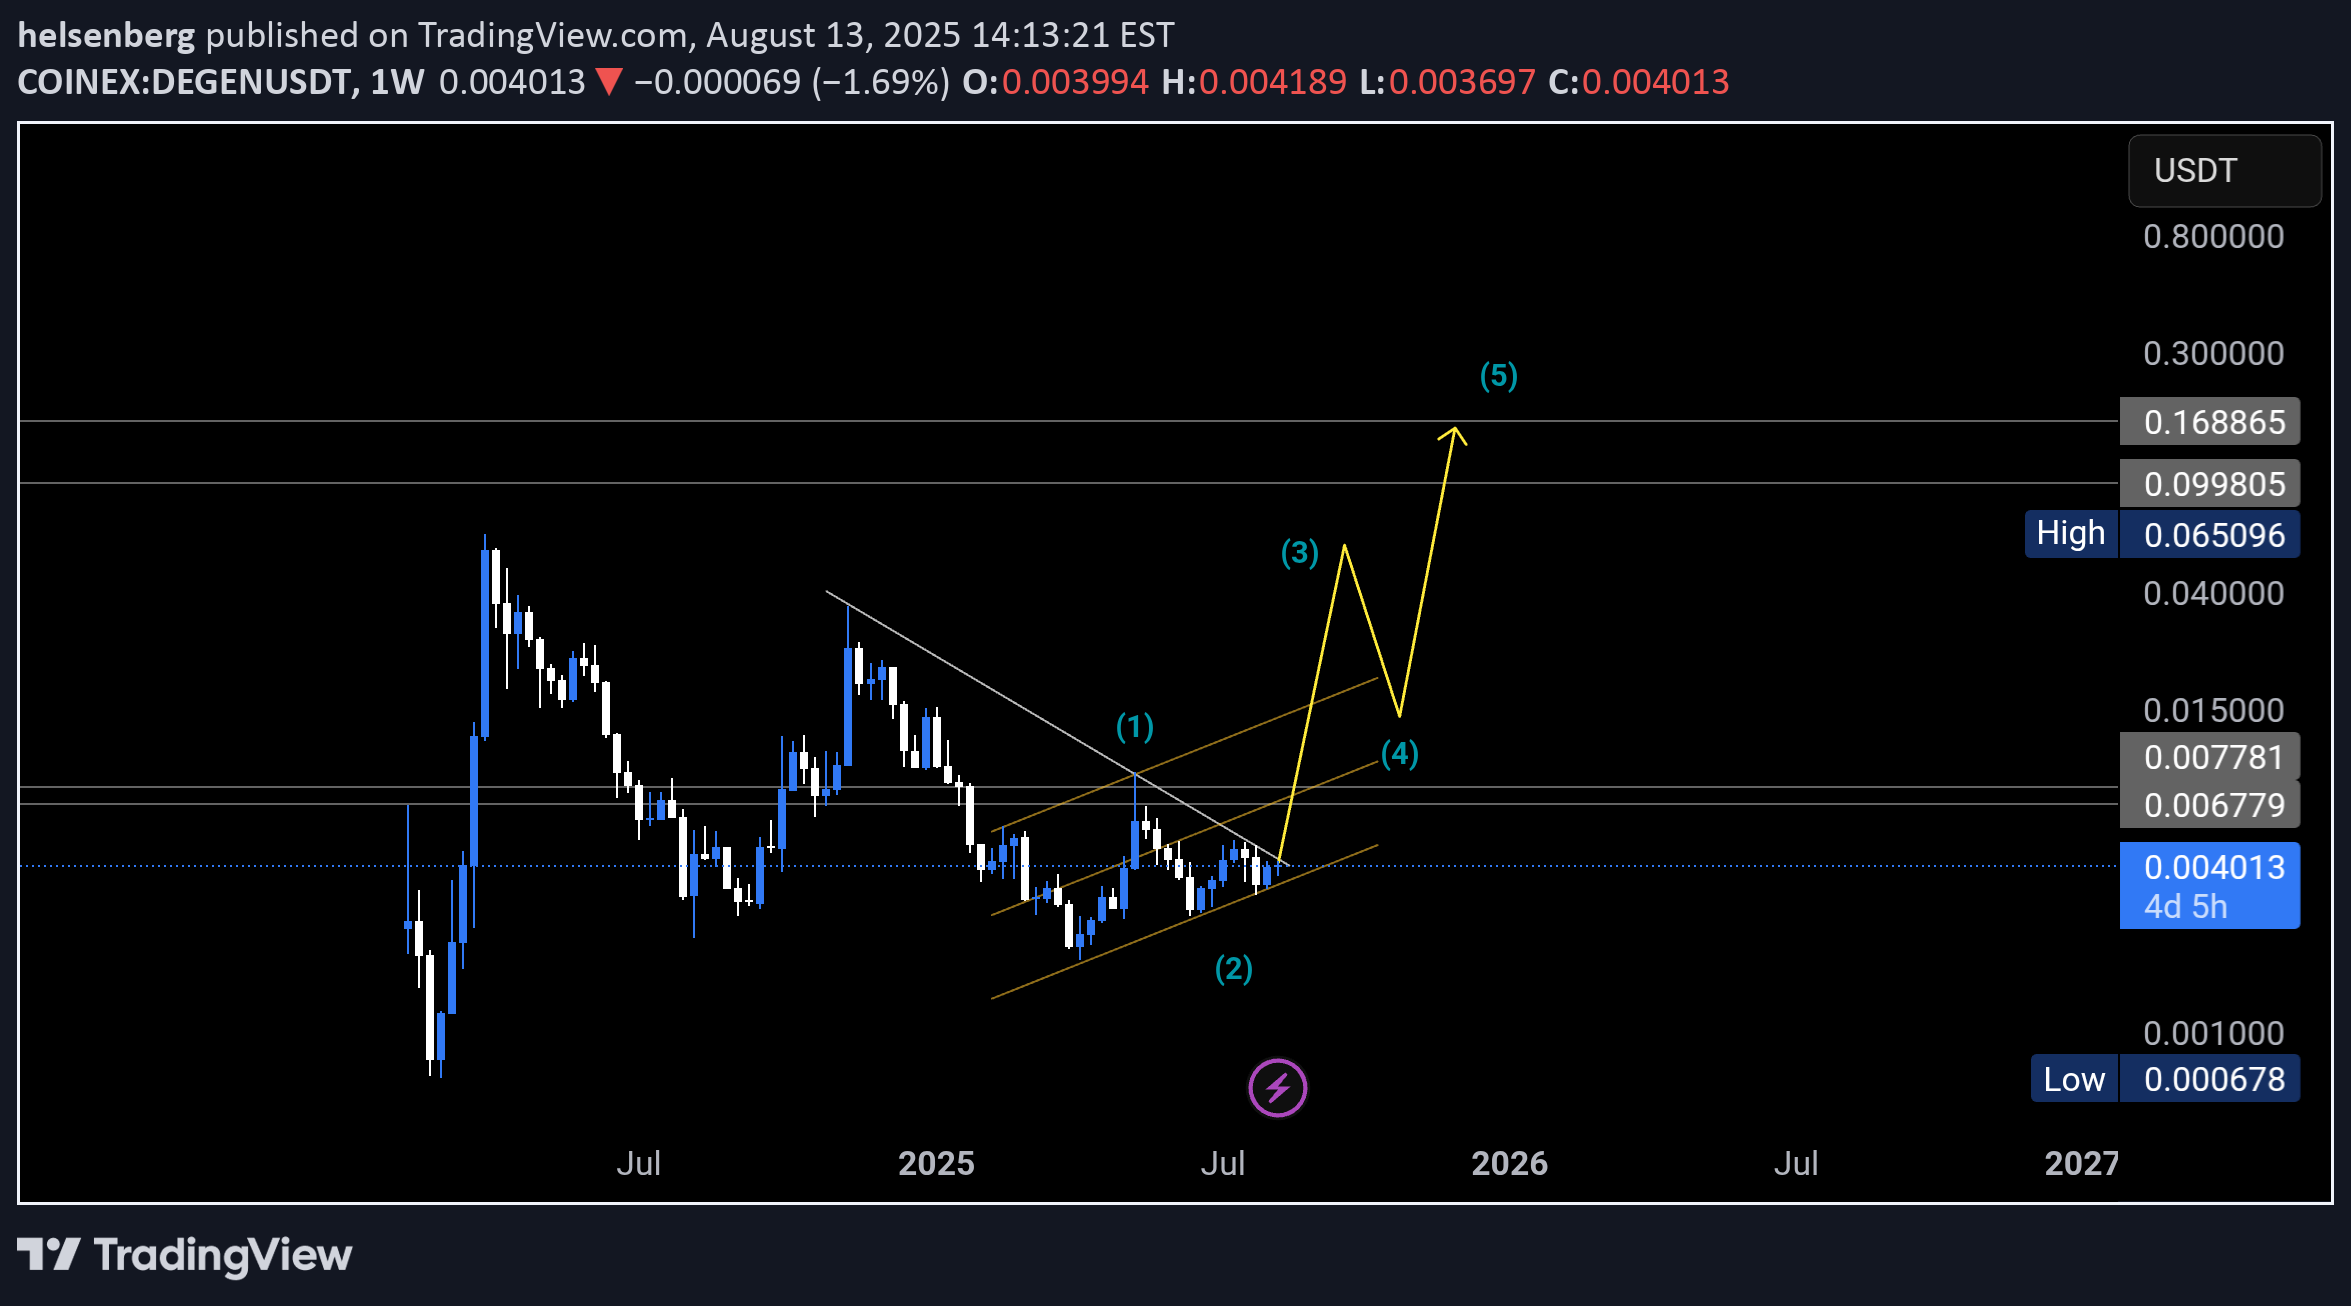
Buy before its too late

We are on ascending chanel We have lower high We have 2D,3D Smi & StochRSI Positive Cross We are below the trend line and are in the fourth collision (70% chance of break) Buy for the channel top (0.014)

Real time moving

I have just seen the real chart moving just focus on the real time moving

Tealstreet
$DEGEN - Long Setup

DEGENUSDT | 6h Price is holding this HTF demand Taking some long here .0038 DCA/Conservative Entry .0036-.0034 Stoploss: .0030 TPs: .0043-.0045 .0050-.0053 .0054-.0058

bgoode71
6hr CPR Strat

6HR CPR strat and hoe to move stop losses up with them.

ADmytrenko2
Potential 9% move in DEGENUSD

As can be seen with the Dual TF strategy, there is a potential for a 9% move in DEGEN for the following reasons: 1. Long term (5HR) and short term (1HR) charts are showing that DEGEN is overextended to the downside (yellow dots using custom Data Distribution indicator), which means that there is a potential for the price to reverse back up. The fact that there is confluence between the two charts is a good sign. 2. Custom indicator Zero-Lag USI is showing that the background has changed from red to black, meaning that there is a potential change in momentum here and that the price can potentially reverse back up. 3. Long-term chart is showing a reversal candle which is another sign that there is a potential reversal here.
Tealstreet
$DEGEN - Long Trade Idea

DEGENUSDT | 4h Price deviated from its swing point at 0.0038 and has now retested it on the lower timeframes. If this retest holds, we want to see price maintain support at 0.0040 Holding this level opens up a potential liquidity sweep around 0.0050–0.0054 If momentum continues and Bitcoin holds above 104,000, next target is 0.0058–0.0060

The_Alchemist_Trader_
DEGENUSDT Key Support – 255% Move on the Table if Bulls

DEGENUSDT has made a strong impulsive move and is now entering a corrective phase. All eyes are on a critical support zone where the next big reaction could determine the direction of the next 250%+ move.Key Highlights:Support Confluence: Point of Control + Daily Support + 0.618 FibonacciUpside Target: 0.014 weekly resistance = 255% potential upsideBearish Scenario: Breakdown would shift focus to the value area lowFull Analysis:DEGENUSDT recently completed a strong impulse to the upside, signaling renewed interest and momentum in the asset. Following this move, price action is now in a controlled pullback phase — but it’s not random. The chart shows that DEGEN is now approaching a key technical region made up of the Point of Control, daily support, and the 0.618 Fibonacci retracement level. This triple confluence zone is where the market could establish a higher low and gear up for the next breakout.If price shows strength upon retesting this area, the probability of a sharp rally increases significantly. The next major resistance sits at 0.014 — a weekly level that also aligns with previous consolidation zones. If this move plays out, traders could be looking at a 255% upside.However, failure to hold this support would be a clear bearish signal. In that case, the value area low becomes the next probable downside target, and bullish momentum would be temporarily invalidated.
Disclaimer
Any content and materials included in Sahmeto's website and official communication channels are a compilation of personal opinions and analyses and are not binding. They do not constitute any recommendation for buying, selling, entering or exiting the stock market and cryptocurrency market. Also, all news and analyses included in the website and channels are merely republished information from official and unofficial domestic and foreign sources, and it is obvious that users of the said content are responsible for following up and ensuring the authenticity and accuracy of the materials. Therefore, while disclaiming responsibility, it is declared that the responsibility for any decision-making, action, and potential profit and loss in the capital market and cryptocurrency market lies with the trader.