
CTK
Shentu
| تریدر | نوع سیگنال | حد سود/ضرر | زمان انتشار | مشاهده پیام |
|---|---|---|---|---|
No results found. | ||||
Price Chart of Shentu
سود 3 Months :
سیگنالهای Shentu
Filter
Sort messages by
Trader Type
Time Frame

Alpha-GoldFX
رشد انفجاری CTKUSDT در راه است؟ پیشبینی صعود 40 درصدی!
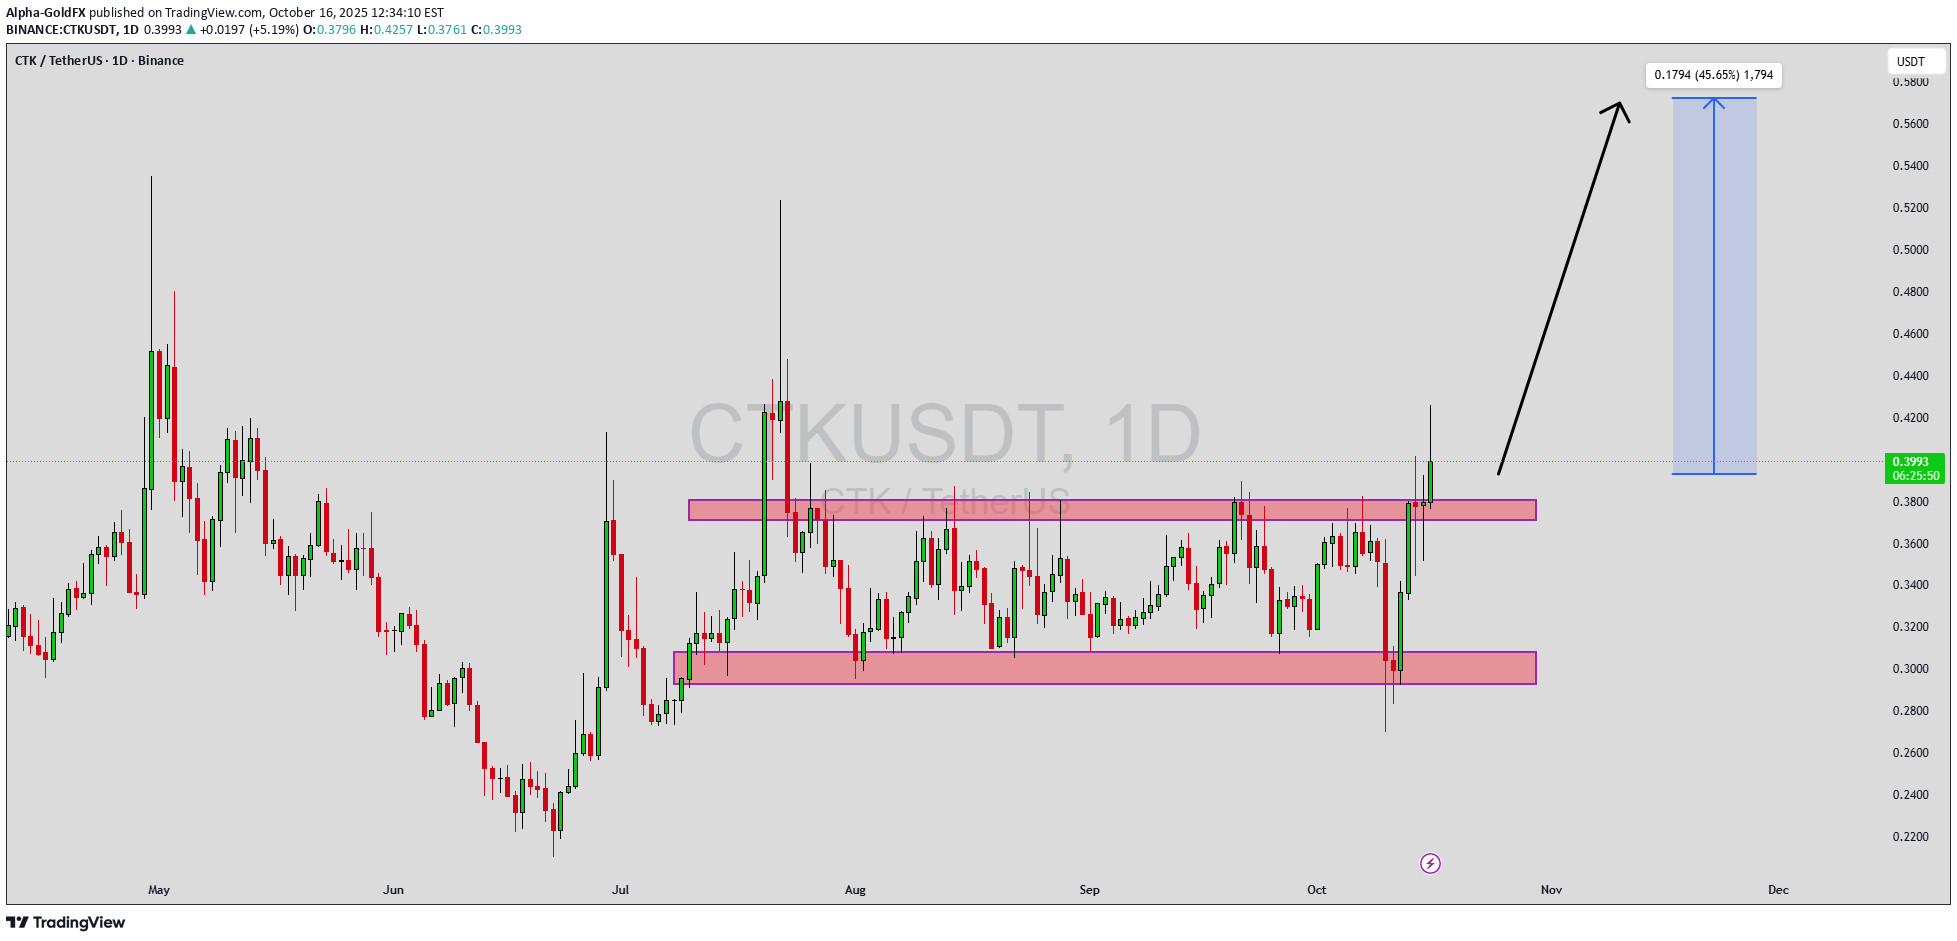
CTKUSDT is currently displaying a bullish momentum pattern, signaling growing strength among buyers and a potential continuation of upward movement. The recent increase in volume confirms that investors are accumulating positions, preparing for a breakout move. With price consolidating above key support levels, the technical outlook suggests that CTK could gain 30% to 40%* in the near term as momentum builds across the broader crypto market. This bullish setup highlights strong participation from market participants, with trading activity steadily increasing over the past sessions. The price structure indicates that CTKUSDT may be transitioning from accumulation to expansion, a phase where upward price acceleration often follows. Traders watching for confirmation signals, such as volume spikes or moving average crossovers, may find this setup particularly appealing as it aligns with positive market sentiment. Investors’ confidence in CTKUSDT continues to grow as the project gains attention for its consistent performance and recovery strength. The current technical formation suggests potential for sustained bullish movement if the price manages to maintain higher lows and close above key resistance zones. This momentum-driven move could open doors for short-term traders and long-term investors alike to capitalize on the ongoing uptrend. ✅ Show your support by hitting the like button and ✅ Leaving a comment below! (What is You opinion about this Coin) Your feedback and engagement keep me inspired to share more insightful market analysis with you!

CryptoWithJames
تحلیل تکنیکال CTK: آماده صعود ۵۵ درصدی با شکست الگوی گوه نزولی!

#CTK UPDATE CTK Technical Setup Pattern: Bullish falling wedge pattern Current Price: $0.401 Target Price: $0.621 Target % Gain: 55.70% C CTK is breaking out of a bullish falling wedge pattern on the 1D timeframe. Current price is $0.401 with a target near $0.621, indicating around 55% potential upside. The breakout shows strong bullish momentum, suggesting potential continuation toward higher levels. Time Frame: 1D Risk Management Tip: Always use proper risk management.

AloneTrader_
تحلیل CTK/USDT: فرصت خرید از کف کانال نزولی با هدف سود عالی!

I found that a falling channel and a rise from the channel bottom can be considered as a good entry from 0.618 of the rise.

berkanUsdt
Piyasa Çalkantısına Rağmen Dimdik Ayakta Kalan Koin ''CTK''
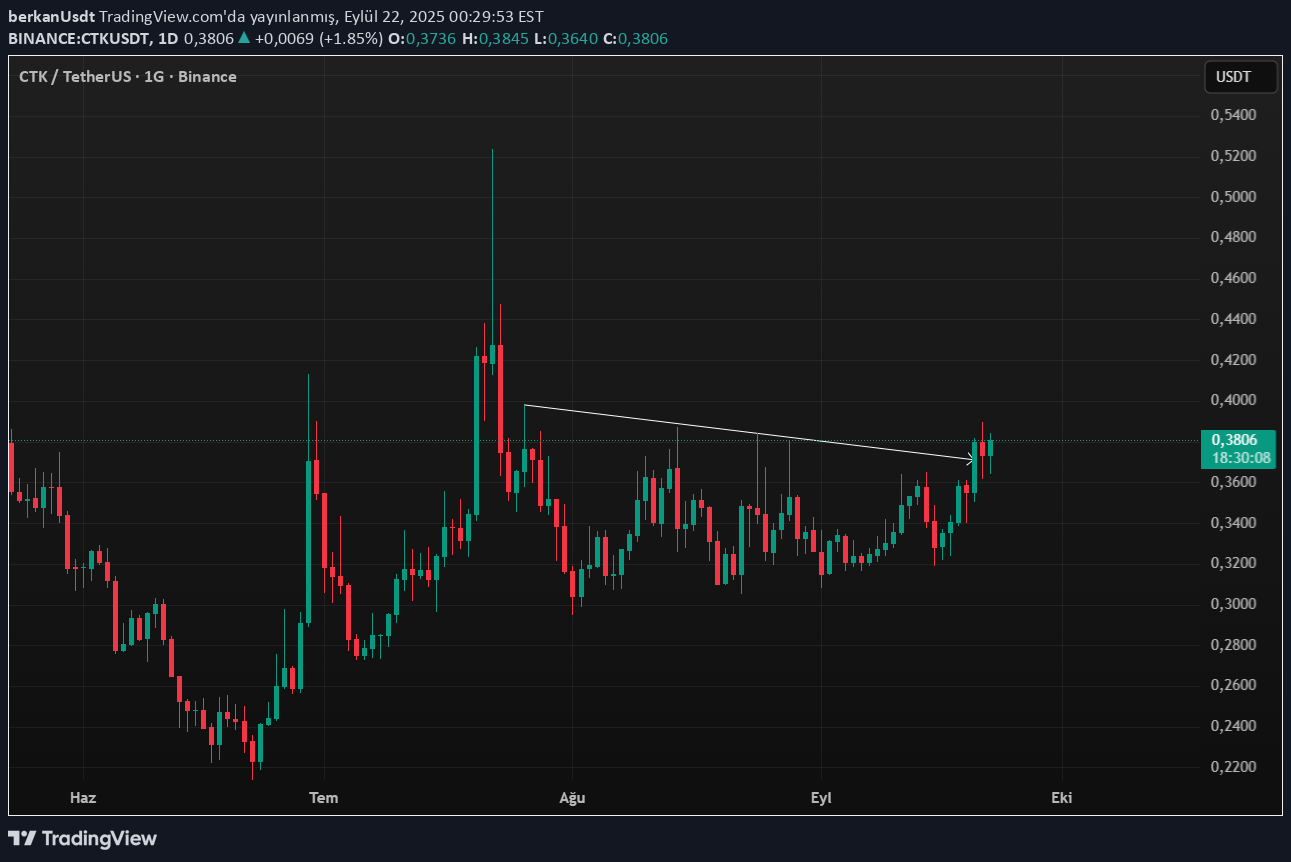
The main major crypto assets (BTC, ETH, SOL) exhibit downward price movements, while the CTK remains relatively strong. When examined on the graph, the narrowing triangular formation was broken upward and then performs the Pullback movement. This technical structure indicates that if the existing trend continues, the price can contain approximately 20 %of potential. However, this mobility may also indicate that the capital rotation of the major assets towards the subcoin segment has begun. If this capital flow gains momentum, we may have entered the period called Altcoin Season (Altcoin Bull) throughout the market. Briefly: Formation: shrinking triangle frustration + pullback Technical Probability: 20 %upward pricing potential Macro comments: Capital flow from major to bottoms → Altcoin season probability It is not an investment advice.

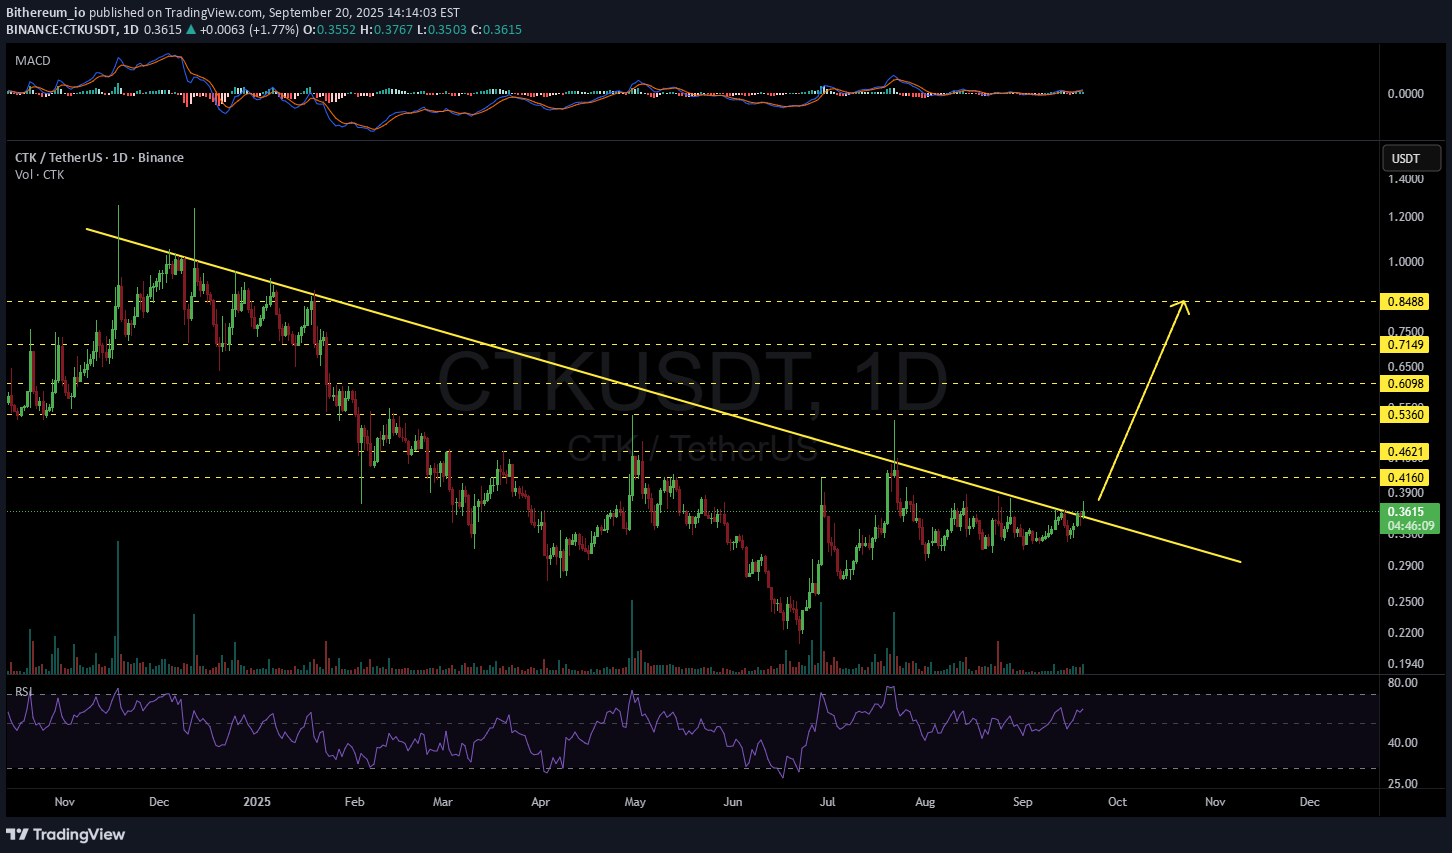
Bithereum_io
CryptoWithJames
CTKUSDT UPDATE
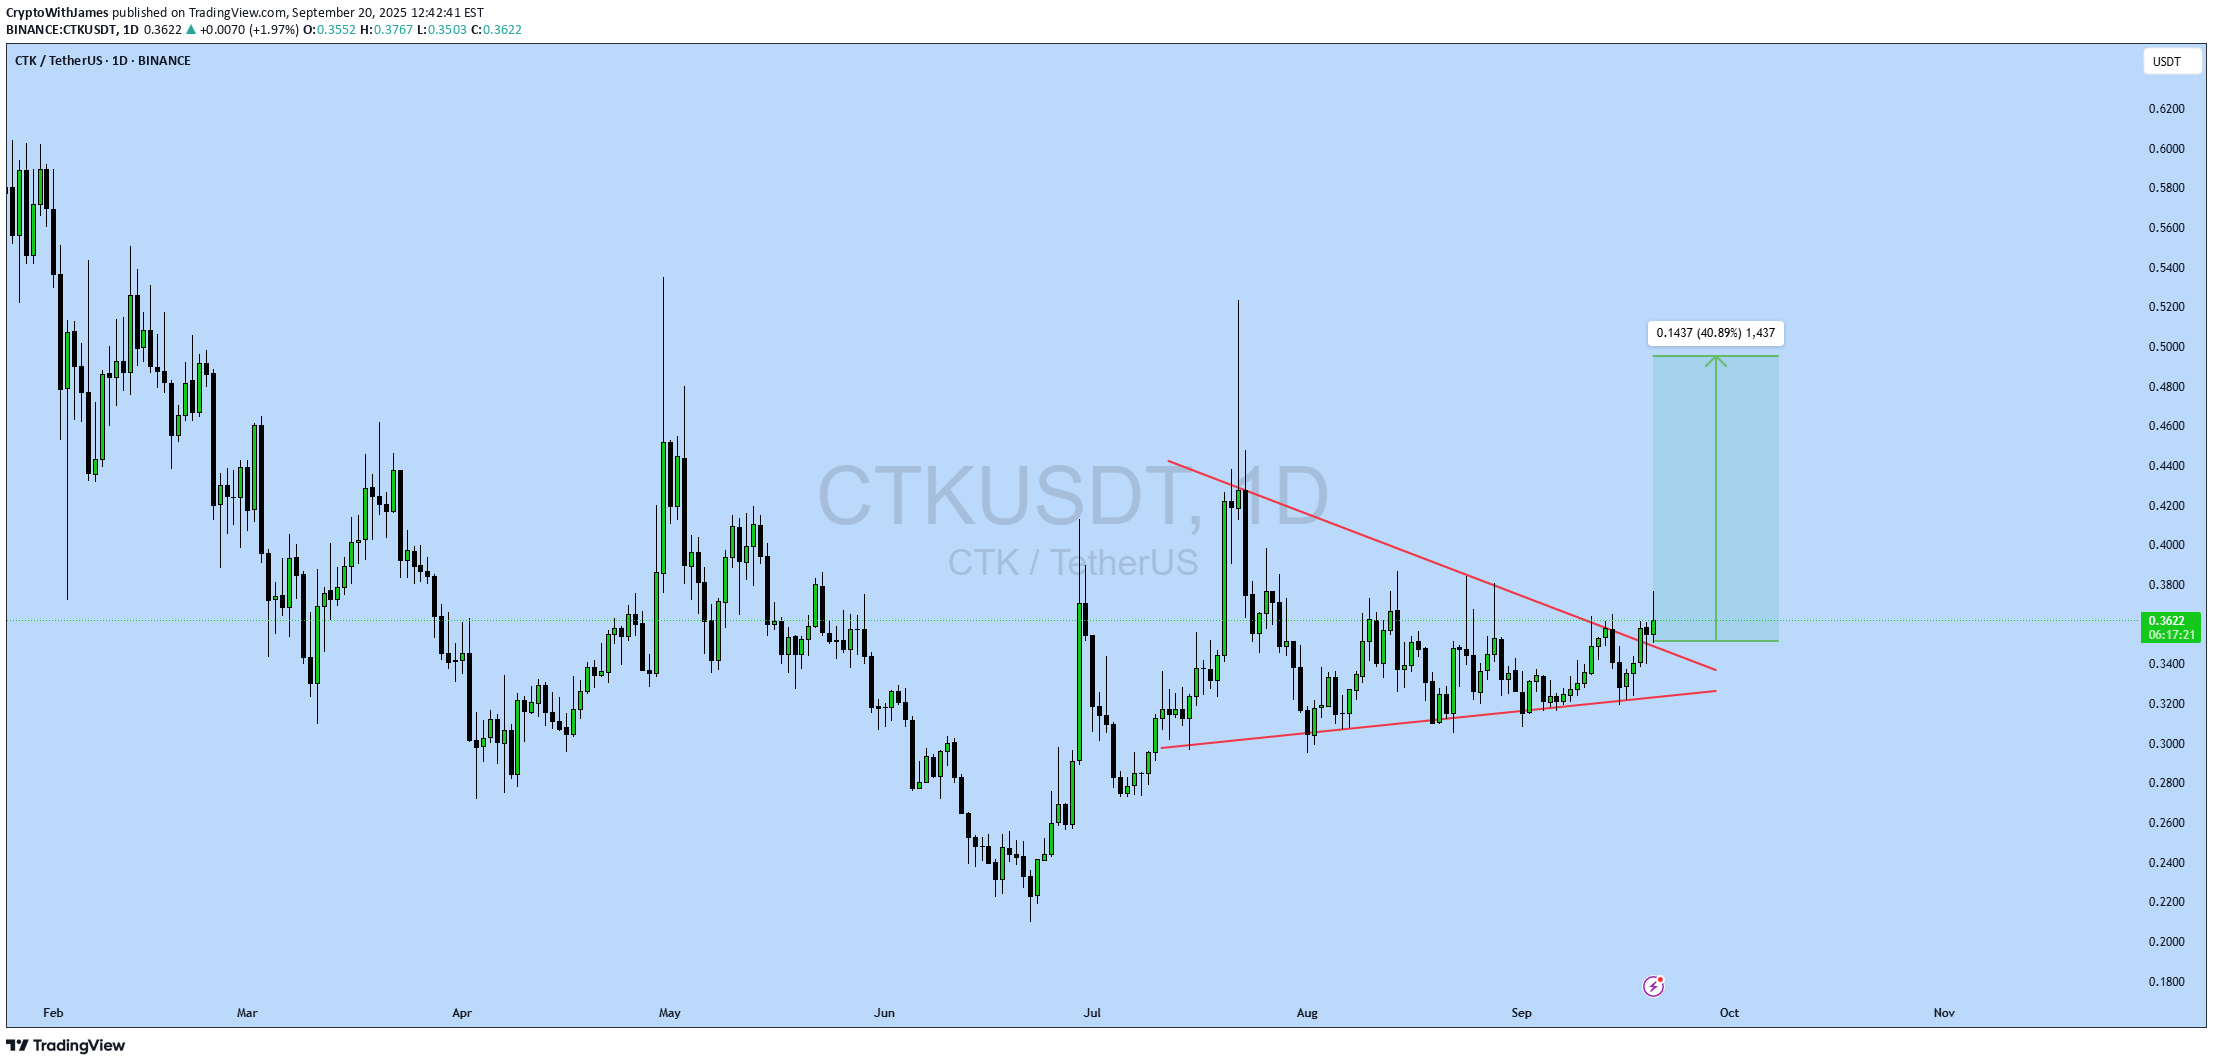
#CTK UPDATE CTK Technical Setup Pattern: Bullish Pennant Pattern Current Price: $0.362 Target Price: $0.505 Target % Gain: 40.89% C CTK is breaking out of a bullish pennant pattern on the 1D timeframe. Current price is $0.362 with a target near $0.505, showing about 41% potential upside. The breakout confirms bullish momentum with structure favoring continuation. Always use proper risk management. Time Frame: 1D Risk Management Tip: Always use proper risk management.
CryptoWithJames
CTKUSDT UPDATE
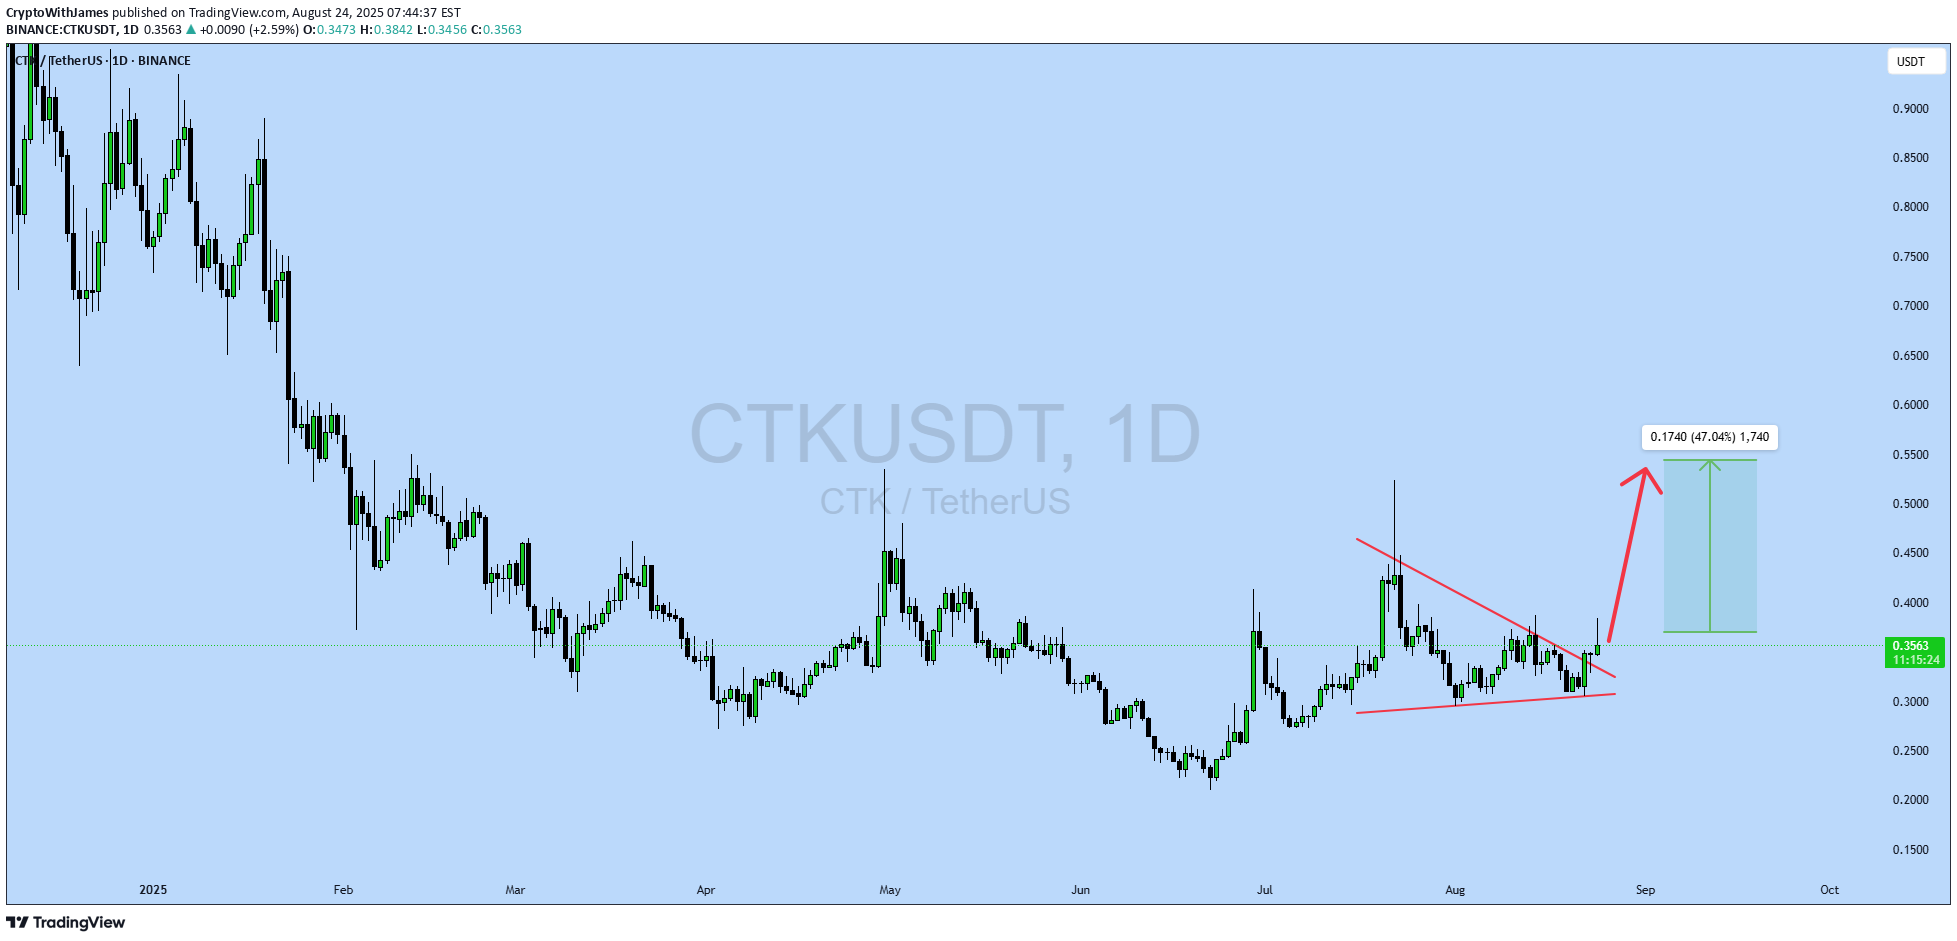
#CTK UPDATE CTK Technical Setup Pattern : Falling Wedge Breakout Current Price: $0.3535 Target Price: $0.52 Target % Gain: 47% Technical Analysis: CTK has broken out of a falling wedge pattern on the 1D chart with bullish confirmation. Price is holding above the breakout trendline, suggesting further upside momentum. Sustaining above $0.34 opens the door for continuation toward \$0.52. Time Frame: 1D Risk Management Tip: Always use proper risk management.

asilturk
CTK Terbiyesizlik Yapabilir
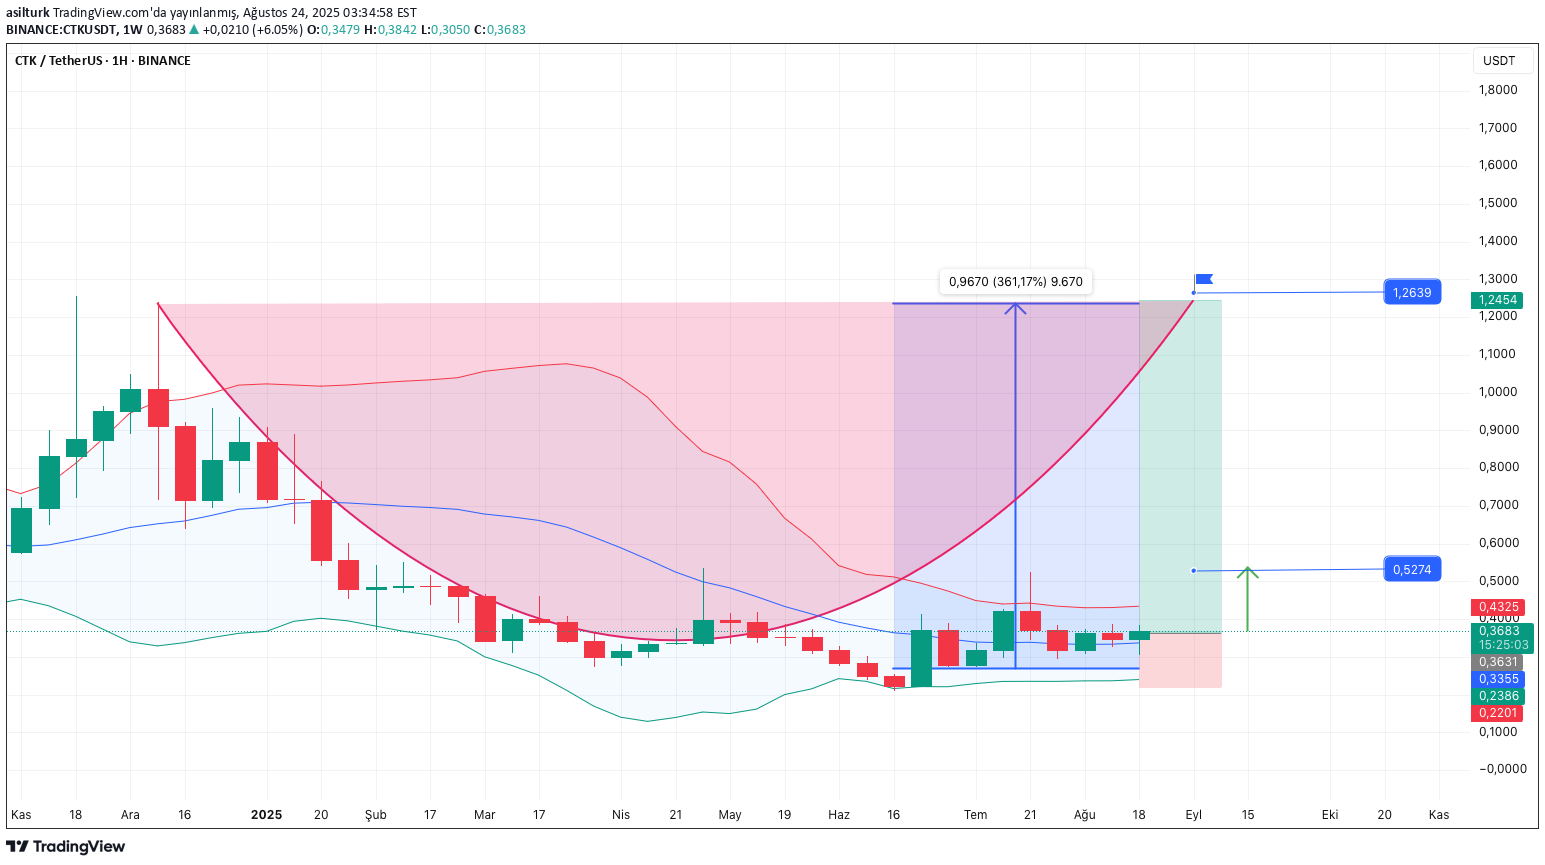
CTK (shentu) The market value looks 150 million in the actual circulation of $ 54 million. When it is released in 2020, we see that the pricing of $ 4.90 is taken in front of the Ggöy. As for the advantages .. Safety -oriented Approach: Especially with security solutions for Dapp and Blockchain projects. Rich Ecosystem Components: Security Oracle, Sentushield, Deepsea, Cvm offers various layers. High Performance with DPOS: offers efficiency and efficiency with advanced consensus mechanism. EVM and Cosmos Compatibility: Provides ease of integration between projects and extensibility. Various use of token: usage areas such as gas, stinging, governance, collateral contribute to the token value. Disadvantages / Risks Oğun Competition: Blockchain has many players in the field of security. Shentu's long -term position can be difficult to maintain. It is not clear to the extent to which the solutions offered by the platform are accepted. The uncertainty of the platform: The regulations in the crypto field may change, which may pose a risk to CTK. Technical and Safety Risks: It may be vulnerable to system deficits despite its safety solutions. As a result, when we look at technically, there is no significant increase in volume, but the momentum and monthly trend can be expected to have beautiful hard movements. I wish you plenty of gains.

MasterAnanda
Shentu (CTK) Breaks Above MA200 · 415% Easy Target Mapped

Look here. First notice the volume. Immediately you see green bars sticking out. Since we have a low but some mixed action also, this volume signal is the first thing that will tell us that the bulls are in the game. If it isn't showing on the price, it will do eventually. Then we notice the entire chart, the structure. On the left side we had a downtrend and then a major low. Many people can assume that after the bounce a bearish continuation is the next logical step. They would say that it is already dropping and it should continue doing so until there is proof of something different. But we already saw the volume signal and we also know the bigger picture, the market never stays the same. It fluctuates, so we are always looking to exploit this transition period, this moment of change. After the correction bottom we have no new lows. CTKUSDT (Shentu) is moving above MA200. This level is matching perfectly the 3-February low. This is the final resistance. Once above this level, which is already happening, expect bullish momentum to grow; maximum speed up and the highest prices since 2021 or even ever. The highest ever. This is where we are going. Thank you for reading. Namaste.

WaveRiders2
CTK Breakout Watch – Red Resistance Being Tested!

Disclaimer
Any content and materials included in Sahmeto's website and official communication channels are a compilation of personal opinions and analyses and are not binding. They do not constitute any recommendation for buying, selling, entering or exiting the stock market and cryptocurrency market. Also, all news and analyses included in the website and channels are merely republished information from official and unofficial domestic and foreign sources, and it is obvious that users of the said content are responsible for following up and ensuring the authenticity and accuracy of the materials. Therefore, while disclaiming responsibility, it is declared that the responsibility for any decision-making, action, and potential profit and loss in the capital market and cryptocurrency market lies with the trader.