
berkanUsdt
@t_berkanUsdt

What symbols does the trader recommend buying?
Purchase History
پیام های تریدر
Filter
berkanUsdt
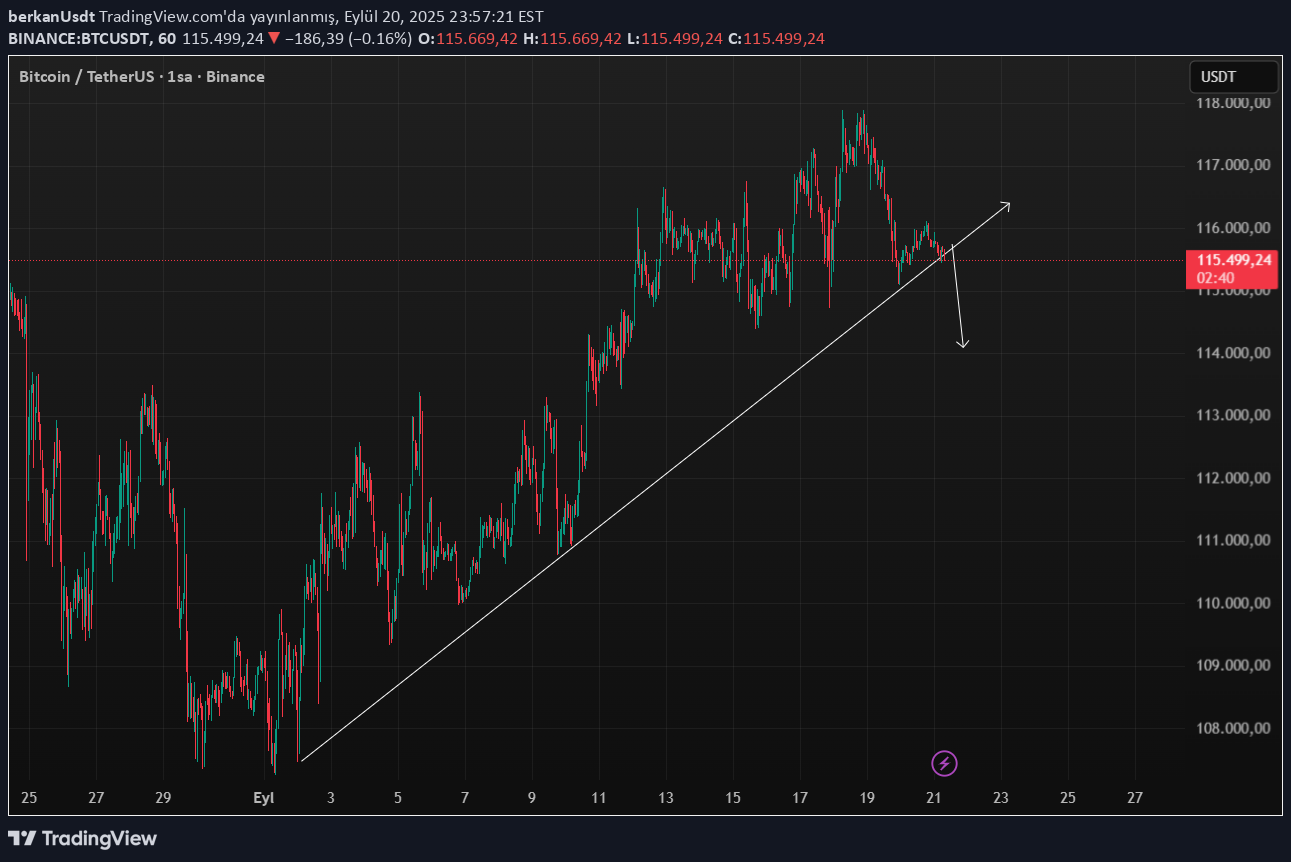
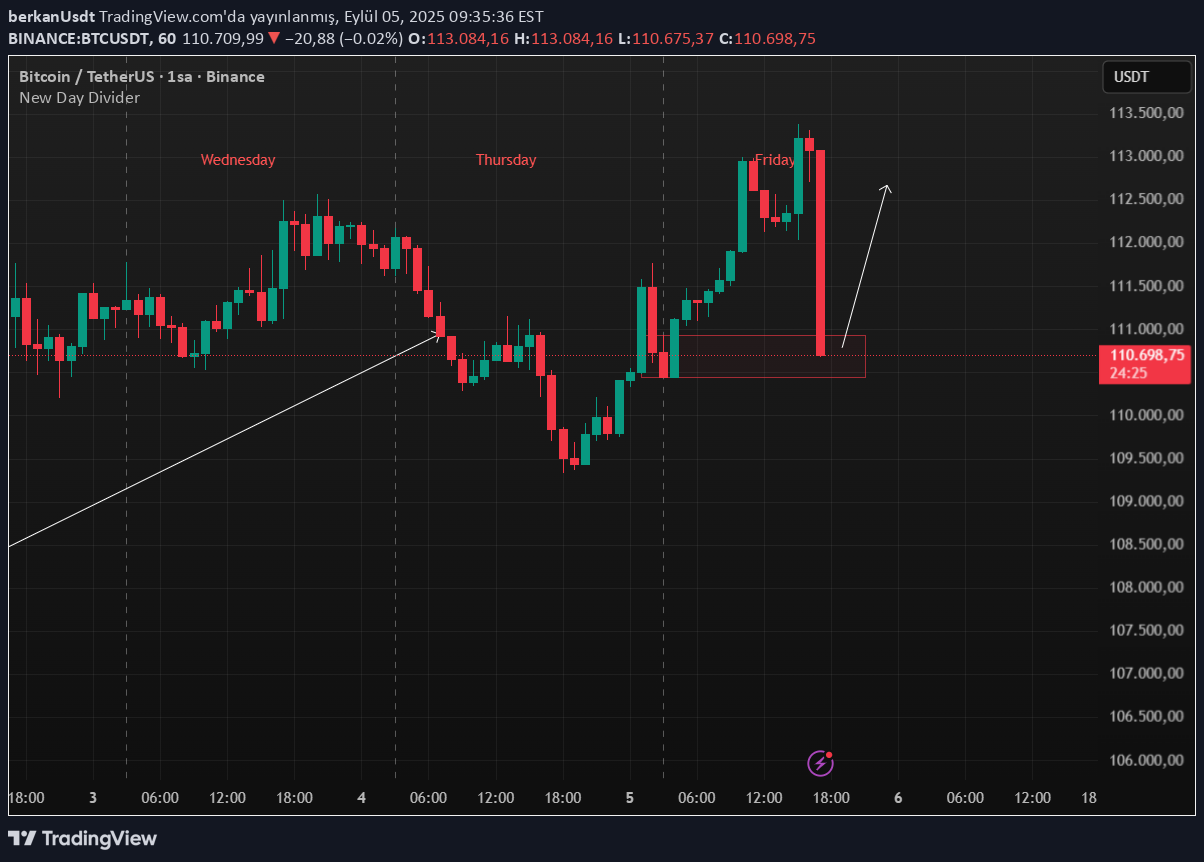
بیت کوین مقاومتها را شکست؛ اما آیا این پایان کار است؟ (تحلیل خلاف جهت)

But I open a short trade because in such good setups, it generally goes the opposite way and collects liquidity. The technique doesn't quite work the way you think. I opened a small amount of short, it doesn't matter if there is a stop. It is not investment advice.
berkanUsdt
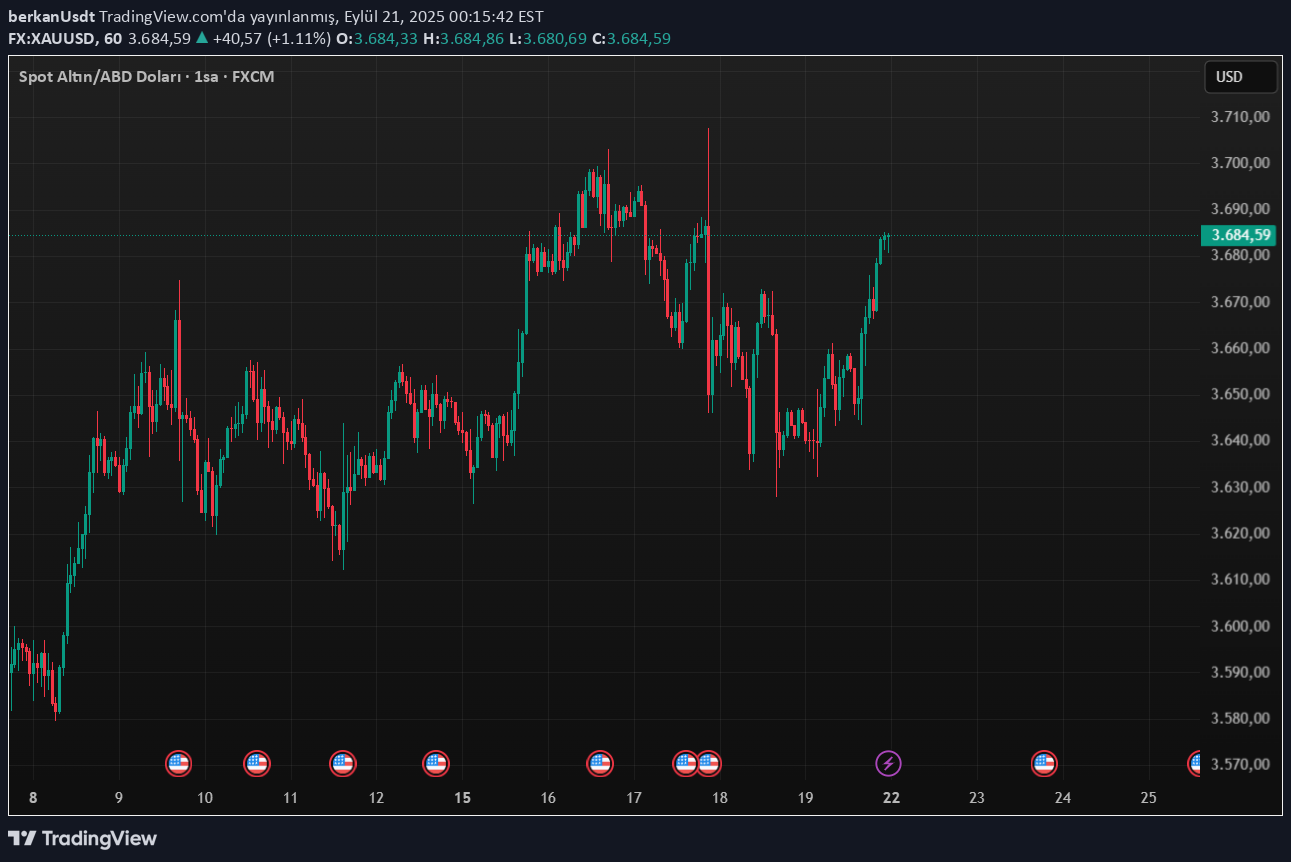
Altında Zirve Sonrası Kritik Dönemeç: Teknik ve Temel Sinyaller
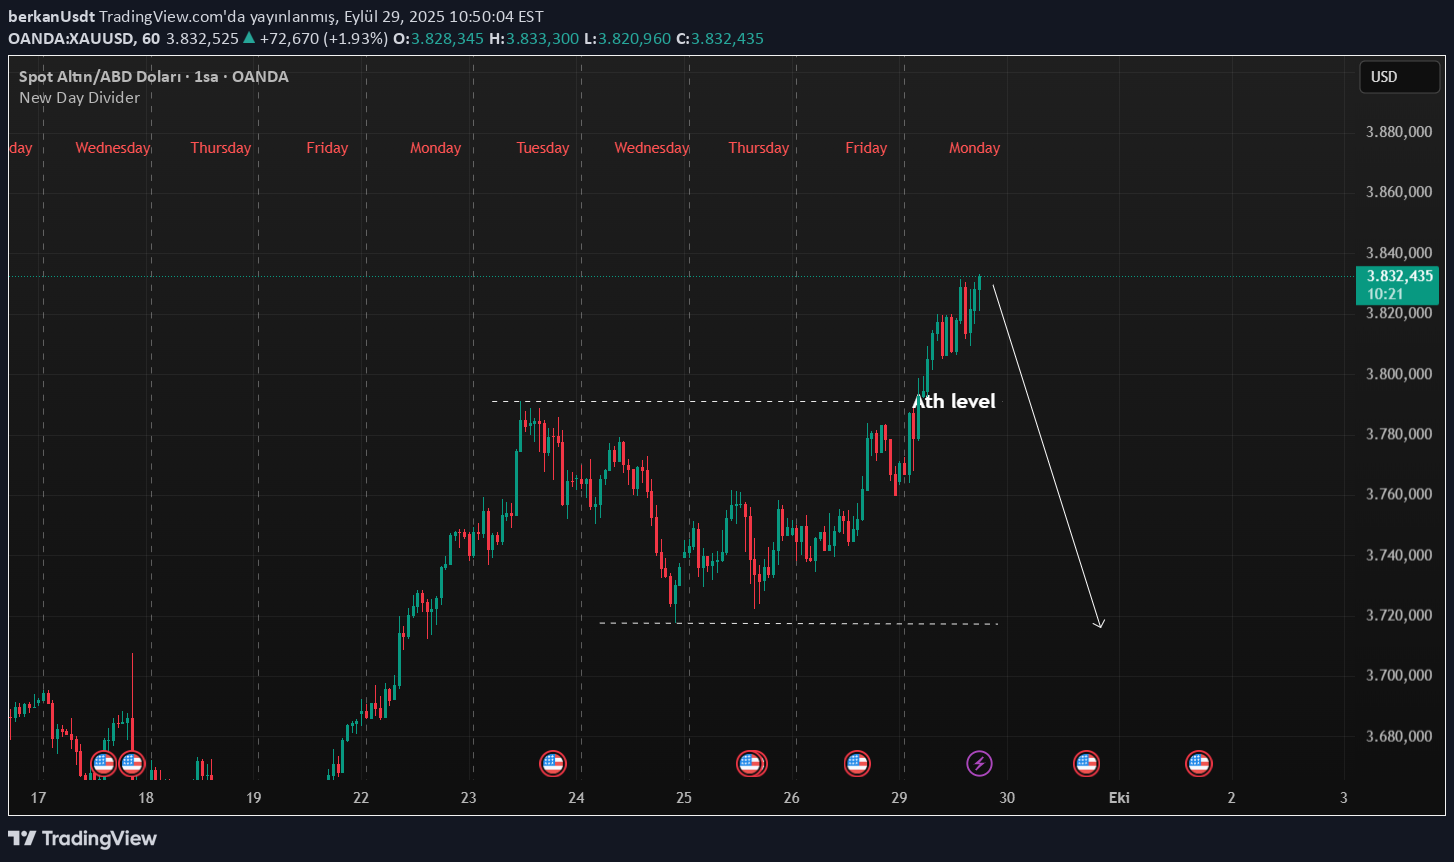
When I look at the technical appearance of gold, I think the price now reaches a satisfaction point. Following the recent ATH level, I observe that the pricing in these regions is increasingly tired and the loss of momentum became clear. Especially in daily and weekly graphics, although oscillators such as RSI and MACD continue to remain in the extreme purchase zone, the upward movement is now limited and negative incompatibilities begin to signal. This strengthens the likelihood of a technically potential trend return. On the basic side, the majority of macroeconomic data announced last week came above expectations. In particular, data on the inflation and employment market show that the FED will not rush to enter an aggressive interest rate cut, so it may be supportive in terms of the dollar index (DXY) and the US bond rates. This stands out as a negative basic factor for gold. Therefore, both the technical and basic indicators indicate that the likelihood of encountering sales pressure at these high levels of gold increases. Following the existing pricing, it seems more likely to deepen profit realization and test the lower levels in the medium term. For this reason, I start to open sales positions in my portfolio. It is not an investment advice.
berkanUsdt
YOKSA SİZ HEMEN DÜŞECEĞİNİ Mİ ZANNETTİNİZ?
Gold won't fall without a new record. Investment is not the advice of the gas and do not open too much by managing your risk to open the process I will not talk about the reasons in this graph. Don't forget to follow. !!
berkanUsdt
ALTIN TEKNİK VE MAKRO ANALİZİ
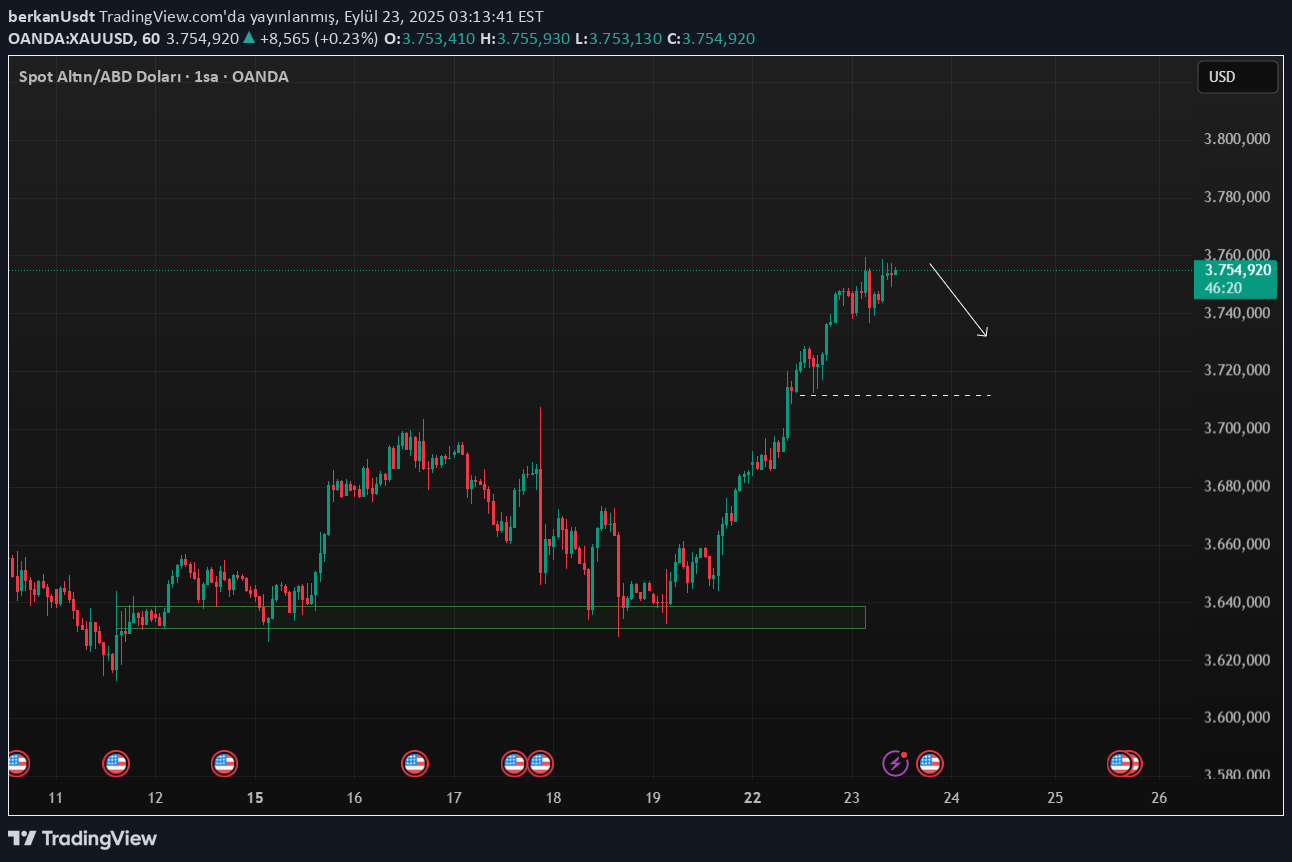
Gold prices have recently reached critical resistance levels by acting within a strong upward trend. In particular, the fibonacci 1.618 extension level shows that in the short term of technically, the over -purchase zone has been entered. 1. Technical view The RSI (Relative Strength Index) indicator is located in the overcrease area, which increases the likelihood of a possible correction. Testing Fibonacci 1.618 level is generally considered as profit realization zone for technical investors. Therefore, within a few hours, a downward correction wave is likely to begin. 2. Opening of American stock exchanges With the opening of the US markets: Increased risk appetite may reduce safe port demand. In particular, the tendency to turn to stocks can support the short -term sales pressure underneath. 3. Fed President Powell's speech (19:00) Powell's statements are critical for markets. Especially: The use of a hawk ton about interest policy can strengthen the dollar index (DXY). Strong Dollar = Gold -to -print on gold prices. Furthermore, if the message “interest will remain high for a long time”, it may have a negative catalyst effect for gold. 4. Possible Scenario In the short term, profit sales starting from 1.618 fibonacci levels can be accelerated. If the orientation of risky assets increases with the opening of the American stock exchanges, it is likely that the sales below will gain momentum. The pricing that will occur after Powell's speech will further clarify the direction of the movement. 📌 Conclusion: Gold is currently at a critical technical level. With the opening of the US markets and the FED President Powell's statements, the possibility of a downward correction within a few hours is strengthened. Although the medium-long term trend does not break, we are in a region that needs attention for short-term investors. For more, don't forget to follow here and from my social media accounts. It is not an investment advice.
berkanUsdt
BTC SON DAKİKA!
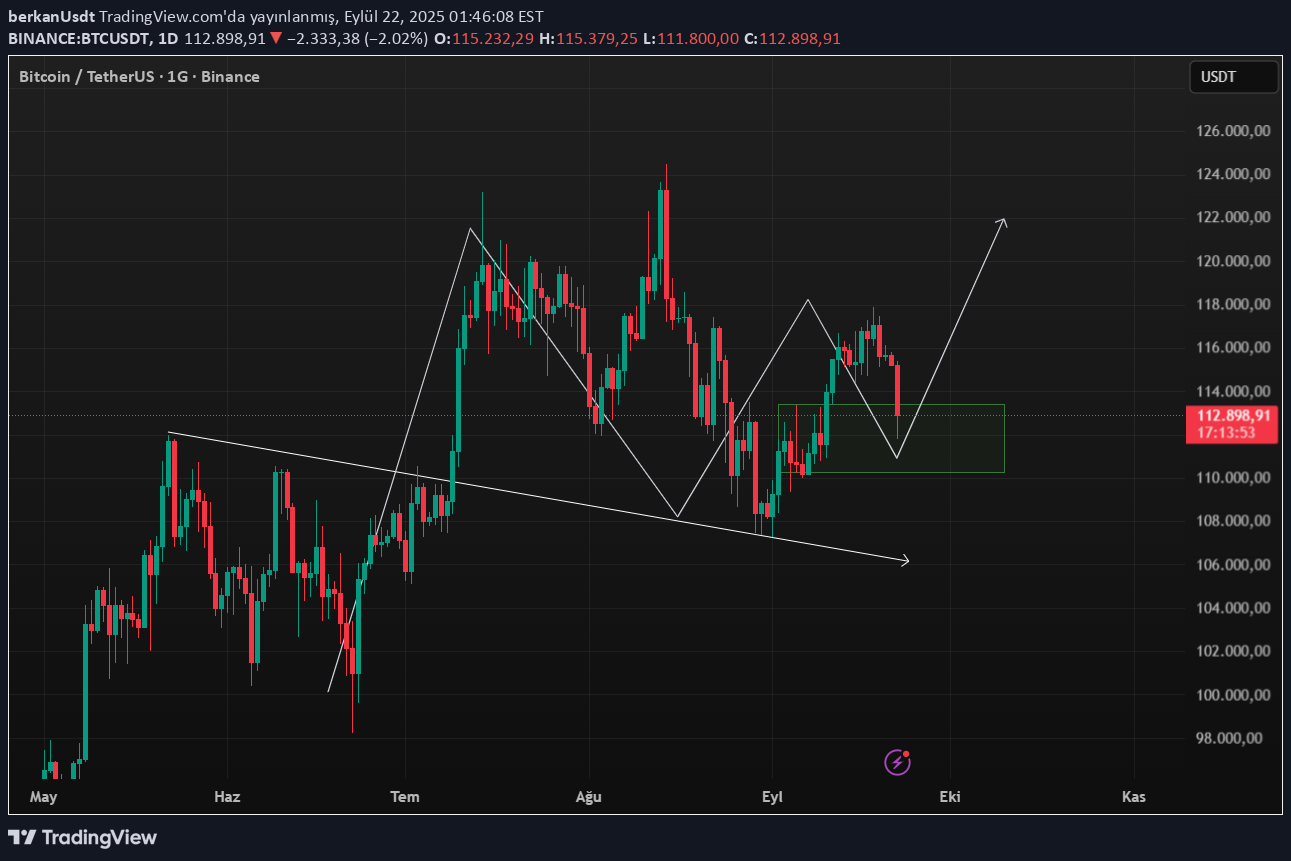
No need to panic. The latest movement in the market can be considered as a strong high -volume correction candle. Such candle formations are usually a reflection of short -term profit realization. The critical point here is the daily closing level; Because the continuity of the trend or the loss of momentum is confirmed, especially at the closing of daily periods. At this stage, the price failed to hang below the 112K major support zone. This shows that buyers strongly defend the region in question and that liquidity support is still high. Technically, this level is a structural demand zone. When the trend structure is examined, both the upward trend of medium -term moving averages and the fact that oscillators such as RSI and MACD continue to stay in the positive area in the diary indicates that the rise trend is still healthy. In addition, on-the Chain data shows that institutional flows and the supply held by long-term investors are increasing; This confirms that the price is supported in terms of basic dynamics. In summary, in the current conjuncture BITCOIN Both technical and basic factors for the positive appearance. However, the volatility may continue in the short term and it will be decisive in terms of determination whether daily closures will occur on critical levels. It is not an investment advice. Follow for more.
berkanUsdt
Piyasa Çalkantısına Rağmen Dimdik Ayakta Kalan Koin ''CTK''
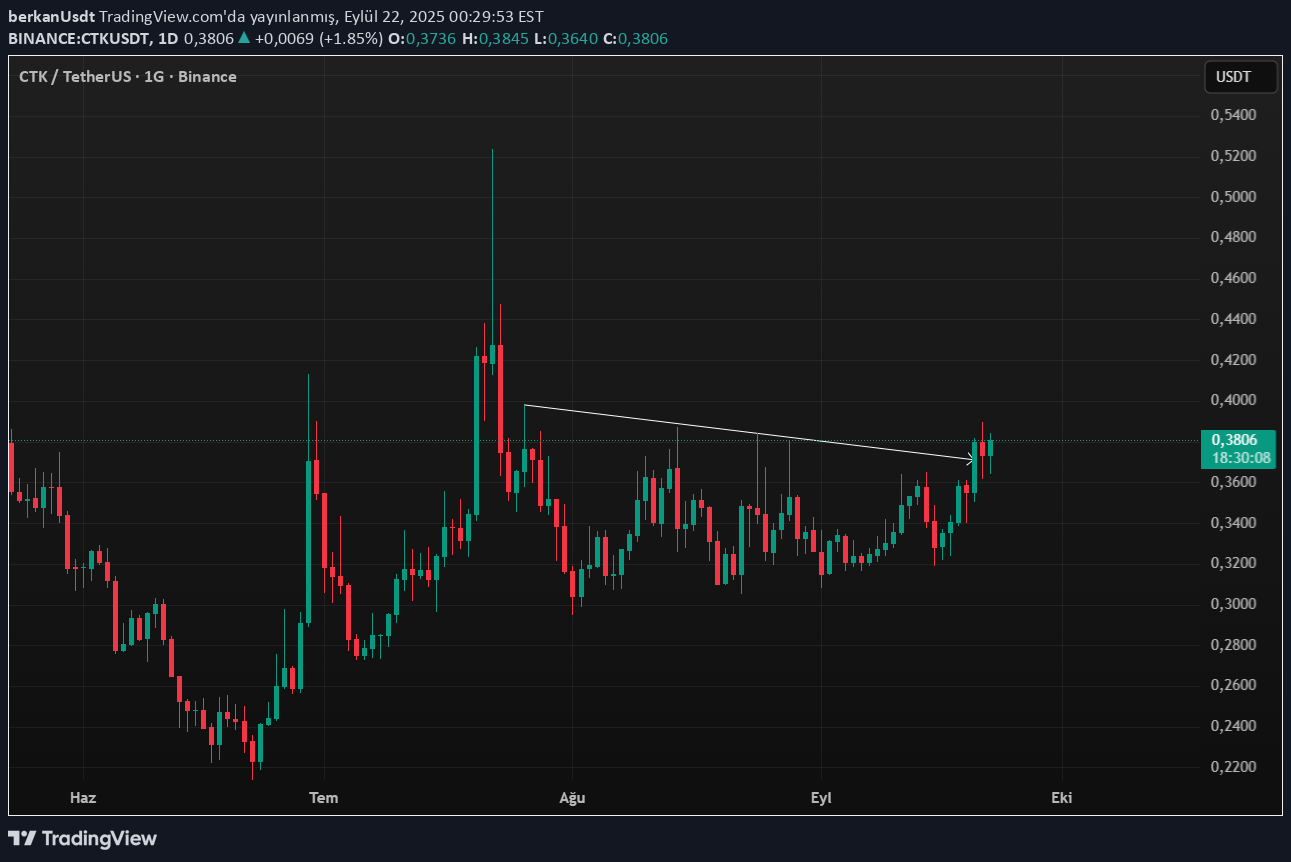
The main major crypto assets (BTC, ETH, SOL) exhibit downward price movements, while the CTK remains relatively strong. When examined on the graph, the narrowing triangular formation was broken upward and then performs the Pullback movement. This technical structure indicates that if the existing trend continues, the price can contain approximately 20 %of potential. However, this mobility may also indicate that the capital rotation of the major assets towards the subcoin segment has begun. If this capital flow gains momentum, we may have entered the period called Altcoin Season (Altcoin Bull) throughout the market. Briefly: Formation: shrinking triangle frustration + pullback Technical Probability: 20 %upward pricing potential Macro comments: Capital flow from major to bottoms → Altcoin season probability It is not an investment advice.
berkanUsdt
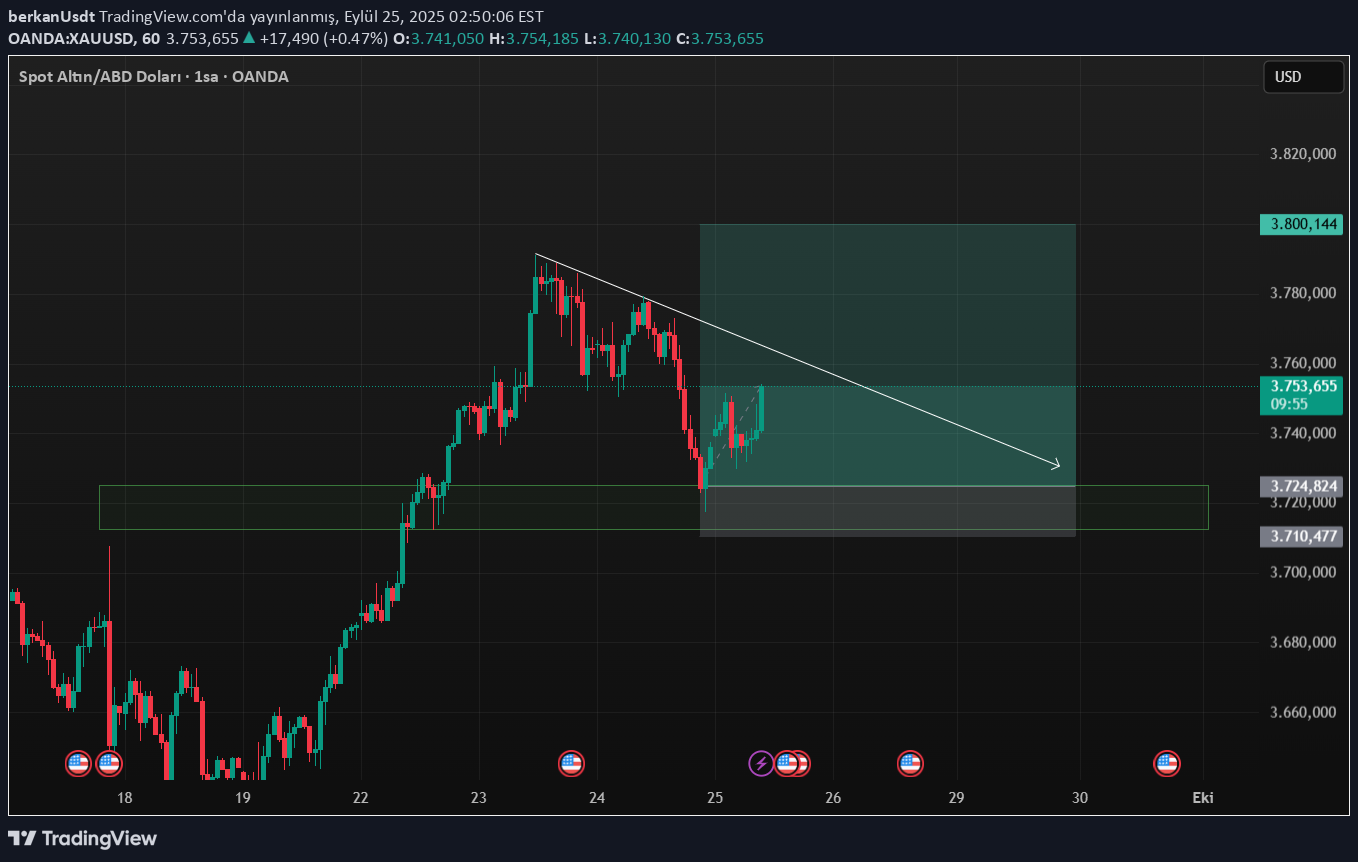
Bu Hafta Yeni Bir ATH Beklentisi.?
After the interest rate decision, a fell into a shaking decline took place, but managed to remain above strong support zones. We watched a nice recovery towards the closing of the week, and it was a powerful signal that shows that this #Xau rise would continue to continue. I decided to maintain my Long -oriented transactions due to the increase in volume and the fact that there is no full decrease signal in the indicators. I wish everyone a profitable week. It is not an investment advice.
berkanUsdt
Bitcoin Zayıfladı Sıradaki Major Destek 114k
Bitcoin could not catch a strong momentum in the last ascension attempt and could not provide permanence on the trend support. The volume decrease observed especially in 4H and daily graphics indicates that the interest of buyers in the market is weakened. The RSI indicator has started to accelerate downwards by returning from the excessive purchase zone. On the MACD side, the negative intersection signal becomes evident, technically strengthening the possibility of a fall. When the trend structure was examined, the correction process gained acceleration with the price of short -term rising channel support. alt support zones are now expected to be tested. The first major support level stands out as 114k. This region is both an important horizontal support in past price movements, as well as the fibonacci corresponding levels of correction, creating a technically powerful target zone. In summary: Bitcoin failed to hold on in the rise trend, indicators began to produce negative signals, and the price is gradually withdrawing in the coming process and the likelihood of testing 114k levels is gradually increasing. It is not an investment advice.
berkanUsdt
BTC/USD – Formasyonlar Aşağı Kırdı, Gözler 107.000$ Seviyesinde
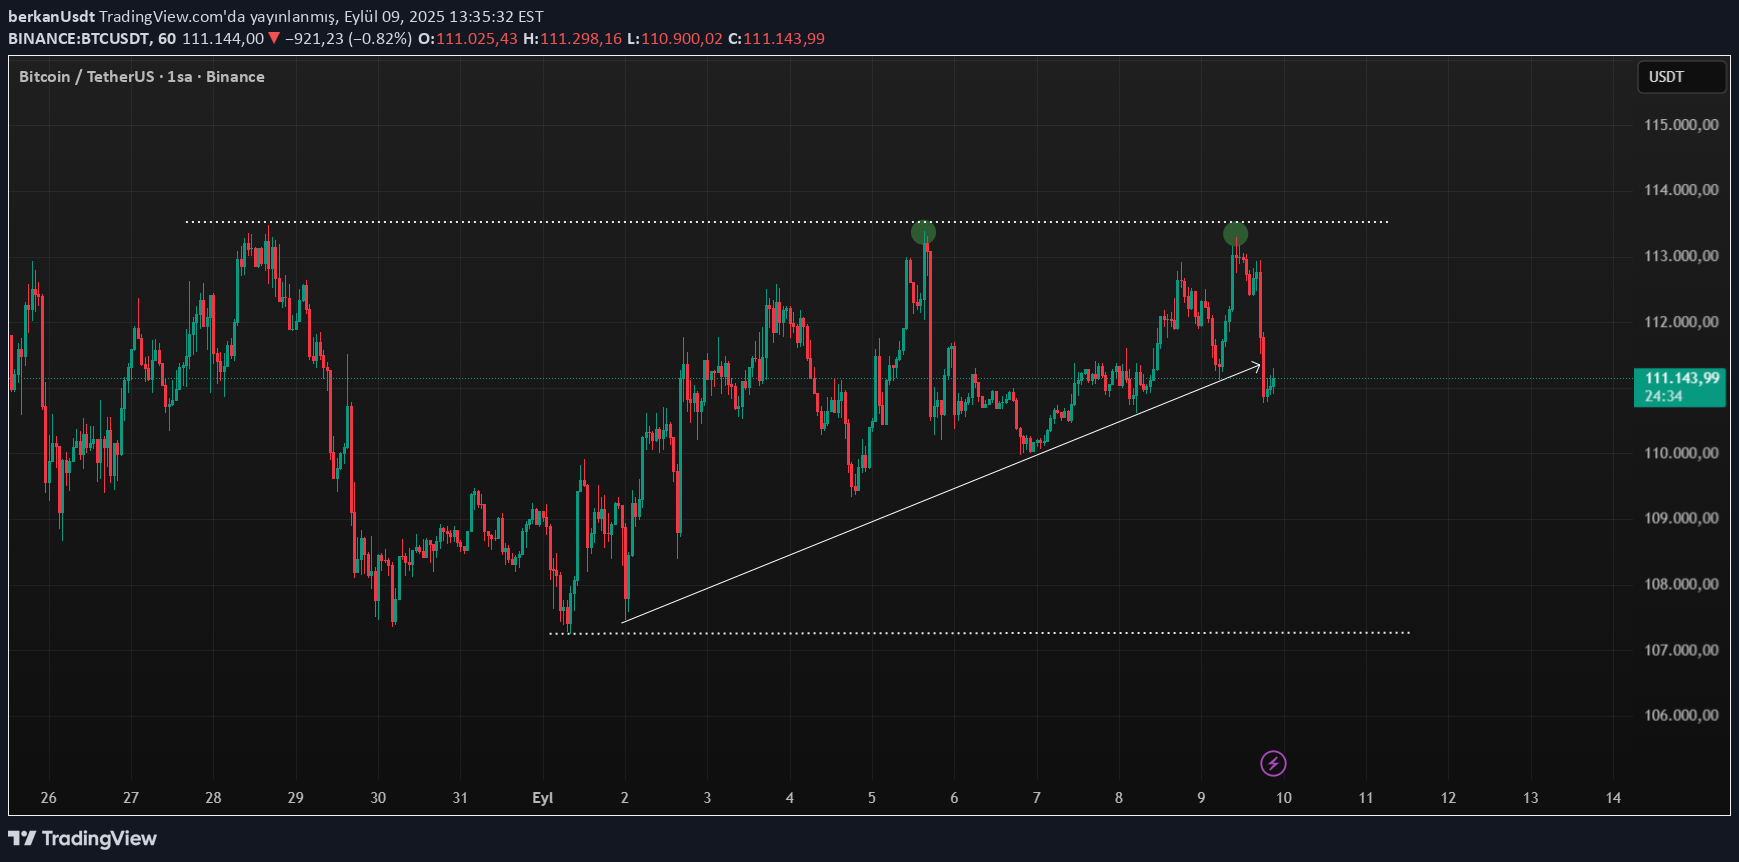
The rise trend, which has been going on for the last 10 days, has been broken downward as of today. Especially in the short term, the price of the price twice at similar peak levels by reacting to the double hill (double ball) formation, indicating that the current rise momentum weakens. However, price movements were trapped in the narrowing band and created a symmetric triangle (Symmetrical Triangle) formation. The downward break of this formation shows that sales pressure stands out in terms of the continuation of the trend. Technically, our first important support level is $ 107,000. This level stands out both as a critical psychological and technical support area in the short term, which is compatible with the formation target. It seems likely to test this level. For now, the appearance is weak in the short term; However, we can maintain our positions by evaluating the process together with basic indicators. Investment is not advice!
berkanUsdt
BTC LONGLAMAK İÇİN BİR FIRSAT DAHA VERMİŞ OLABİLİR.
I haven't researched the technical reason behind it right now, but the dollar needs to weaken. I suggest you be careful. YTD.
Disclaimer
Any content and materials included in Sahmeto's website and official communication channels are a compilation of personal opinions and analyses and are not binding. They do not constitute any recommendation for buying, selling, entering or exiting the stock market and cryptocurrency market. Also, all news and analyses included in the website and channels are merely republished information from official and unofficial domestic and foreign sources, and it is obvious that users of the said content are responsible for following up and ensuring the authenticity and accuracy of the materials. Therefore, while disclaiming responsibility, it is declared that the responsibility for any decision-making, action, and potential profit and loss in the capital market and cryptocurrency market lies with the trader.