
CRCLX
Circle tokenized stock (xStock)
| تریدر | نوع سیگنال | حد سود/ضرر | زمان انتشار | مشاهده پیام |
|---|---|---|---|---|
 DEXWireNewsRank: 38 | خرید | حد سود: تعیین نشده حد ضرر: تعیین نشده | 12/9/2025 | |
 Bullfinder-officialRank: 2828 | خرید | حد سود: تعیین نشده حد ضرر: تعیین نشده | 12/17/2025 | |
خرید | حد سود: تعیین نشده حد ضرر: تعیین نشده | 12/19/2025 |

Price Chart of Circle tokenized stock (xStock)
سود 3 Months :
سیگنالهای Circle tokenized stock (xStock)
Filter
Sort messages by
Trader Type
Time Frame

New Setup: CRCL

There's talk that once silver starts pulling back, money will flow into crypto in January. If that happens, CRCL looks to be setting up to breakout. I'm going to look for a close above the daily 5SMA with a stop at the last pivot lows.
CRCL - Simple Buy Signal

Everything is obvious in the chart. After breaking the descending trend and retesting, a simple buy signal will be triggered.

wijitha
چگونه در بازار نزولی (Bearish) سود کنیم؟ استراتژیهای حیاتی معاملهگران حرفهای

Bearish markets test the mettle of every trader—but they also sharpen strategy and reveal hidden potential. Success lies in recognizing resistance zones, anticipating trend shifts, and enforcing disciplined risk controls like stop-losses and diversified holdings. Staying informed on macroeconomic developments—such as fiscal policy, global trade dynamics, and central bank signals—adds a crucial layer of foresight. Rather than fearing downturns, seasoned traders view them as setups for future gains. With patience, adaptability, and a clear-eyed strategy, every dip becomes a stepping stone toward long-term resilience.
Bullfinder-official
Blockchain Payments - Circle ready to make a line play higher?

Growing Revenue, blockchain payment solutions gaining traction...Is CRCL looking to make a move to the upside? Our systems have identified a point of potential interest & volatility in CRCL. If price can hold above $75.55 ... Significant Bullish potential may be unlocked. If however price falls below $75.55 ... Significant Bearish risk may come into play. Although momentum may currently be to the downside...Is this about to change? We're inspired to bring you the latest developments across worldwide markets, helping you look in the right place, at the right time. Thanks for reading! Stay tuned for further updates, and we look forward to being of service along your trading & investing journey... Disclaimer: Please note all information contained within this post and all other Bullfinder-official Tradingview content is strictly for informational purposes only and is not intended to be investment advice. Please DYOR & Consult your licensed financial advisors before acting on any information contained within this post, or any other Bullfinder-official TV content.

Circle: The Next-Generation USD-Based Payment Network

The past 17-year stock price CAGR of Visa and Mastercard (22.6% and 25.4%, respectively) is the result of payment volume growth (around 8–10% annually) translating into revenue and profit growth, amplified by share buybacks that increase per-share value. The fact that their stock prices have risen far more than USD M2 growth (6.1%) also reflects network effects and margin expansion. In Circle's case, more than 95% of current revenue comes from USDC reserve interest income (from short-term Treasuries). If USDC supply grows at a 12% CAGR: Reserve income will increase roughly in line with the supply growth rate. While a 12% growth in USDC supply serves as the revenue base, Circle is less transaction-fee-centric than Visa/Mastercard and has higher dependence on interest income, so a certain discount should be applied. The actual growth rate could be even higher than what was calculated based on this foundation. This was estimated conservatively. In conclusion, since growth is based on the increase in currency issuance, the growth trends will be similar.

dRends35
CRCL - May Be A Bearish Indicator For Crypto
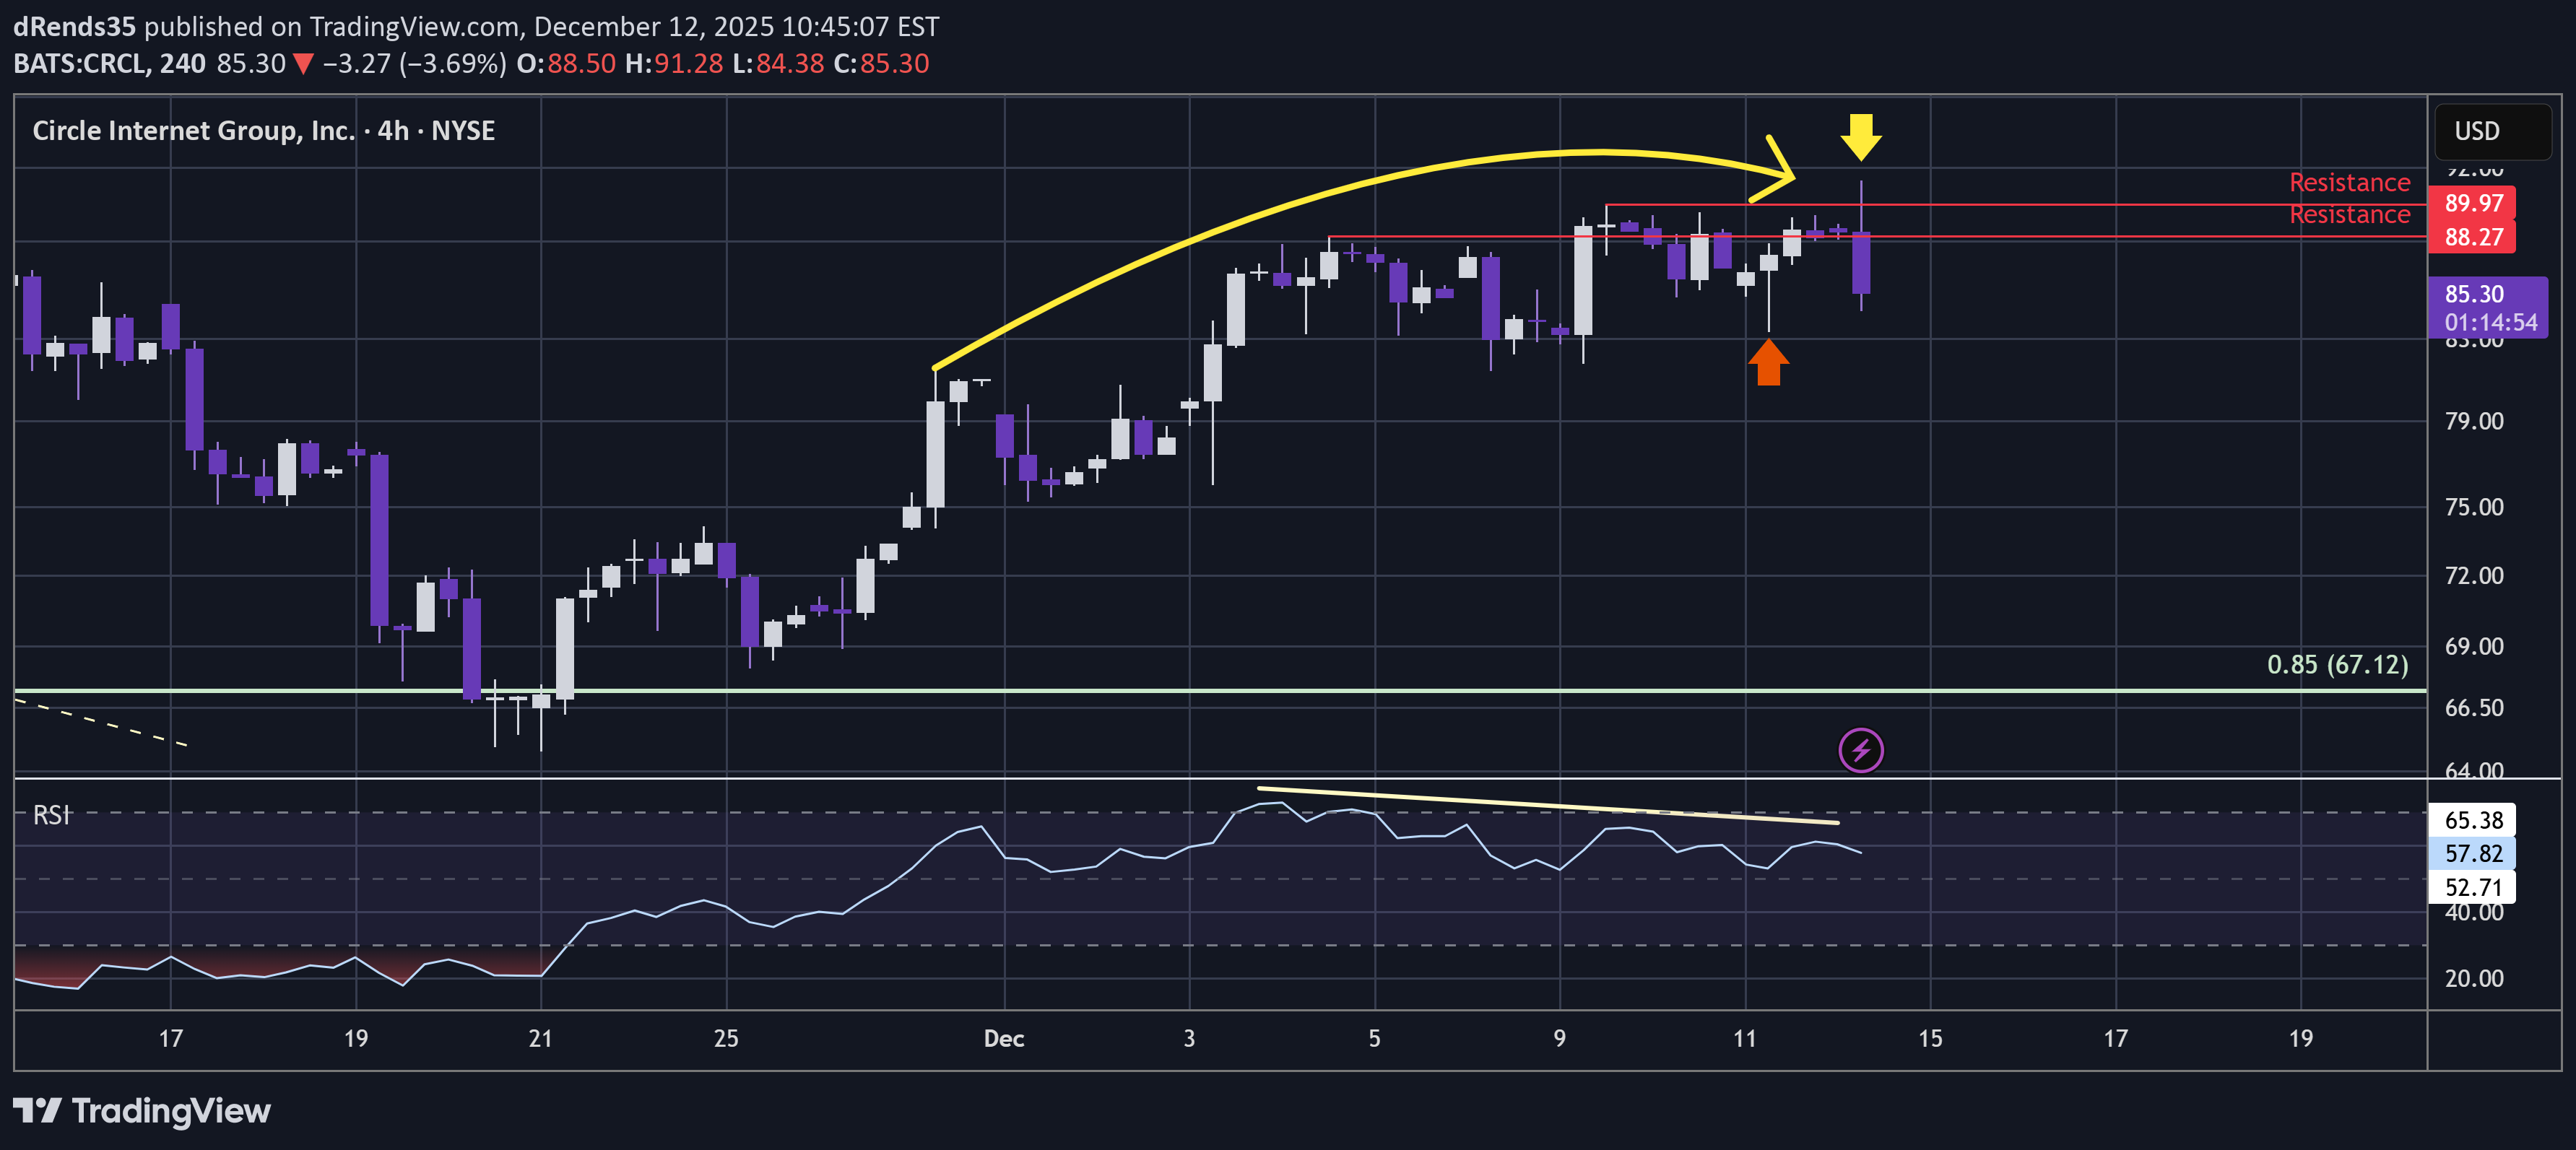
CRCL may be quite a warning indicator here for crypto. Notice how the uptrend is leaning over with liquidity sweeping slightly higher highs. And just in the last few hours has whipsawed up to sweep the high again before printing impulsive downside - shakeout pattern. Also notice that the RSI has been printing bearish divergence. So, this is a technical short really, though with so many great longs to buy I won't be shorting it - and it would be quite an aggressive trade. This looks like a potential high time frame retracement has completed and now the dominant trend may be asserting to the downside. This may be signalling that Bitcoin / TOTAL may do something similar 🤨. This analysis is shared for educational purposes only and does not constitute financial advice. Please conduct your own research before making any trading decisions.

quantsignals
CRCL Put Strategy: Momentum Points to Short Opportunity

Instrument: CRCL Trade Direction: PUT (SHORT) Strike: $82.00 Entry Price: $5.38 Profit Target 1: $8.07 Profit Target 2: $9.69 Stop Loss: $4.30 Expiry: 8 days (2025-12-19) Position Size: 2% of portfolio Confidence: 62% (Medium conviction) Risk Level: Moderate — Katy AI signal neutral, but technicals strongly bearish Trade Rationale: Katy AI Signal: Neutral (50% confidence) — mixed signals, minor downward movement before potential recovery. Technical Analysis: Weekly bearish momentum (-1.62%) and 2-week downtrend (-2.41%) Current price $84.90 below VWAP $86.74 RSI oversold at 29.3 in trending regime Support at $81.76, resistance at $89.98 News Sentiment: Neutral — no major CRCL-specific catalysts. Options Flow: Neutral, no unusual activity detected. Competitive Edge: Strong technical bearish momentum with oversold RSI in trending regime Timing advantage approaching weekly expiry allows gamma effects to favor put positioning Conservative strike selection with 0.645 Delta for balanced risk/reward Risk Notes: Katy AI neutral signal conflicts with technicals; trade with smaller position Monitor any CRCL-specific news that could reverse technical setup
quantsignals
CRCL Put Play: Exploiting Short-Term Downside with Katy AI

CRCL Weekly Signal | 2025-12-09 Instrument: CRCL Direction: BUY PUTS (Contrarian) Confidence: 58–60% (Medium-Low conviction) Expiry: 2025-12-12 (3 days) Strike Focus: $85.00 Entry Range: $5.15 – $5.20 (Mid: $5.18) Target 1: $6.18 – $7.80 (20–50% gain) Target 2: $7.22 – $9.47 (40–82% gain) Stop Loss: $3.50 – $4.12 (20–33% loss) Position Size: 2% of portfolio Weekly Momentum: NEUTRAL (+0.90% / -0.84%) Options Flow: Neutral Flow Intel: Low unusual activity; low gamma risk Analysis Summary Katy AI Prediction: Bearish trajectory to $84.84–$85.50 by expiration (3-day horizon) Technical Analysis: Current price $88.60–$89.06 near week highs; VWAP $85.44–$85.74; MACD bearish; overbought → potential mean reversion News Sentiment: Neutral; sector rotation may pressure CRCL, no specific catalysts Risk Level: MODERATE — low volume increases slippage; tight stops required Competitive Edge: Katy AI provides granular 168-point time-series prediction showing consistent downward pressure, offering precise timing advantage Key Notes Weekly options → fast time decay; exit if targets not reached Low volume → expect wider spreads Katy AI conflict: General QS guidance suggested BUY CALLS, but Katy’s detailed series supports bearish PUT trade Tight stop-loss recommended due to medium conviction
DEXWireNews
Circle Internet Group Secures ADGM License for USDC Expansion
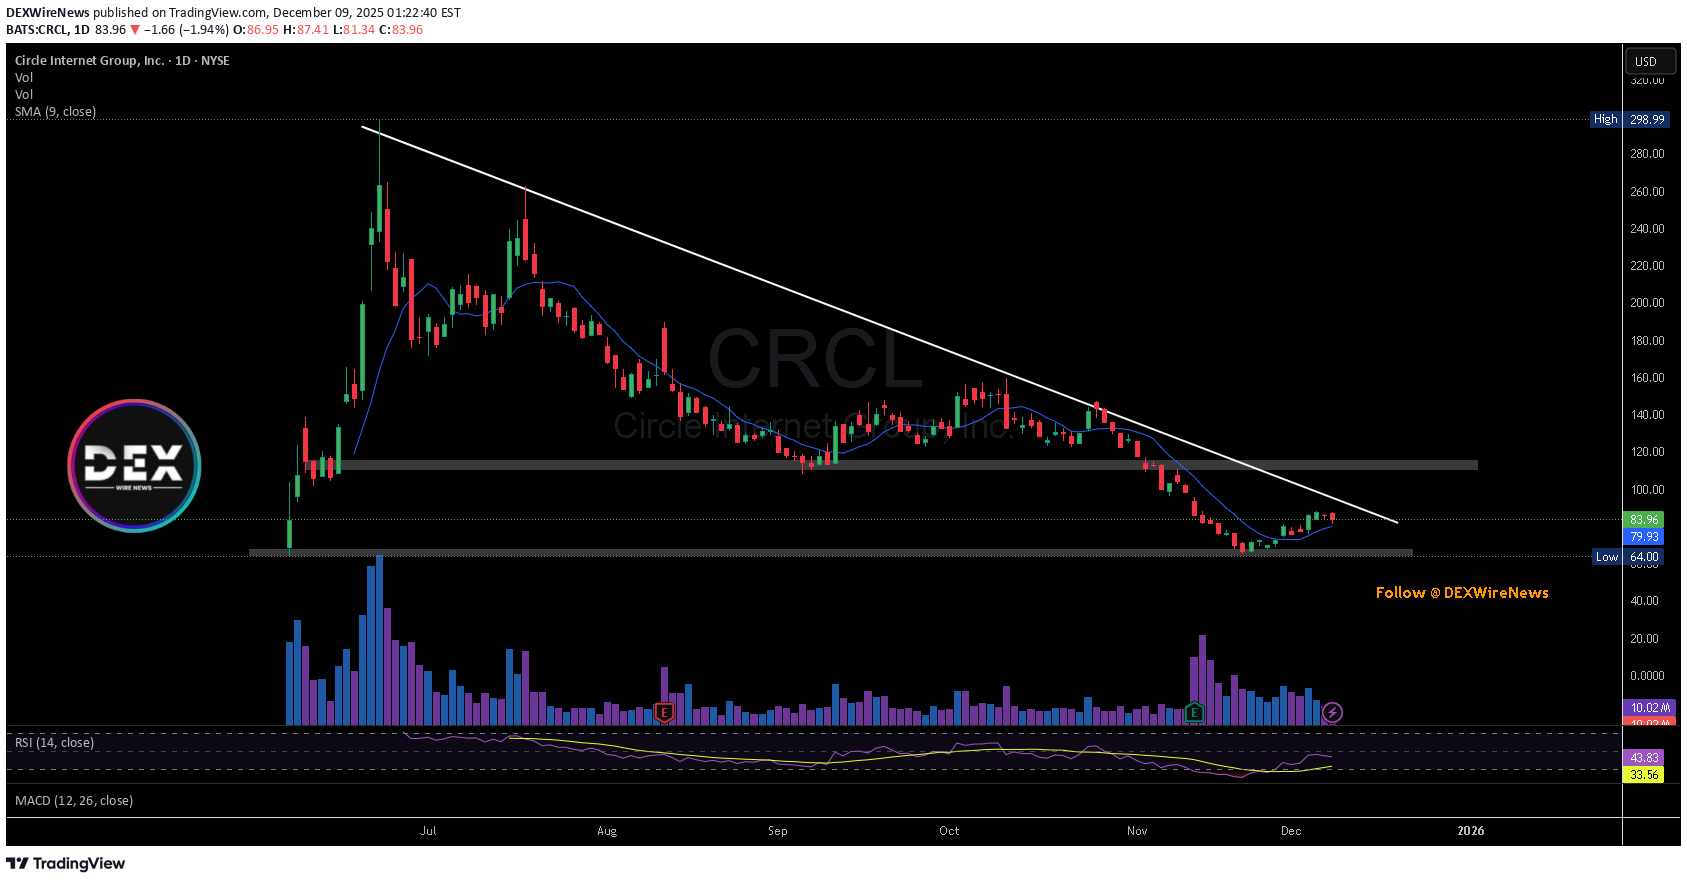
Circle Internet Group Inc. (NYSE: CRCL ) has secured a major regulatory milestone after Abu Dhabi Global Market (ADGM) granted the company a Financial Services Permission (FSP) to operate as a licensed Money Services Provider in the UAE. The approval allows Circle to expand USDC’s institutional use across the Gulf, strengthening the stablecoin’s role in payments, settlements, and corporate finance. With over $78B in USDC circulation, Circle is positioning itself at the center of a region rapidly embracing regulated digital assets. The UAE has become a magnet for global crypto players under ADGM’s robust regulatory framework. Binance, Tether, and Ripple have all secured approvals in recent months, helping establish Abu Dhabi as a global hub for stablecoin innovation. Tether’s USDt and Ripple’s RLUSD were also recently recognized for institutional use, creating a competitive but expansive environment for Circle to scale. Circle also appointed Visa veteran Dr. Saeeda Jaffar to lead Middle East and Africa operations, reinforcing its long-term commitment to the region’s growing demand for regulated digital payment infrastructure. Smaller markets with limited banking access have increasingly turned to stablecoins for fast and secure transactions. With ADGM’s backing, Circle now gains a powerful regulatory base to support USDC adoption in government, fintech, and enterprise environments—an advantage that strengthens its global expansion strategy. Technical Analysis CRCL has been in a sustained downtrend since July, consistently rejecting the descending trendline. After falling toward the $64 support zone, momentum shifted, and price rebounded into the mid-$80s. The stock is currently testing the long-term descending trendline once again. Volume shows stronger accumulation on recent green candles, signaling early buying interest after months of weakness. RSI has lifted from oversold levels, confirming improving momentum despite still-bearish broader structure. If CRCL breaks and closes above the trendline, the next upside target sits in the $115–$120 supply zone, where previous consolidation formed. Failure to break out risks a retest of the $64 support. Bulls need sustained volume and a clean trendline break to confirm reversal strength.
wijitha
BEARISH TREND Analyze

Bearish markets test the mettle of every trader—but they also sharpen strategy and reveal hidden potential. Success lies in recognizing resistance zones, anticipating trend shifts, and enforcing disciplined risk controls like stop-losses and diversified holdings. Staying informed on macroeconomic developments—such as fiscal policy, global trade dynamics, and central bank signals—adds a crucial layer of foresight. Rather than fearing downturns, seasoned traders view them as setups for future gains. With patience, adaptability, and a clear-eyed strategy, every dip becomes a stepping stone toward long-term resilience.
Disclaimer
Any content and materials included in Sahmeto's website and official communication channels are a compilation of personal opinions and analyses and are not binding. They do not constitute any recommendation for buying, selling, entering or exiting the stock market and cryptocurrency market. Also, all news and analyses included in the website and channels are merely republished information from official and unofficial domestic and foreign sources, and it is obvious that users of the said content are responsible for following up and ensuring the authenticity and accuracy of the materials. Therefore, while disclaiming responsibility, it is declared that the responsibility for any decision-making, action, and potential profit and loss in the capital market and cryptocurrency market lies with the trader.