
COTI
COTI
| تریدر | نوع سیگنال | حد سود/ضرر | زمان انتشار | مشاهده پیام |
|---|---|---|---|---|
No results found. | ||||
Price Chart of COTI
سود 3 Months :
سیگنالهای COTI
Filter
Sort messages by
Trader Type
Time Frame

ULYSSESTRADER
سیگنال فروش فوری COTI/USDT: فرصت کسب سود در ریزش جدید (با حد ضرر مشخص)
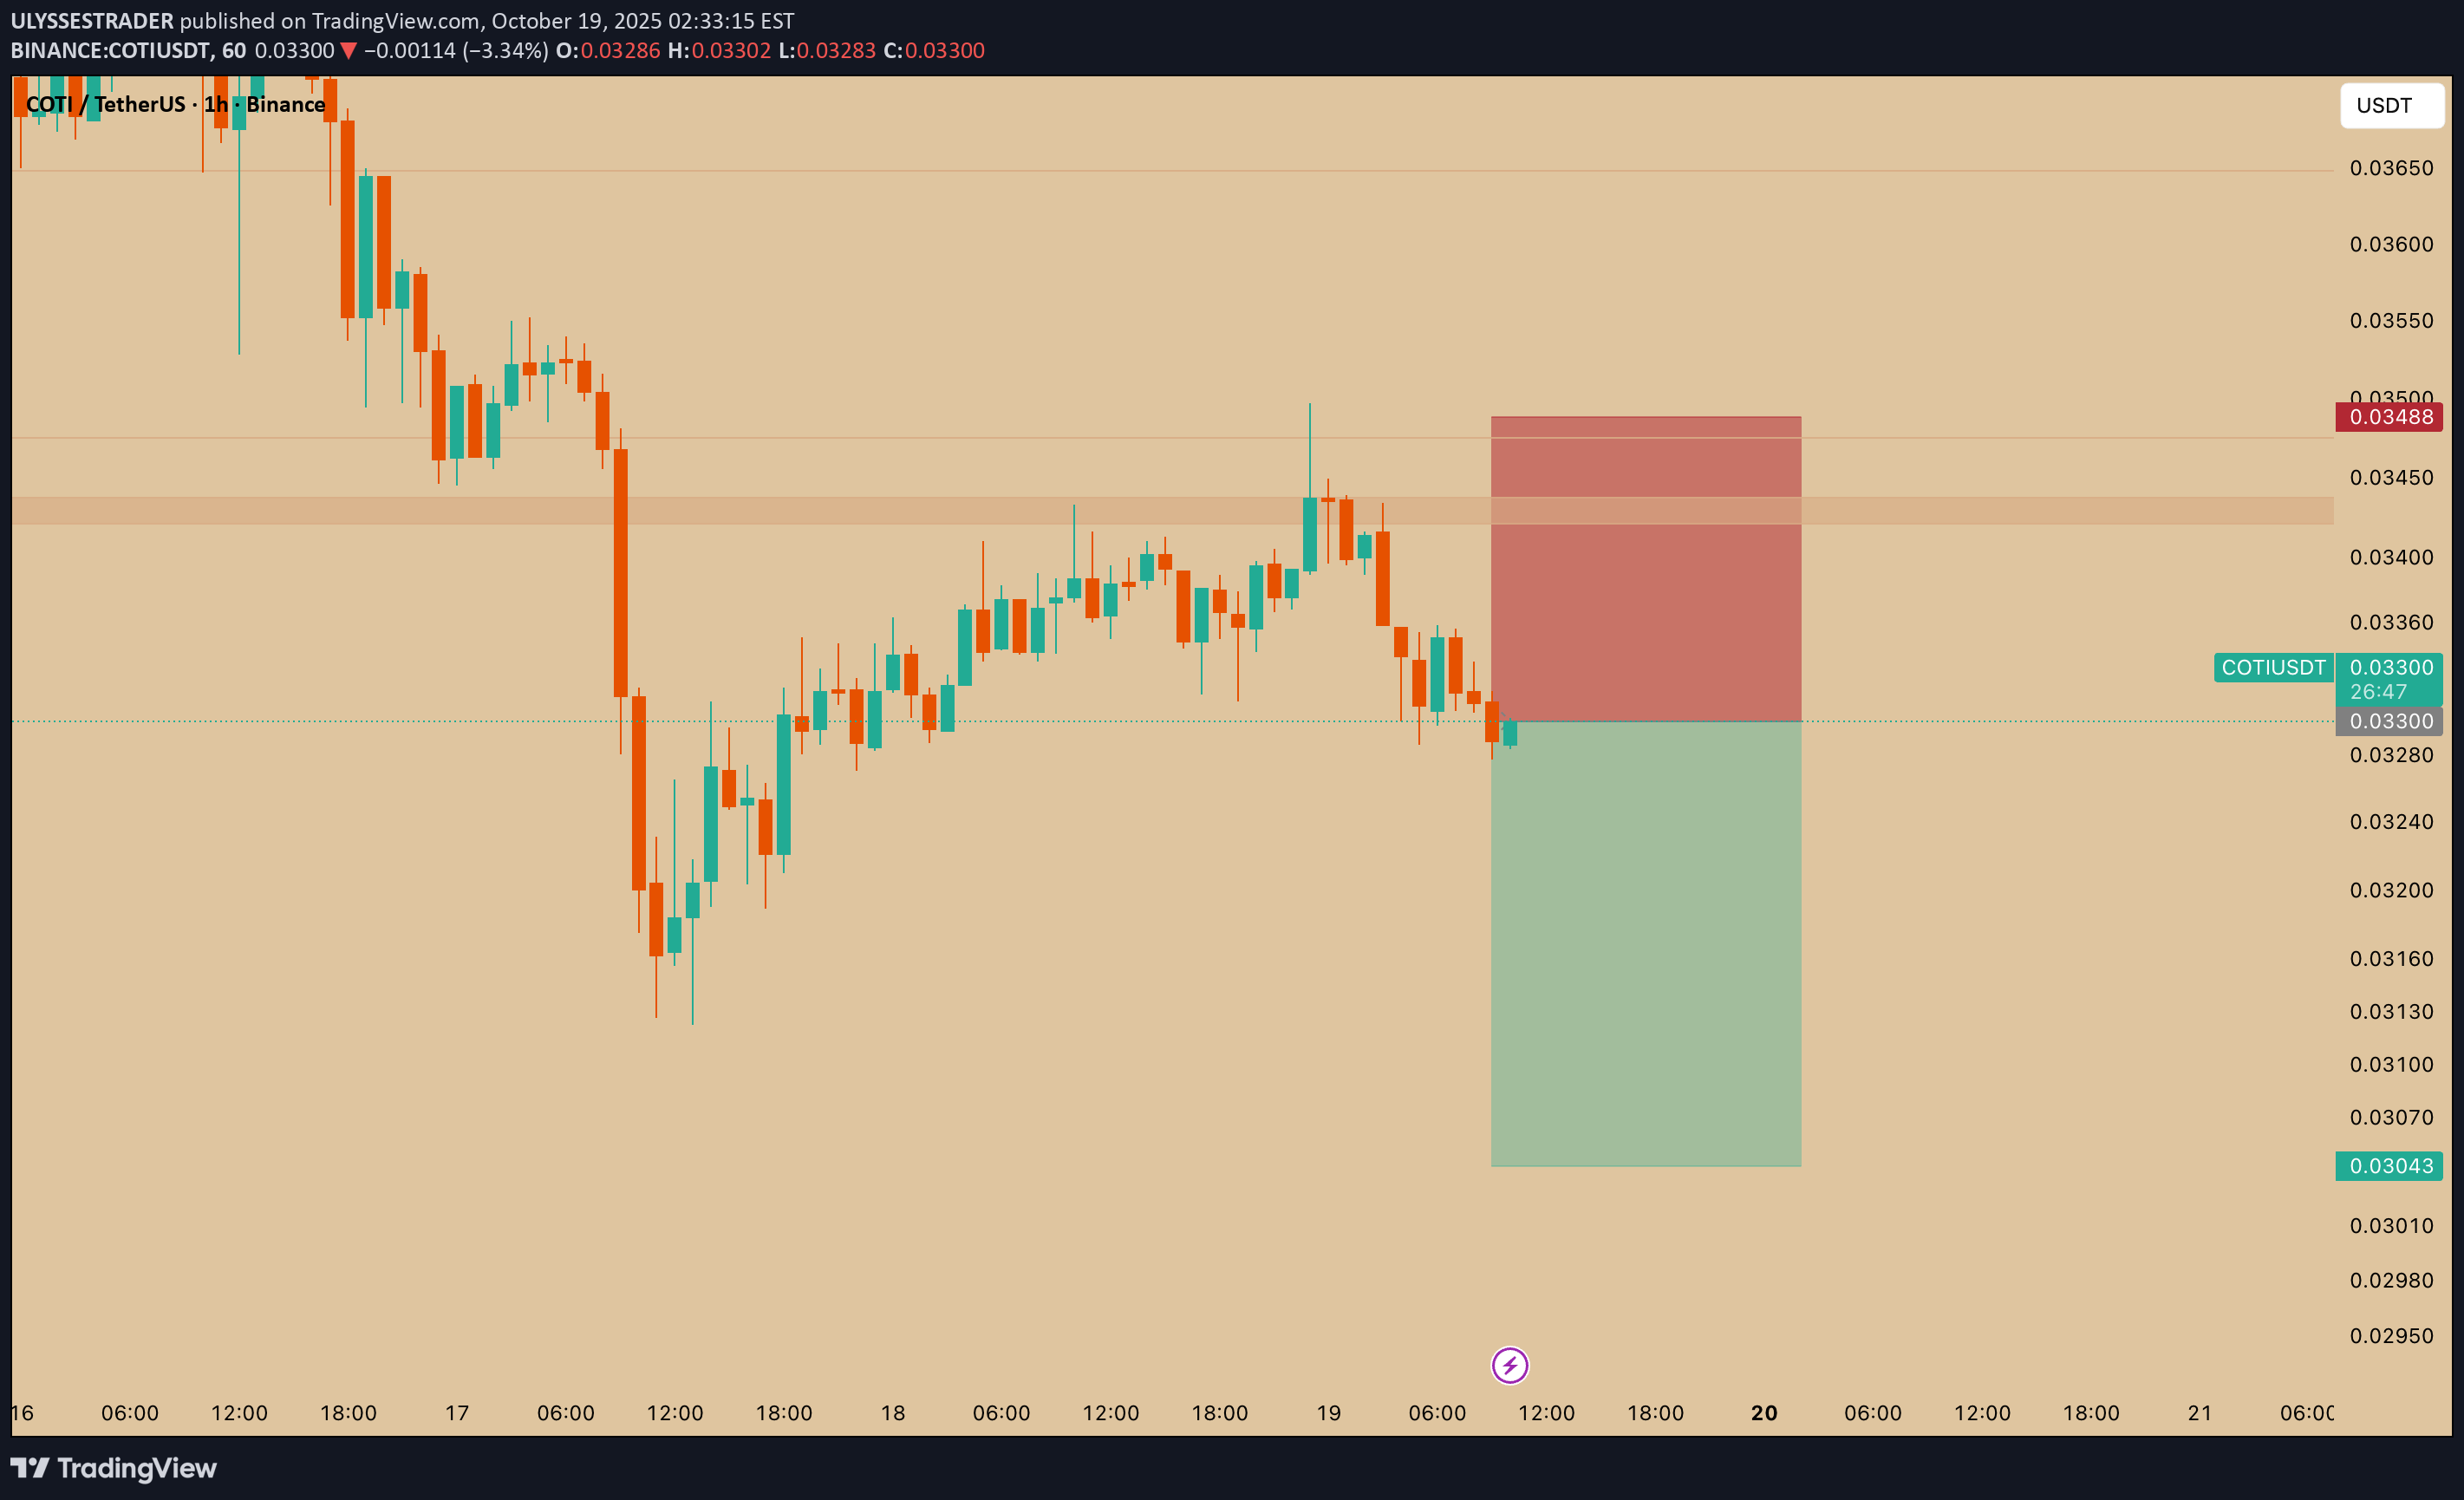
1. Chart Context Pair: COTI/USDT Timeframe: 1h Current Price: ≈ 0.03299 USDT Market has been in a downtrend with lower highs and lower lows. Price recently tested resistance and is now showing rejection. 2. Trade Setup This is a short position (betting on price to drop). The red/green rectangle highlights the Risk/Reward (R:R) structure: Entry Zone: Around 0.0330 USDT (current price, at rejection point). Stop Loss (SL): 0.03488 USDT (top of the red box). If price climbs above this level, the short trade setup is invalid. Take Profit (TP): 0.03043 USDT (bottom of the green box). Target is a move down into prior support. 3. Risk/Reward Ratio Risk (SL distance): ~0.0019 USDT Reward (TP distance): ~0.0026 USDT R:R ratio ≈ 1.37:1 Moderate setup; reward is larger than risk but not extremely high. 4. Support & Resistance Resistance Zone: 0.0345–0.0350 (previous rejection area). Support Zone: 0.0303–0.0305 (green target zone). The trader expects sellers to defend the resistance and push the price back into the support area. ✅ In summary: This is a short trade setup on COTI/USDT, where the trader enters around 0.0330, sets a stop at 0.03488, and targets 0.03043. The setup relies on price rejecting resistance and continuing the downtrend toward support.

Alpha-GoldFX
آیا COTI آماده انفجار است؟ راز الگوی "گُوِه نزولی" که نوید رشد 650 درصدی میدهد!

COTIUSDT is showing a Falling Wedge Pattern, one of the most powerful bullish reversal setups in technical analysis. This formation suggests that the ongoing downtrend may be losing momentum, and a strong bullish breakout could be approaching soon. The narrowing structure of the wedge indicates reduced selling pressure and growing demand as buyers gradually step in. COTI has been consolidating for some time, and this compression phase could soon translate into a sharp upward movement. The volume remains strong, confirming that accumulation is taking place beneath the surface. Once the price breaks out from the upper resistance of the wedge, traders may witness an explosive rally, potentially delivering gains of 50% to 650%+ in the medium term. This kind of setup often attracts both short-term traders and long-term investors looking to capitalize on a high-risk, high-reward opportunity. Investor sentiment around COTI is improving as the broader market shows signs of strength. The combination of bullish technicals, solid trading activity, and renewed interest makes COTIUSDT a promising candidate for a major price breakout. Keep a close watch on the breakout zone, as momentum could accelerate quickly once confirmation arrives. ✅ Show your support by hitting the like button and ✅ Leaving a comment below! (What is You opinion about this Coin) Your feedback and engagement keep me inspired to share more insightful market analysis with you!

CryptoWithJames
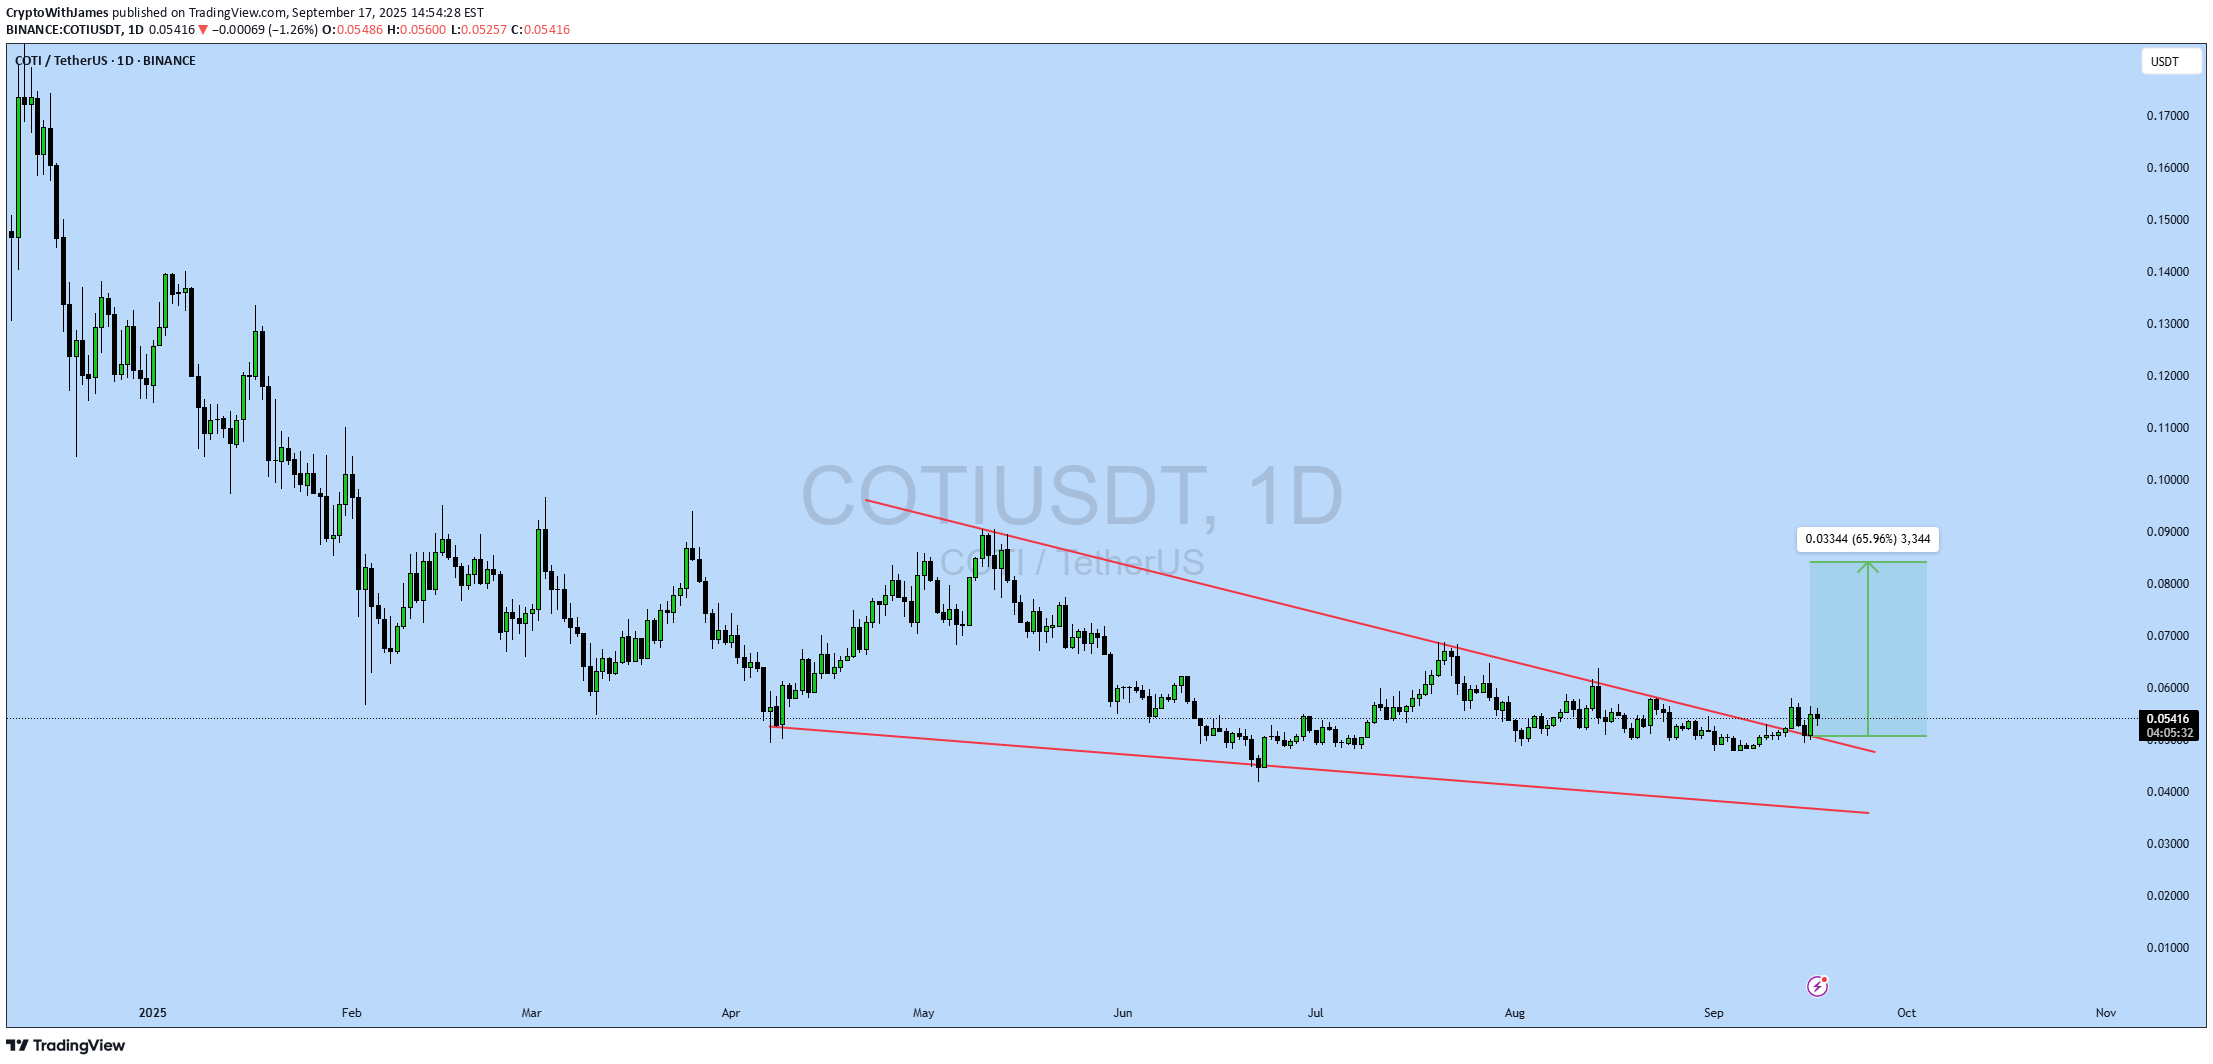
#COTI UPDATE COTI Technical Setup Pattern: Bullish Falling Wedge Pattern Current Price: $0.0541 Target Price: $0.0875 Target % Gain: 65.96% COTI is breaking out of a falling wedge on the 1D timeframe. Current price is $0.0541 with a target near $0.0875, showing almost 66% potential upside. The breakout confirms bullish momentum with structure favoring continuation. Always use proper risk management. Time Frame: 1D Risk Management Tip: Always use proper risk management.

Bithereum_io

#COTI is moving within a symmetrical triangle on the daily chart and is currently facing both the Ichimoku cloud and the triangle resistance. If it breaks out above both, the potential targets are: 🎯 $0.06003 🎯 $0.06563 🎯 $0.07122 🎯 $0.07918 🎯 $0.08932 ⚠️ Always remember to use a tight stop-loss and follow proper risk management.

CryptoAnalystSignal

#COTI The price is moving within a descending channel on the 1-hour frame, adhering well to it, and is heading for a strong breakout and retest. We have a bearish trend on the RSI indicator that is about to be broken and retested, which supports the upward breakout. There is a major support area in green at 0.05325, representing a strong support point. We are heading for consolidation above the 100 moving average. Entry price: 0.05390 First target: 0.05480 Second target: 0.05580 Third target: 0.05670 Don't forget a simple matter: capital management. When you reach the first target, save some money and then change your stop-loss order to an entry order. For inquiries, please leave a comment. Thank you.

chethanlobo11

COTI has been consolidating inside a symmetrical triangle for several months, with lower highs and higher lows squeezing the price action. 🔎 Key Observations Price has now broken out of the triangle resistance with a strong green daily candle. Volume increased significantly on the breakout, confirming buyer participation. RSI (14) is at 55.9, trending upward and above the neutral 50 mark, showing improving momentum. Price is currently trading at $0.0551, above the key breakout zone around $0.052 – $0.053. 📊 Bullish Scenario Holding above $0.052 keeps the breakout valid. First resistance: $0.060 Next resistance: $0.070 (major psychological level). Break and close above $0.070 could open the path toward $0.080 – $0.090. ⚠️ Bearish Scenario If price falls back below $0.052, it may re-enter the triangle range. Key supports: $0.050 – $0.048 $0.045 (triangle base and crucial support) A breakdown below $0.045 would invalidate the bullish setup.

Aviator315

COTI/USDT potential 200%+++ Buy zone $0.04 - $0.06 Targets given on the chart 200% to 300% COTI is a fast and light confidentiality layer on Ethereum. Powered by the breakthrough cryptographic protocol Garbled Circuits and secured by Ethereum, COTI introduces the most advanced and compliant solution for data protection on the public blockchain.In our Buy zone $0.04 - $0.06

erbil1299

I am waiting for a beautiful rise supported with the downloads of trend frustration.

evasivesteering

COTI has just broken the resistance trendline being formed begining of 2025. Long set-up is as in chart. Disclaimer: This analysis is based on my personnal views and is not a financial advice. Risk is under your control.

ceciliones
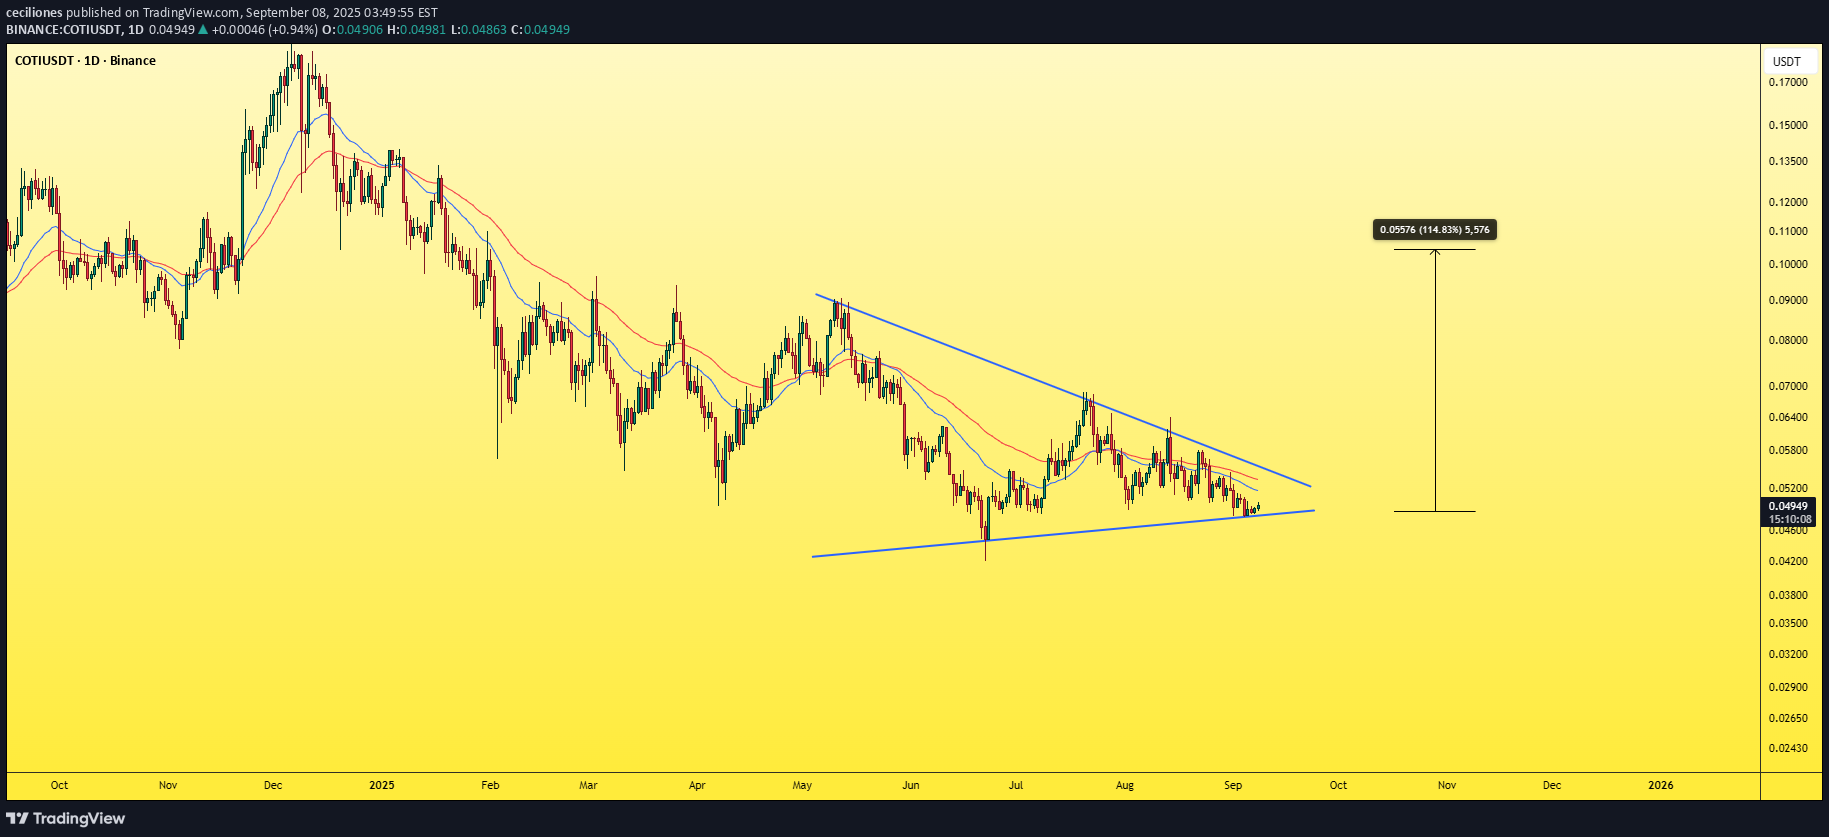
Many coins have already reached bottom levels, and one of the strongest among them is COTI. It has formed a symmetrical triangle pattern and is now sitting at one of its lowest levels, which is a strong support zone — buying here is almost like getting it at “nothing.” COTI is currently gearing up for a historical rally expected to take place in Q4 2025. Best Regards: Ceciliones🎯
Disclaimer
Any content and materials included in Sahmeto's website and official communication channels are a compilation of personal opinions and analyses and are not binding. They do not constitute any recommendation for buying, selling, entering or exiting the stock market and cryptocurrency market. Also, all news and analyses included in the website and channels are merely republished information from official and unofficial domestic and foreign sources, and it is obvious that users of the said content are responsible for following up and ensuring the authenticity and accuracy of the materials. Therefore, while disclaiming responsibility, it is declared that the responsibility for any decision-making, action, and potential profit and loss in the capital market and cryptocurrency market lies with the trader.