
CKB
Nervos Network
| تریدر | نوع سیگنال | حد سود/ضرر | زمان انتشار | مشاهده پیام |
|---|---|---|---|---|
No results found. | ||||
Price Chart of Nervos Network
سود 3 Months :
سیگنالهای Nervos Network
Filter
Sort messages by
Trader Type
Time Frame

Bithereum_io
تحلیل تکنیکال CKB: زمان خرید در کف کانال نزولی و اهداف صعودی انفجاری!
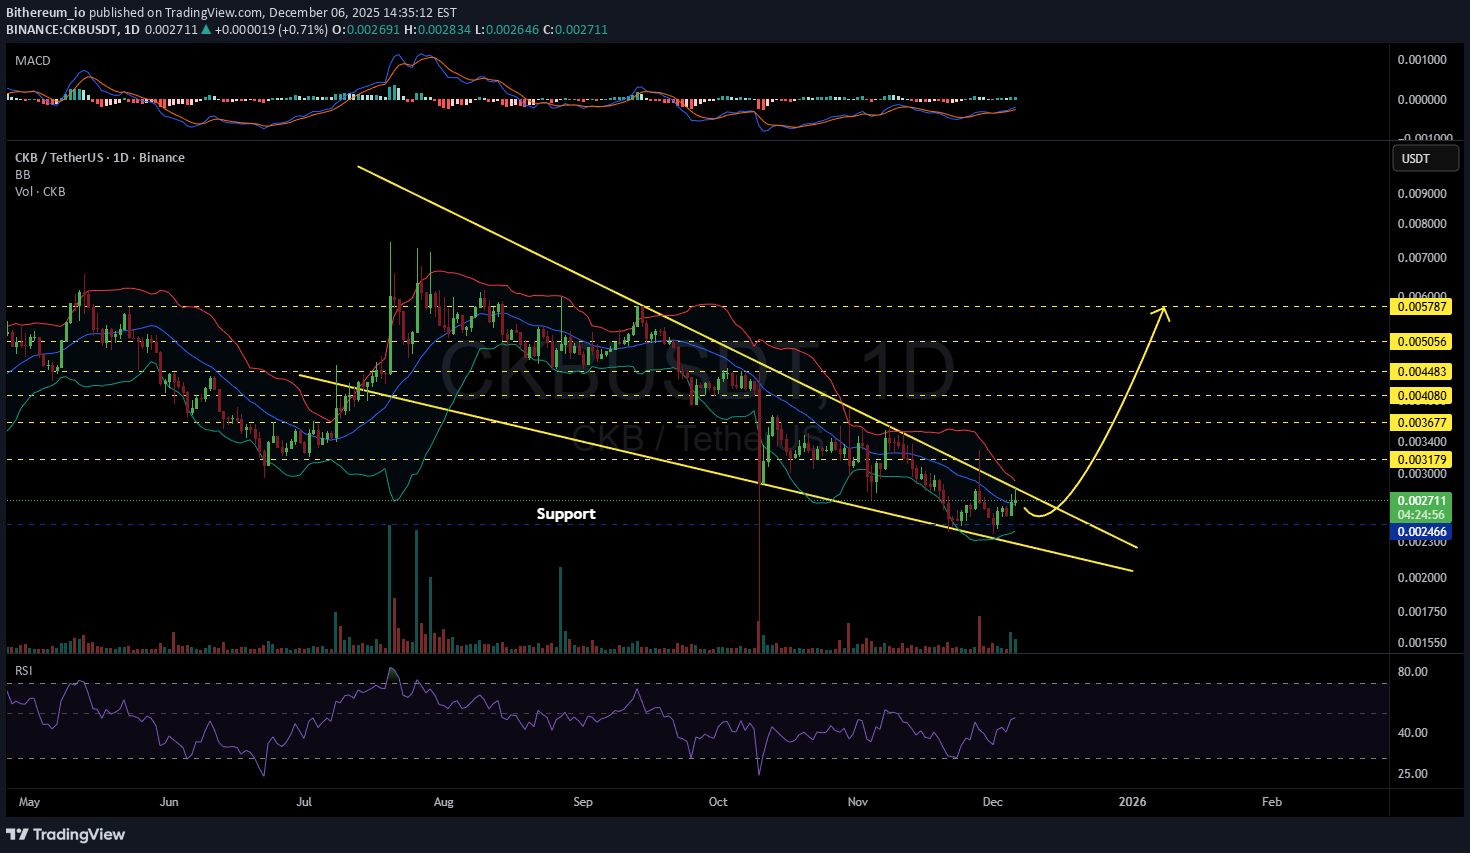
#CKB is moving inside a falling wedge pattern on the daily chart. Consider buying a small bag here and another near the support level at $0.002466. In case of a breakout above the wedge resistance, the potential targets are: 🎯 $0.003179 🎯 $0.003677 🎯 $0.004080 🎯 $0.004483 🎯 $0.005056 🎯 $0.005787 ❌ Invalidation: a daily candle closing below the wedge. ⚠️ Always remember to use a tight stop-loss and maintain proper risk management.

asilturk
تحلیل فنی CKB: آماده جهش بزرگ با افزایش حجم معاملات!
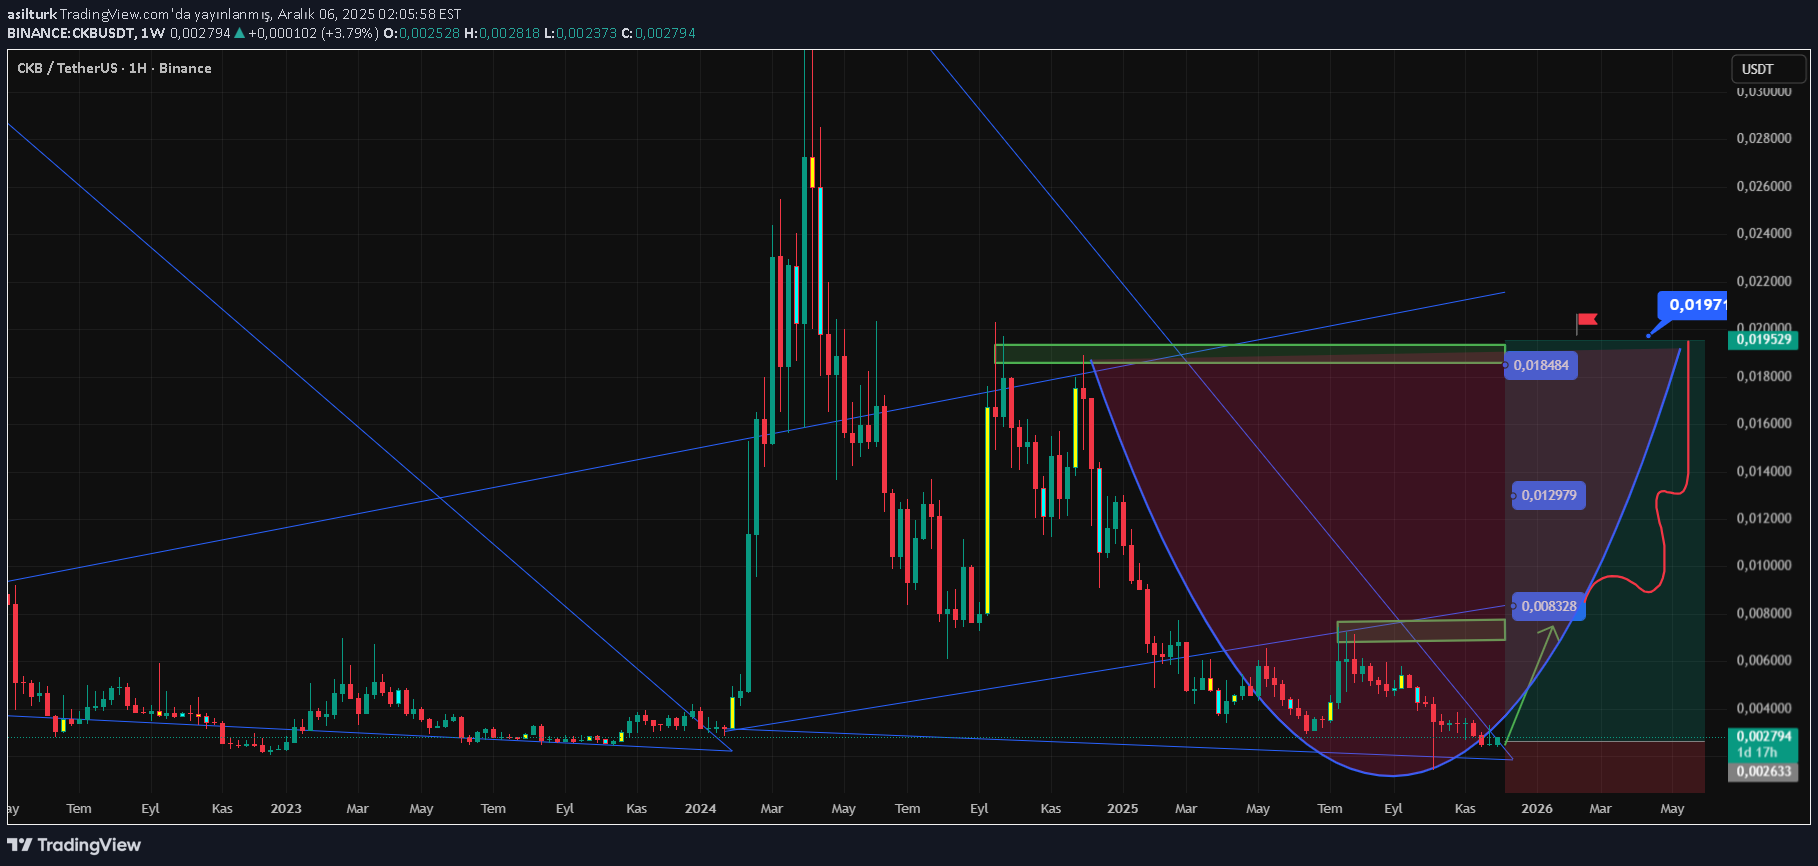
Another crypto we will add to the portfolio is CKB Nervos Network, 136M$ market value, 0.0044% dominance weight, unlimited supply and CKB 0.002780$ price band. : CKB is a blok chain with a two-tier architecture that prioritizes security without sacrificing scalability. The CKB token acts as a digital property that provides the right to store data on the network. However, what the chart says is important to us. The volume is not yet sufficient. Currently, there is a transaction volume of $12 Million for CKB. However, we observe that technical indicators are changing direction and moving towards the positive region. With a serious volume increase, serious price movement and new price targets can be tested. We can say that the CKB (nervos) BTC comparative chart is healthier than the USD chart. I wish you good luck.

TradingNomadic
CKB (Nervos Network): تحلیل هیجانانگیز نمودار؛ آیا منتظر رشد 100 درصدی هستیم؟
Real nice Bullish Dragon here with a Right angled and descending broadening formation as a base. Pattern target would be a 100% measured move of the range

CryptoAnalystSignal
CKB/USDT: آیا منطقه دفاعی آخر قبل از صعود بزرگ فرا رسیده است؟
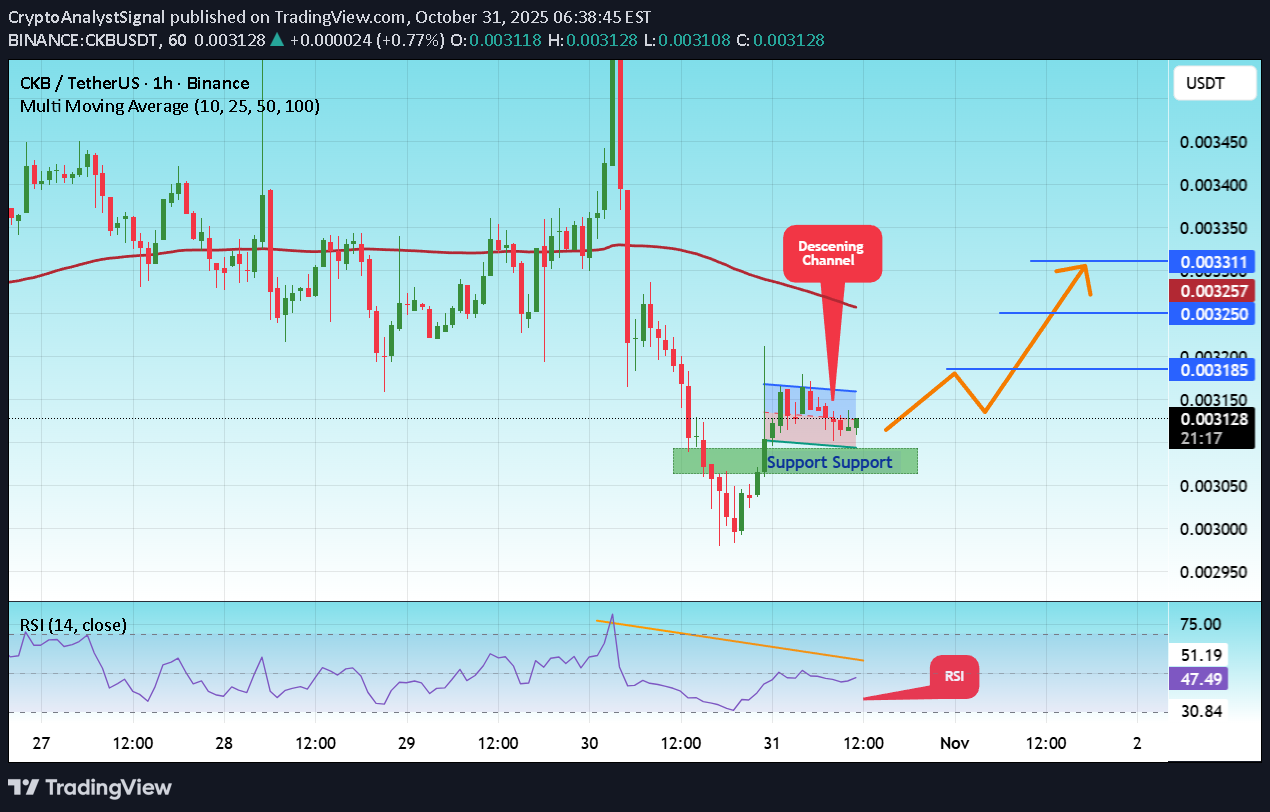
#CKB The price is moving in a descending channel on the 1-hour timeframe and is expected to break out and continue upwards. We have a trend to stabilize above the 100-period moving average again. We have a downtrend on the RSI indicator, which supports an upward move if it breaks above it. We have a key support zone in green that pushed the price higher at 0.003070. Entry price: 0.003120 First target: 0.003148 Second target: 0.003250 Third target: 0.003311 For risk management, don't forget stop-loss orders and capital management. The stop-loss is below the support zone in green. Upon reaching the first target, take some profits and then change the stop-loss order to an entry order. For any questions, please comment. Thank you.#CKB First target: 0.003148 Reached Second target: 0.003250 Reached Third target: 0.003311 Reached

CryptoNuclear
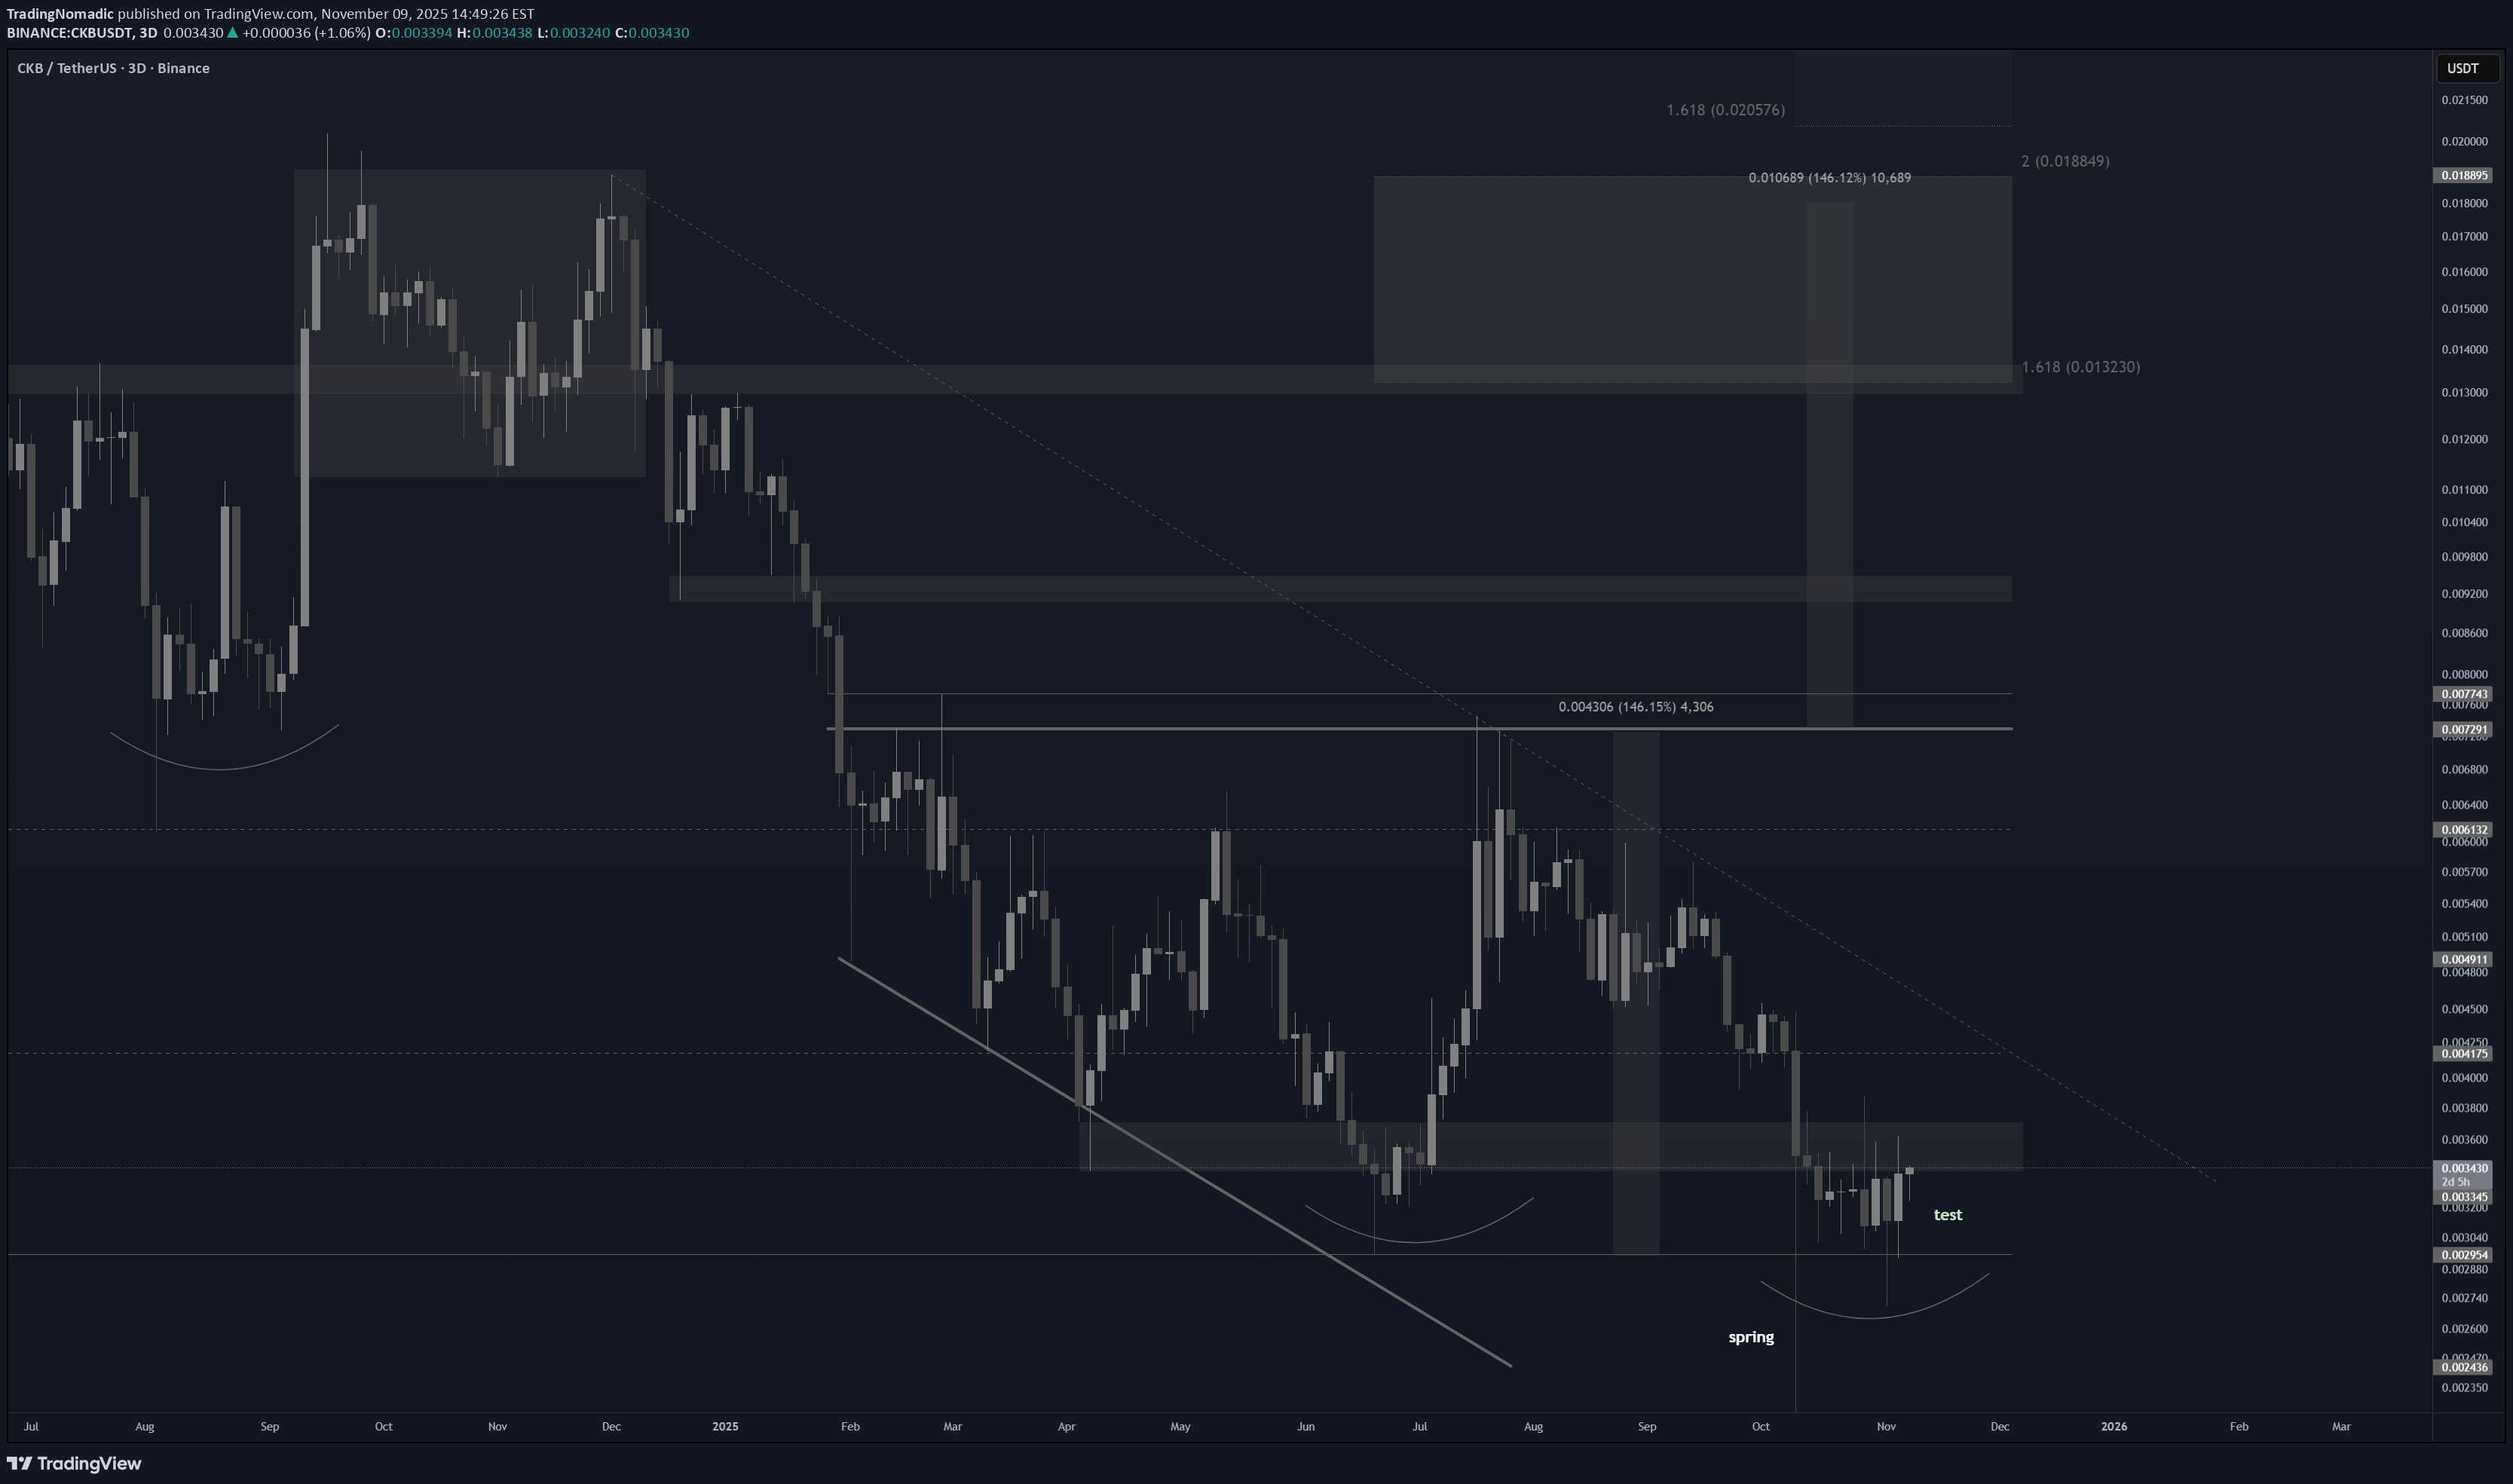
نقطه عطف سرنوشتساز CKB: آیا این آخرین دفاع قبل از جهش بزرگ است؟
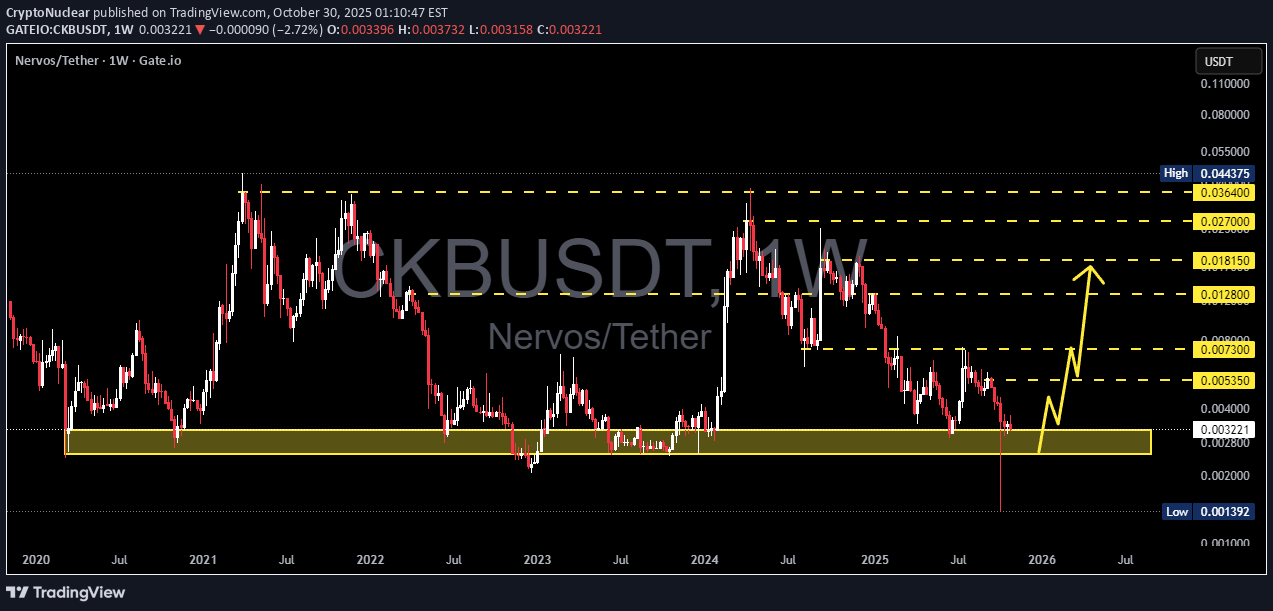
CKB is currently standing on its last line of defense, the historical support zone between 0.0032–0.0025, which has served as the foundation of every major reversal since 2020. For over three years, this yellow block has acted as the core accumulation zone where long-term buyers consistently regained control — marking the start of every significant rally that followed. This time, the setup looks even more intriguing: the latest weekly candle printed a deep liquidity sweep below support, followed by a strong recovery and close back above 0.0032 — a clear sign of absorption and potential smart money accumulation. The next move from this zone could define the direction of CKB’s macro trend — whether this becomes the start of a massive re-accumulation phase, or a breakdown toward the 0.00139 historical low. --- 📈 Bullish Scenario: Weekly candle holds and closes above 0.0032, confirming demand strength. A decisive breakout above 0.00535 would signal a trend reversal and invite momentum buyers. Next resistances and upside targets sit at 0.0073 → 0.0128 → 0.0181 → 0.0270 → 0.0364. As long as the 0.0025 floor holds, CKB has a strong chance of forming a macro higher low, potentially igniting a major impulse move upward. --- 📉 Bearish Scenario: A weekly close below 0.0025 would confirm a structural breakdown. This would likely lead to a drop toward the 0.00139 historical low zone. Failed retest near 0.0028–0.0032 after the breakdown would strengthen the bearish continuation setup. --- 📊 Technical Structure & Pattern: Macro pattern: Long-Term Accumulation Range Current price sits at the bottom of the macro range, a zone that historically triggers reversals. The deep wick below support followed by a quick recovery resembles a “Spring Phase” in Wyckoff Accumulation, often signaling the end of seller control and the start of buyer dominance. --- 🎯 Summary: CKB is entering a make-or-break zone that could shape its direction for the next several months. A sustained bounce from here could mark the beginning of a major trend reversal, while a confirmed breakdown would open the path to uncharted lows not seen since 2020. The coming weeks will be crucial in defining CKB’s next macro move — stay alert, watch for confirmation, and manage risk with precision. --- #CKB #Nervos #CKBUSDT #CryptoAnalysis #TechnicalAnalysis #Wyckoff #SupportAndResistance #CryptoBreakout #SwingTrading #CryptoMarket #MarketStructure #WeeklyChart #SmartMoney
Bithereum_io
تحلیل تکنیکال CKB: آیا پامپ بزرگ در راه است؟ نقاط مقاومت کلیدی برای ورود

#CKB is moving inside a descending channel on the 3-day timeframe chart and is currently holding above the support zone. In case of a bounce and breakout above the channel resistance, the potential targets are: 🎯 $0.004782 🎯 $0.006410 🎯 $0.008548 🎯 $0.010276 🎯 $0.012004 🎯 $0.014464 🎯 $0.017598 ⚠️ Always remember to use a tight stop-loss and maintain proper risk management.
CryptoNuclear
CKBUSDT — Test Demand Zone: Reversal or Deeper Breakdown?
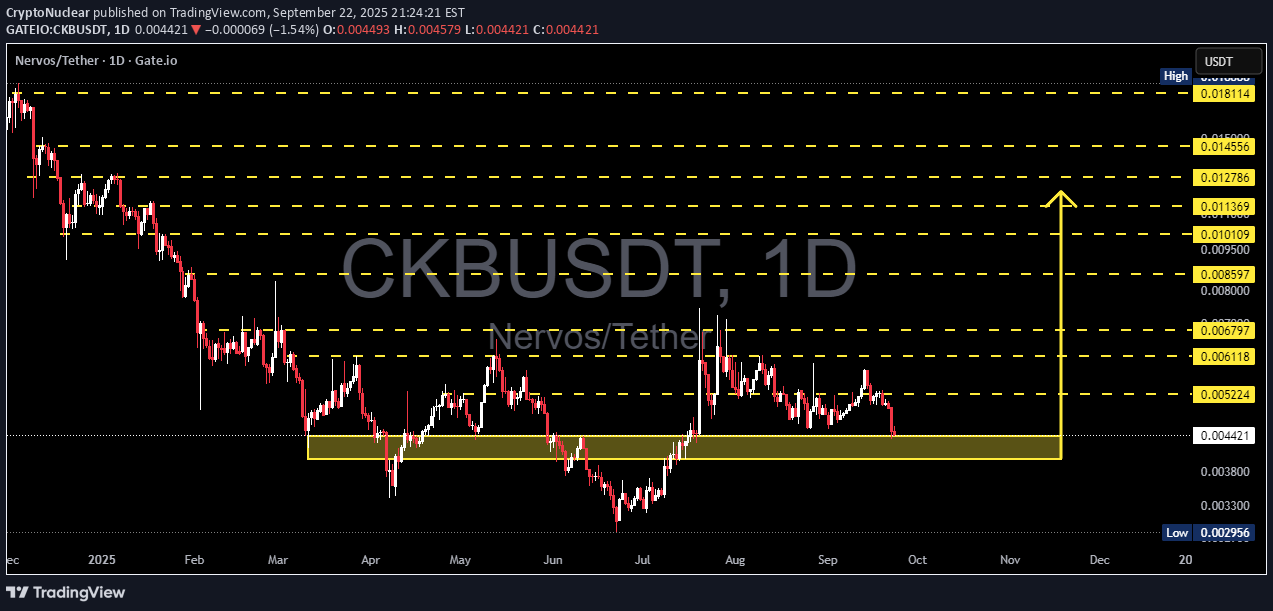
📝 Full Analysis The Nervos (CKB/USDT) pair is now trading right inside a critical demand zone at 0.0038 – 0.0046. This area has repeatedly acted as a last line of defense against deeper declines. At this stage, the market is at a decision point: will this zone trigger another accumulation bounce, or will it finally give way to a stronger bearish continuation? --- 🔎 Price Structure & Pattern 1. Macro Trend Since early 2025, CKB has remained in a major downtrend, printing consecutive lower highs and lower lows. Every bullish attempt has been capped around key resistance clusters (yellow dashed lines). 2. Demand Zone (Yellow Box) The 0.0038 – 0.0046 range has served as a strong base support. Historically, buyers have stepped in whenever price dipped into this zone. 3. Key Resistance Levels (Upside Targets) 0.005224 → first minor resistance, key for early confirmation. 0.006118 → short-term target. 0.006797 → stronger psychological barrier. 0.008597 – 0.010109 → mid-term supply zone. 0.011369 – 0.018114 → long-term bullish targets if a major reversal takes place. 4. Key Support Levels (Downside Risks) 0.0038 → bottom of the demand zone. 0.002956 → previous major low. A breakdown below this low could trigger a deeper bearish phase, exposing historical supports seen only on higher timeframes. --- 🚀 Bullish Scenario Scenario A: Initial Bounce If price holds above 0.0040–0.0044 and forms bullish reversal patterns (engulfing, hammer, or long-tail pinbar) with high volume, buyers may attempt a rebound. Scenario B: Breakout Confirmation A daily close above 0.005224 would shift the short-term structure bullish, paving the way toward 0.006118 – 0.006797. Scenario C: Extended Rally With strong momentum and volume, mid-term targets at 0.008597 – 0.0101 could be tested, which will act as a major test for a long-term reversal. --- ⚠️ Bearish Scenario Scenario A: Breakdown of Demand A daily close below 0.0038 invalidates the demand zone, signaling strong bearish continuation. Scenario B: Downside Targets The first target would be 0.002956 (previous low). A breakdown there could expose deeper historical supports below 0.0025. Scenario C: Bull Trap / False Bounce If price bounces off 0.0044 but fails to break above 0.005224 and reverses downward, it signals distribution and usually leads to an aggressive sell-off. --- 📊 Trading Plan (Example, Not Financial Advice) Aggressive Strategy (Buy the Dip): Entry near 0.0044, stop-loss below 0.0038. Risk: ~14% Target 1: 0.005224 (+17%) Target 2: 0.006118 (+37%) RR Ratio to Target 2 ≈ 2.6 Conservative Strategy (Wait for Breakout): Entry after a daily close >0.005224 with valid retest. Lower risk of false signal. Targets extend toward 0.0068 and 0.0085. Invalidation: All bullish bias is canceled if daily closes <0.0038. --- 🎯 Conclusion At this stage, the 0.0038 – 0.0046 demand zone is the last stronghold for CKB. If it holds, a rebound toward 0.0061–0.0068 is likely. If it breaks, the market could quickly revisit 0.002956 or even lower. In short, the price action in this zone will determine CKB’s mid-to-long term direction. Traders should closely watch volume and candlestick formations in the coming days to gauge whether buyers or sellers take control. --- #CKB #CKBUSDT #Nervos #CryptoAnalysis #PriceAction #CryptoTA #SupportResistance #Altcoin #Breakout
HTSCM
BUY. CKB. NOW
0.2 is coming now As my post from 2023 states 0.19-20 is the final target This year it will happen All the math finally adds up

fghareeb
CKB 0.05 THIS YEAR?
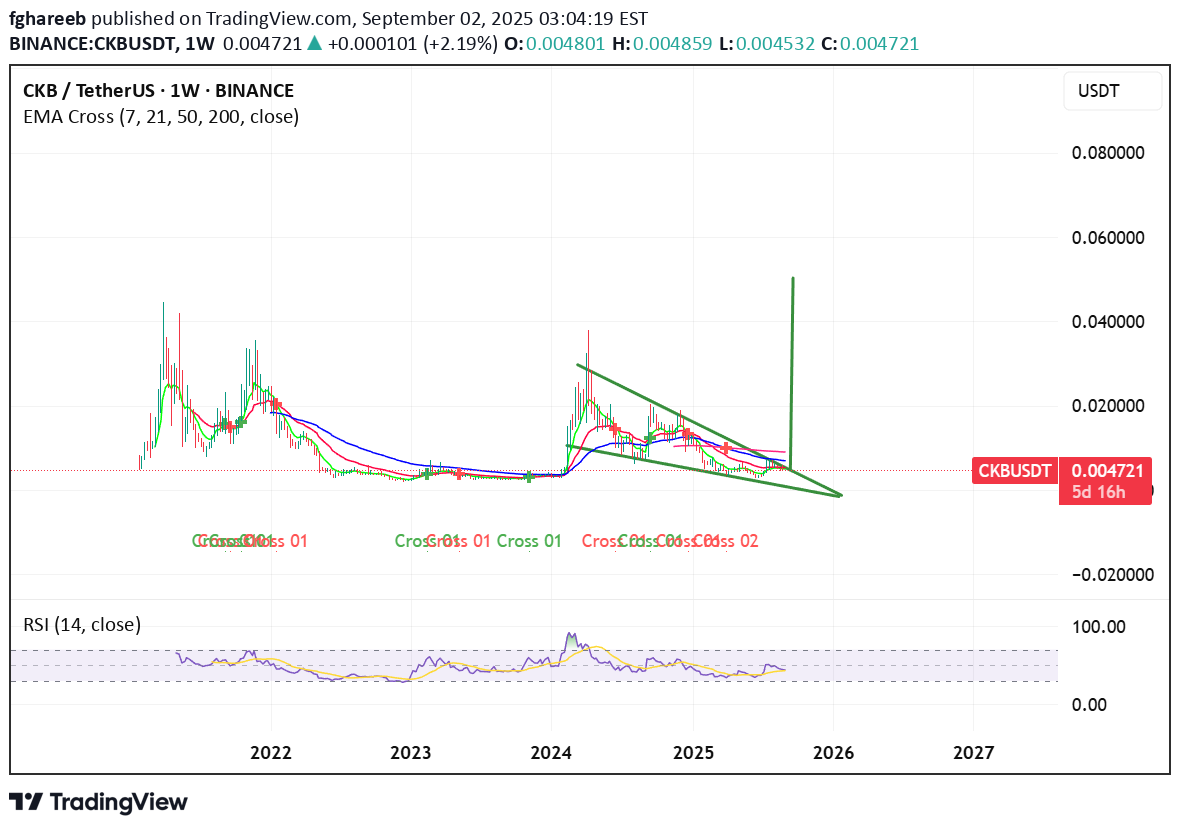
if we had 3 rate cuts this year instead of 2 CKB making new all time high to 0.045-0.05 is possible by end of the year DYOR
CryptoAnalystSignal
#CKB/USDT Still Time to Catch the Move? Some say the move ?
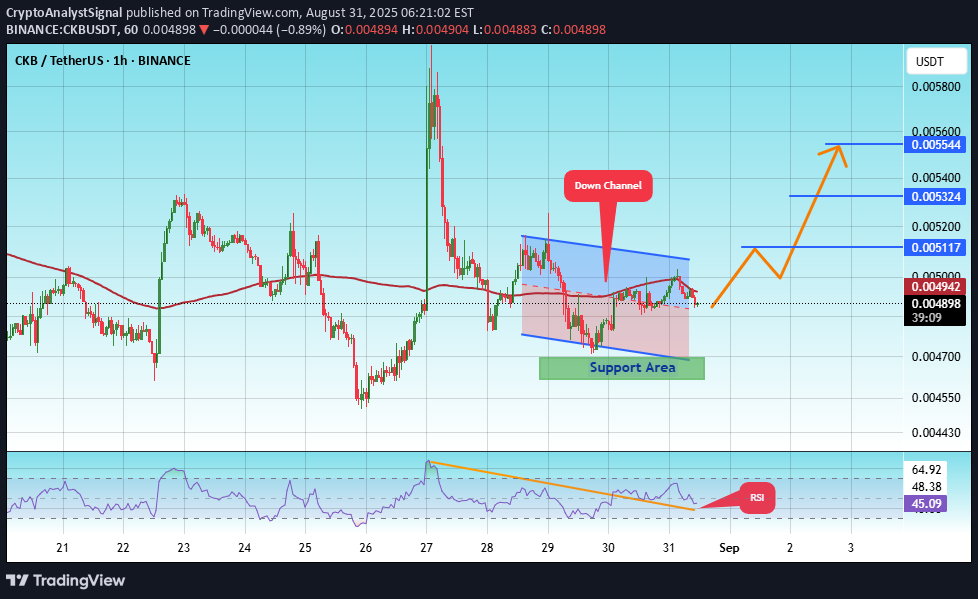
#CKB The price is moving within a descending channel on the 1-hour frame, adhering well to it, and is heading for a strong breakout and retest. We have a bearish trend on the RSI indicator that is about to be broken and retested, supporting the upside. There is a major support area (in green) at 0.004653, which represents a strong basis for the upside. For inquiries, please leave a comment. We are in a consolidation trend above the 100 moving average. Entry price: 0.004891 First target: 0.005117 Second target: 0.005324 Third target: 0.005544 Don't forget a simple matter: capital management. When you reach the first target, save some money and then change your stop-loss order to an entry order. For inquiries, please leave a comment. Thank you.
Disclaimer
Any content and materials included in Sahmeto's website and official communication channels are a compilation of personal opinions and analyses and are not binding. They do not constitute any recommendation for buying, selling, entering or exiting the stock market and cryptocurrency market. Also, all news and analyses included in the website and channels are merely republished information from official and unofficial domestic and foreign sources, and it is obvious that users of the said content are responsible for following up and ensuring the authenticity and accuracy of the materials. Therefore, while disclaiming responsibility, it is declared that the responsibility for any decision-making, action, and potential profit and loss in the capital market and cryptocurrency market lies with the trader.