
CHZ
Chiliz
| تریدر | نوع سیگنال | حد سود/ضرر | زمان انتشار | مشاهده پیام |
|---|---|---|---|---|
 CryptoAnalystSignalRank: 30933 | خرید | حد سود: تعیین نشده حد ضرر: تعیین نشده | 12/17/2025 | |
خرید | حد سود: تعیین نشده حد ضرر: تعیین نشده | 12/12/2025 |

Price Chart of Chiliz
سود 3 Months :
سیگنالهای Chiliz
Filter
Sort messages by
Trader Type
Time Frame

Bithereum_io
CHZUSDT 1D
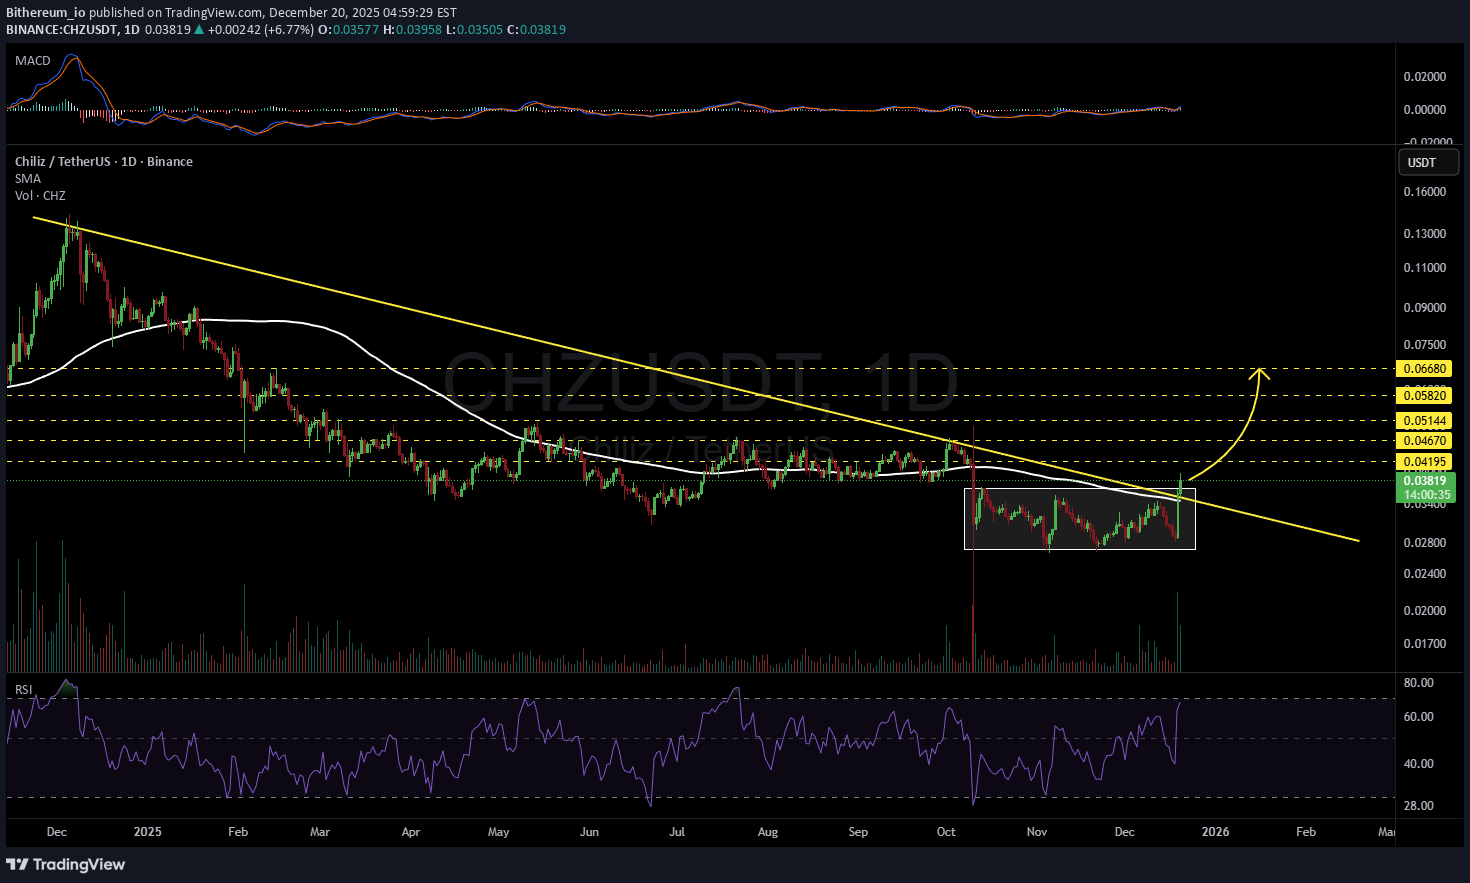
#CHZ has broken above the descending resistance and the daily SMA100 with strong volume. The potential targets are: 🎯 $0.04195 🎯 $0.04670 🎯 $0.05144 🎯 $0.05820 🎯 $0.06680 ⚠️ Always remember to use a tight stop-loss and maintain proper risk management.

behdark
CHZ Is Going To The Moon (3D)
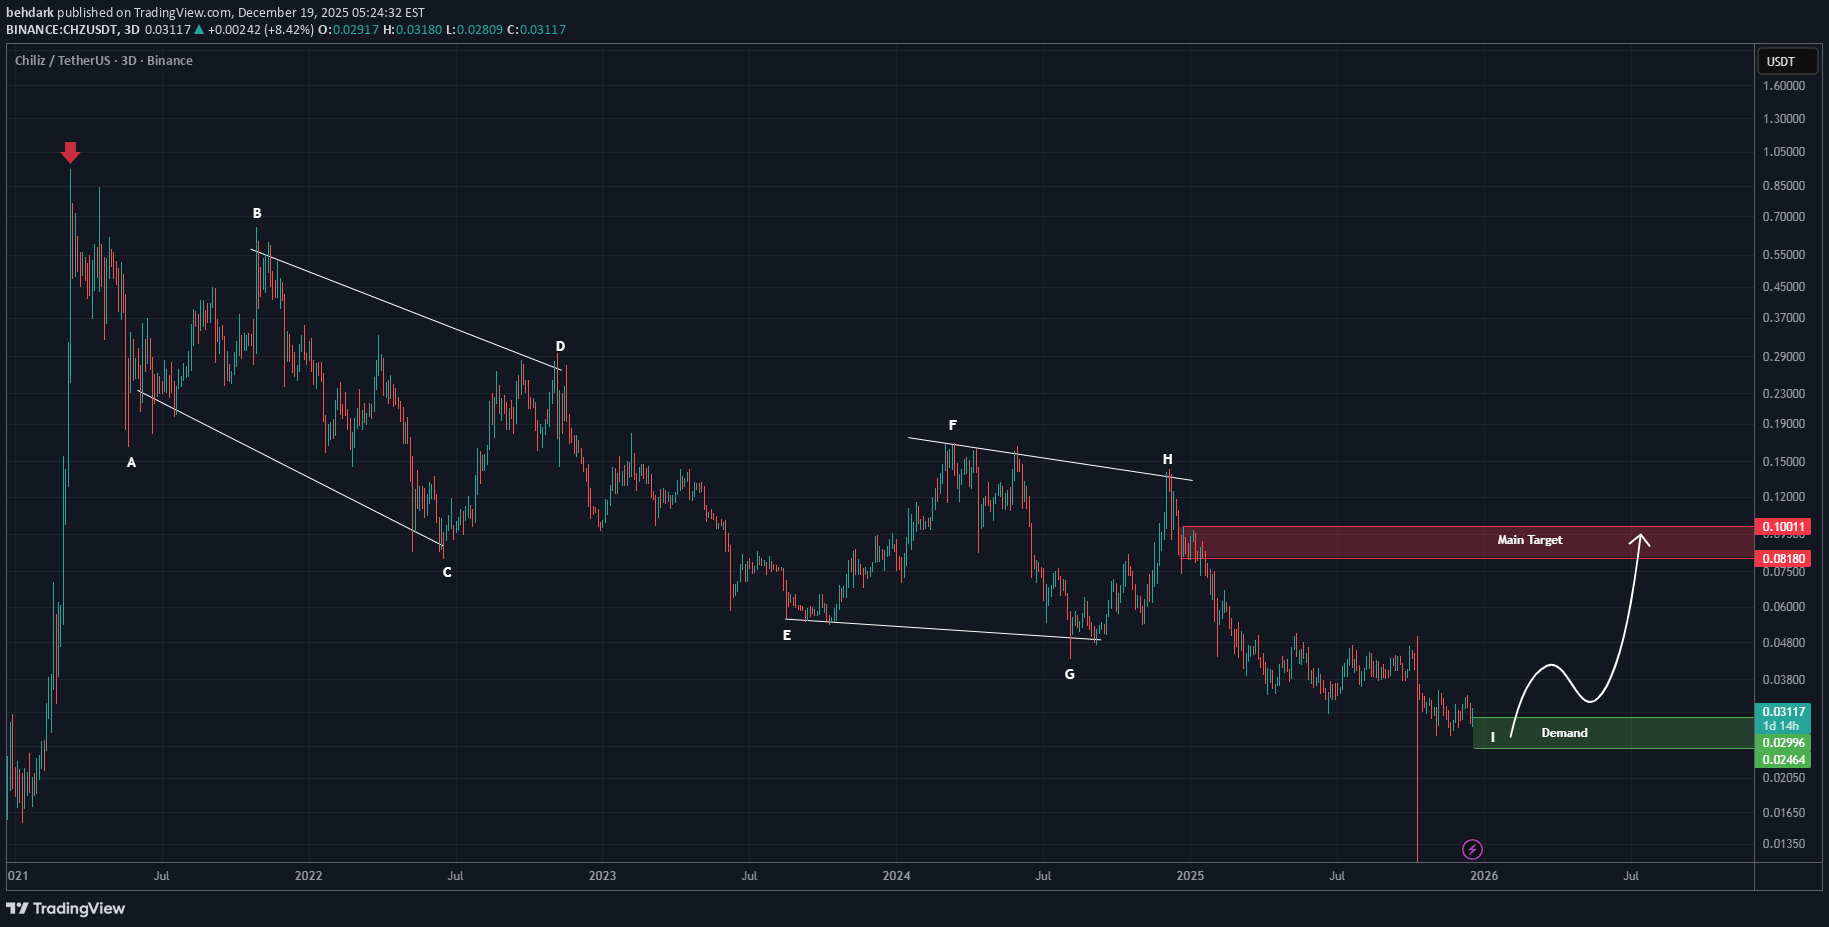
This analysis is an update to the previous one, which you can find in the Related publications section. Before anything, pay attention to the time frame. We have been tracking this coin for months, and the structure remains the same. With the Trump news and the market crash, it formed a long shadow candle, but this hasn’t changed spot trading. This symmetrical pattern has no choice but to complete, and CHZ can easily reach the red box though it may take a few months of patience. This position is only for spot trading, and you can buy from the current price down to the bottom of the green box. For risk management, please don't forget stop loss and capital management When we reach the first target, save some profit and then change the stop to entry Comment if you have any questions Thank You
CryptoAnalystSignal
#CHZ/USDT Reversal Potential Breakout & Fibonacci Retes
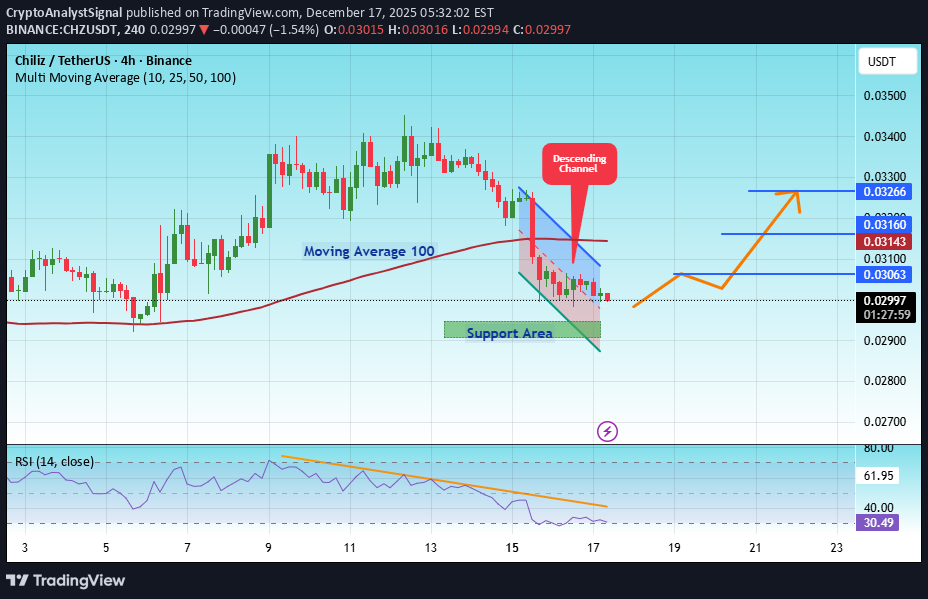
#CHZ The price is moving in a descending channel on the 1-hour timeframe. It has reached the lower boundary and is heading towards breaking above it, with a retest of the upper boundary expected. We have a downtrend on the RSI indicator, which has reached near the lower boundary, and an upward rebound is expected. There is a key support zone in green at 0.02934. The price has bounced from this level multiple times and is expected to bounce again. We have a trend towards consolidation above the 100-period moving average, as we are moving close to it, which supports the upward movement. Entry price: 0.03000 First target: 0.03063 Second target: 0.03160 Third target: 0.03266 Don't forget a simple principle: money management. Place your stop-loss order below the support zone in green. For any questions, please leave a comment. Thank you.
CHZ mid-term TA
Chiliz can be an outperformer on crypto market in the upcoming weeks or months, as of now the volumes on CHZ have accelerated and there's a positive accumulation on weekly time frame as well, it's yet in the early stage of bullish formation but it's something to keep an eye on. Recently they have announced a partnership with Assetera and that could be a price pusher.P.S. There are many other indicators that are being used for this TA, the above snapshot is only an example. Moreover, I've been doing technical analysis for quite some time, and I'm neither bullish nor bearish, I'm a swing trader who likes TA. And as you should know - always make your own choices.The current formation for the uptrend has been declined. Most likely Chilliz is going to test the previous lows again. Now we need to wait and see if the support test succeeds.

asilturk
توکن هواداری CHZ: جذابیت، کاربردها و پیشبینی سودآوری در هفتههای آینده!
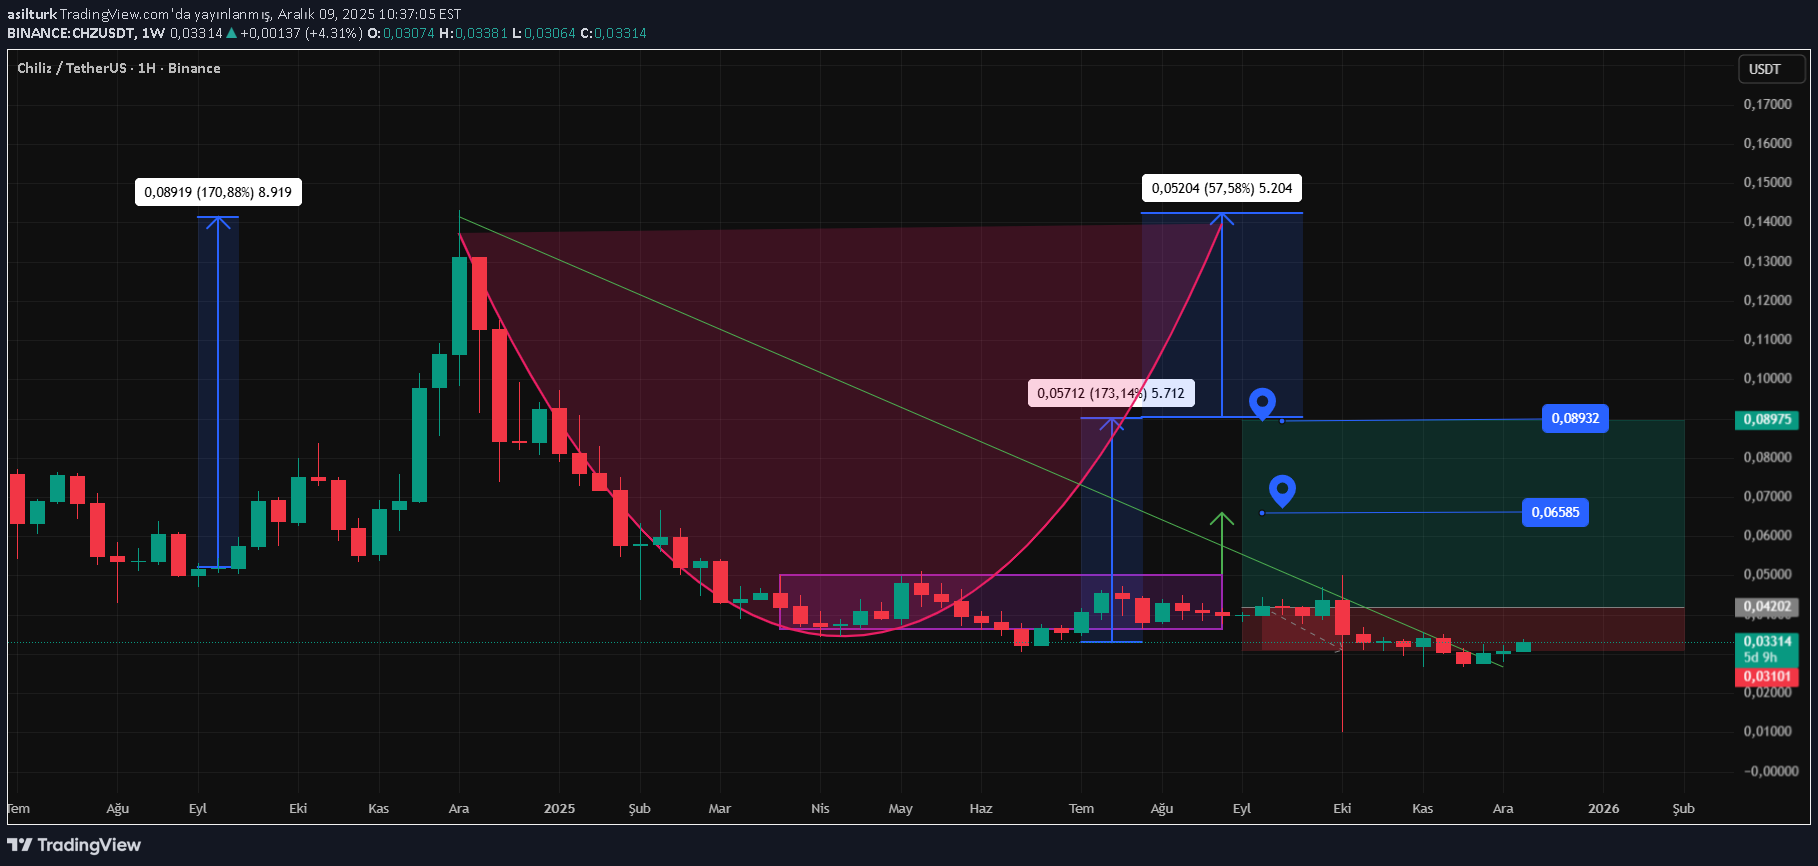
CHZ is a means of purchasing digital assets (Fan Tokens) that allow fans to interact with their favorite sports clubs, vote on minor decisions and receive special benefits. The price is currently 0.33 cents, the volume is 20M$, the technical outlook is positive, we will evaluate it again in the coming weeks. I wish you lots of profit

SaykoCrypto
تحلیل هفتگی CHZ/USDT: کانال موازی و محدوده قیمتی؛ آیا 70% صعود در راه است؟
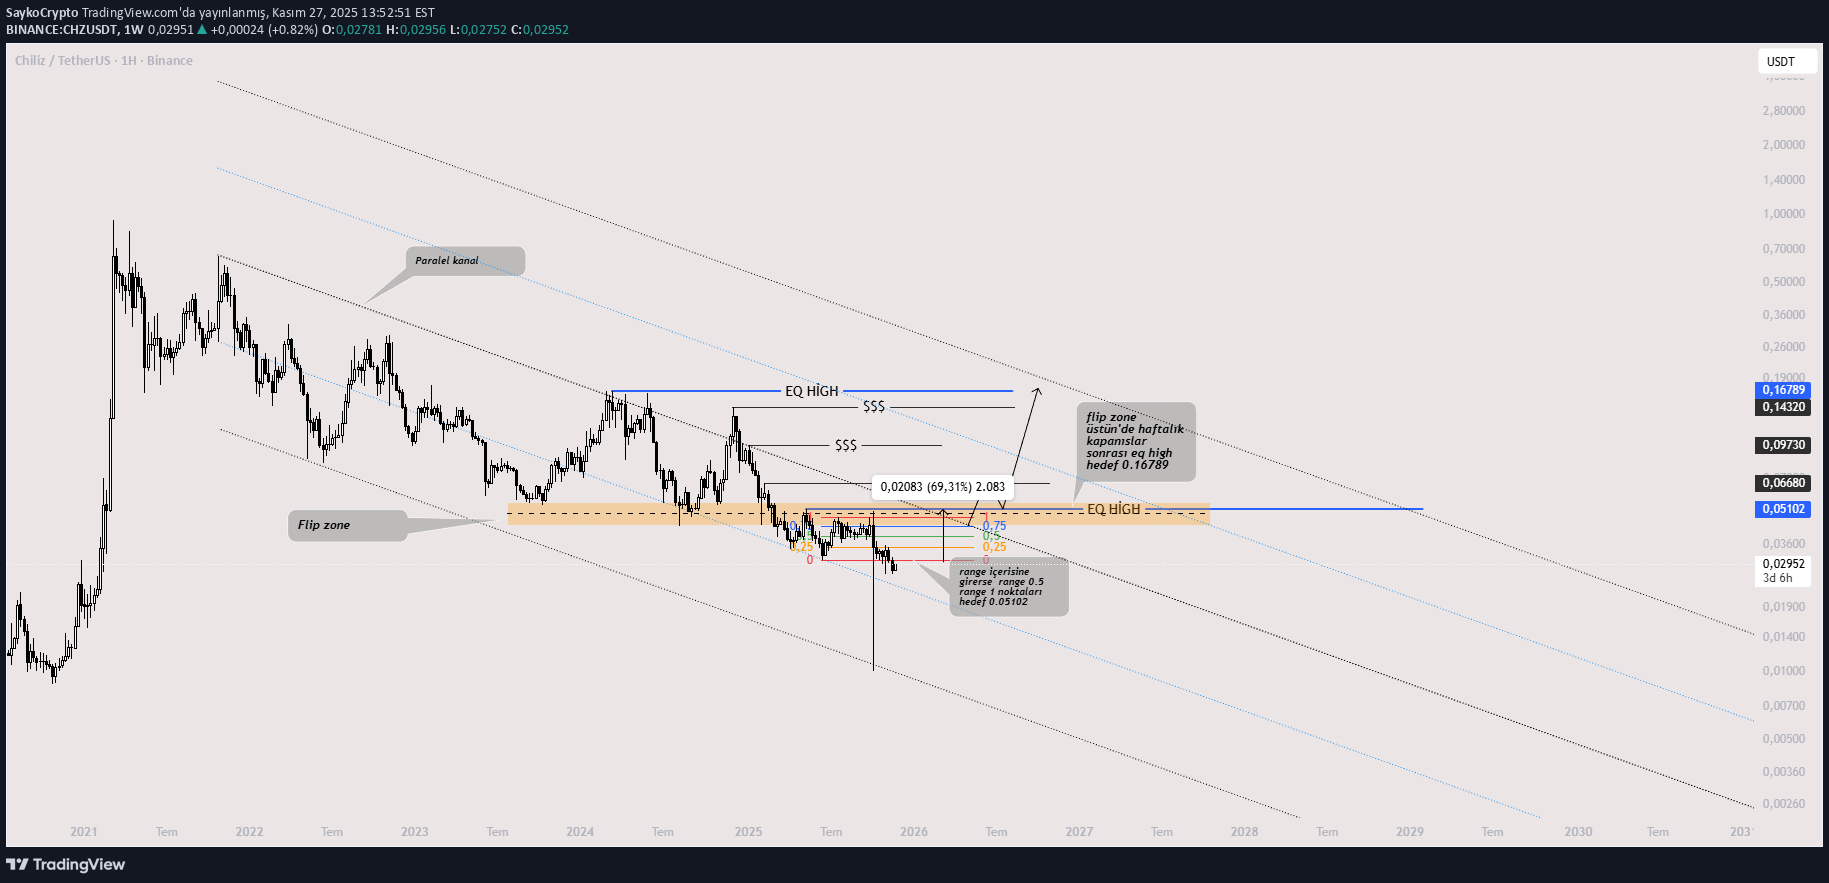
As the price enters the range on the weekly chart, range 0.5 and range 1 points will be the target. New adventures begin after weekly closures above our flipzone region. For now, it promises a 70% increase as it enters the range :) The chart is for tracking purposes only. It does not contain investment advice!!!!

MasDem616
تحلیل تکنیکال CHZUSDT: غافلگیری صعودی با الگوی لیبرا (QML) در تایم فریم 5 ساعته!
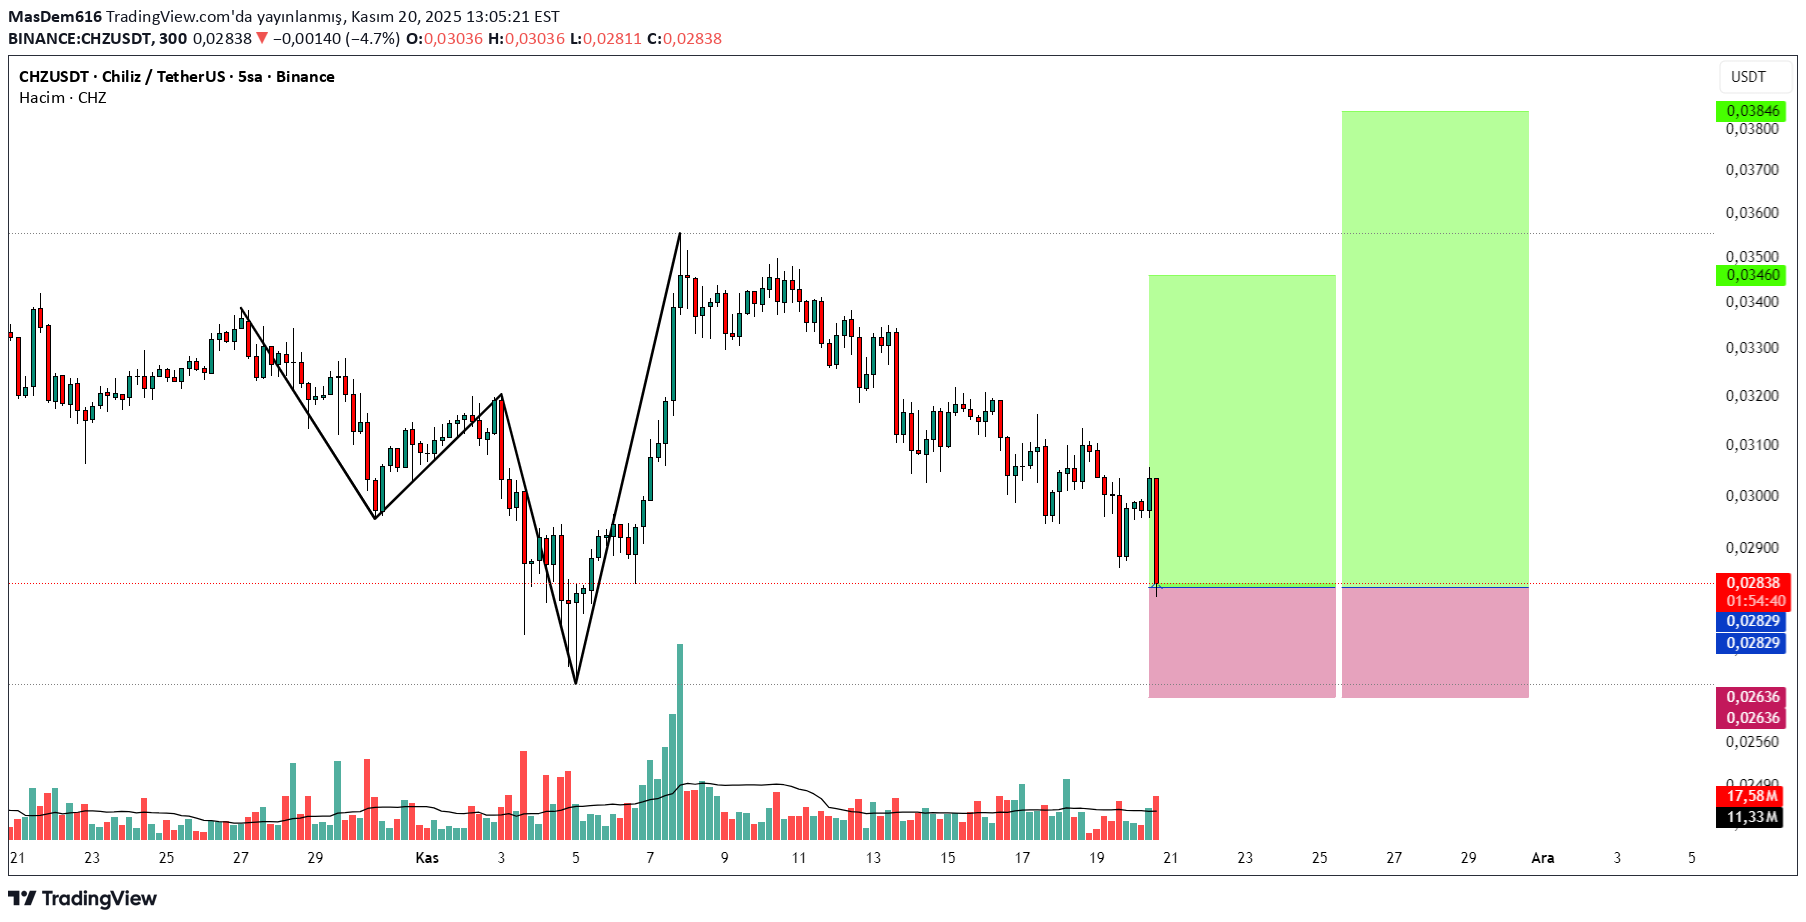
CHZUSDT - 5H Libra (Qml) Formation
behdark
تحلیل تکنیکال CHZ: فرصت خرید با ریسک کم و اهداف جذاب (نمودار 2 ساعته)
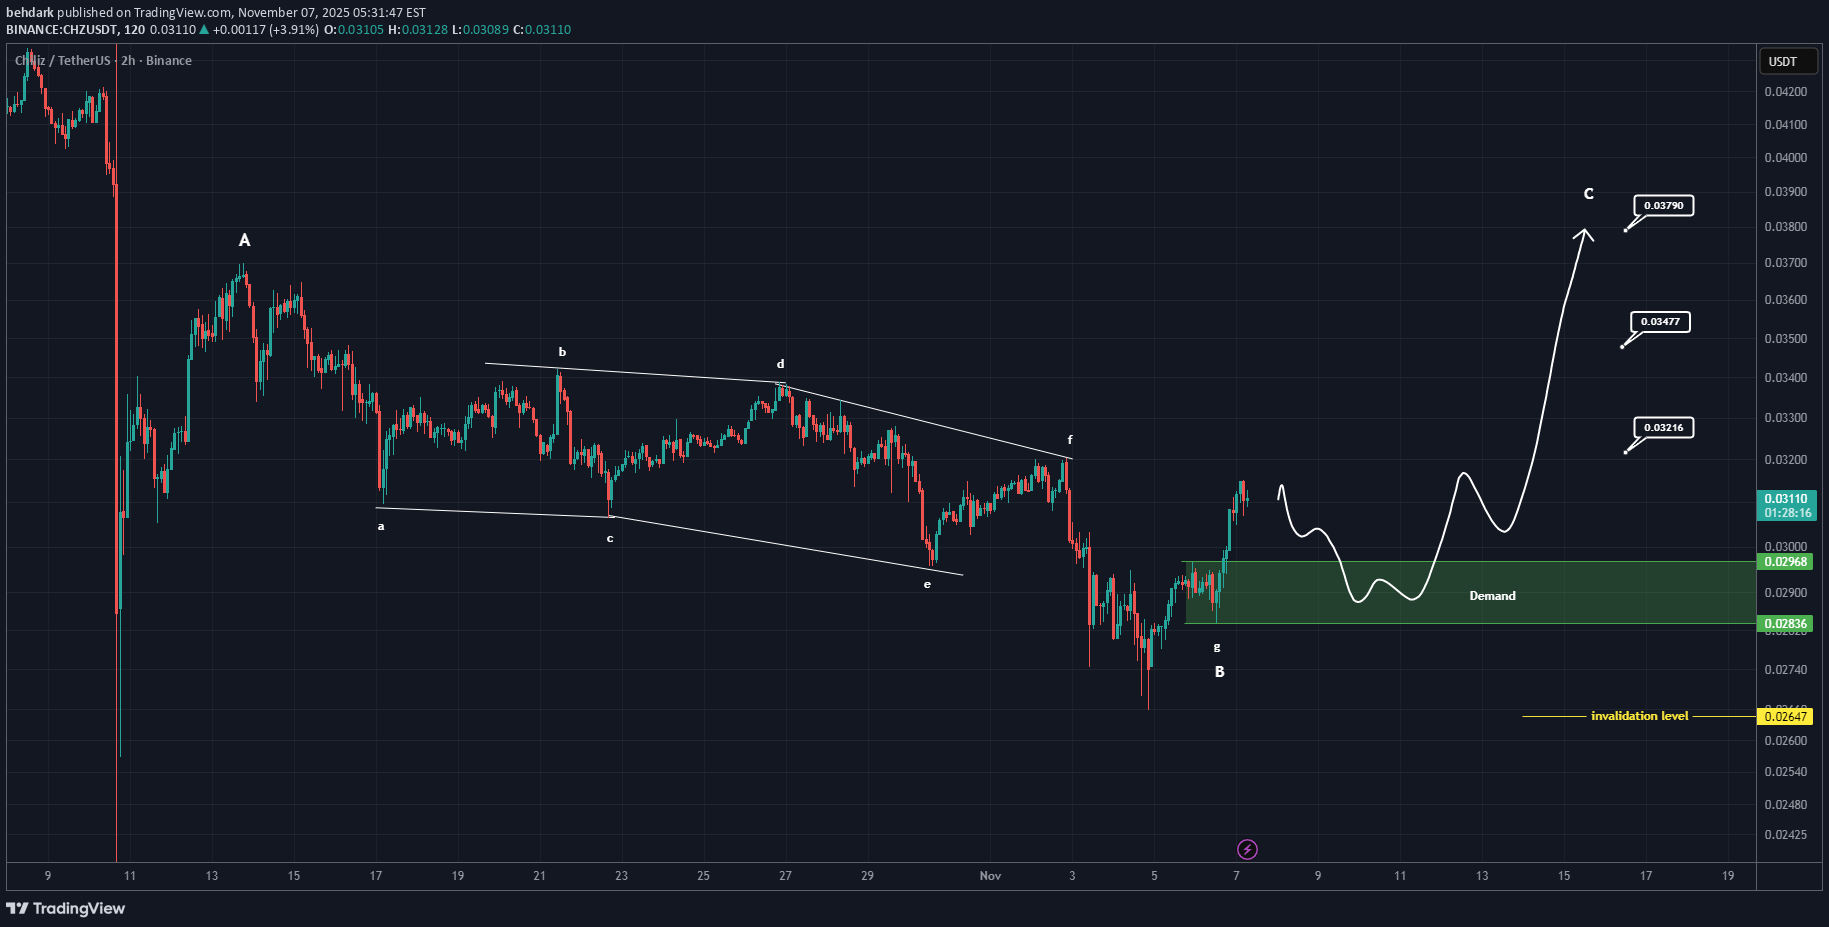
It appears that an ABC pattern has formed on the chart, with wave B being a completed diametric pattern. We are now only looking for an entry opportunity for a buy/long position, with the low-risk zone highlighted in green on the chart. The targets are also marked on the chart. A 4-hour candle closing below the invalidation level will invalidate this analysis. For risk management, please don't forget stop loss and capital management When we reach the first target, save some profit and then change the stop to entry Comment if you have any questions Thank YouIn the end, this setup although it took a while did its job. After our entry, it reached our first target without touching the invalidation level, and pumped more than 10% 🔼 from the upper edge of the green zone. Here is where the importance of choosing the right invalidation level becomes clear!

SARAAH87
تحلیل فوری CHZ: آیا کف قیمتی تشکیل شده؟ نشانههای صعودی قوی!
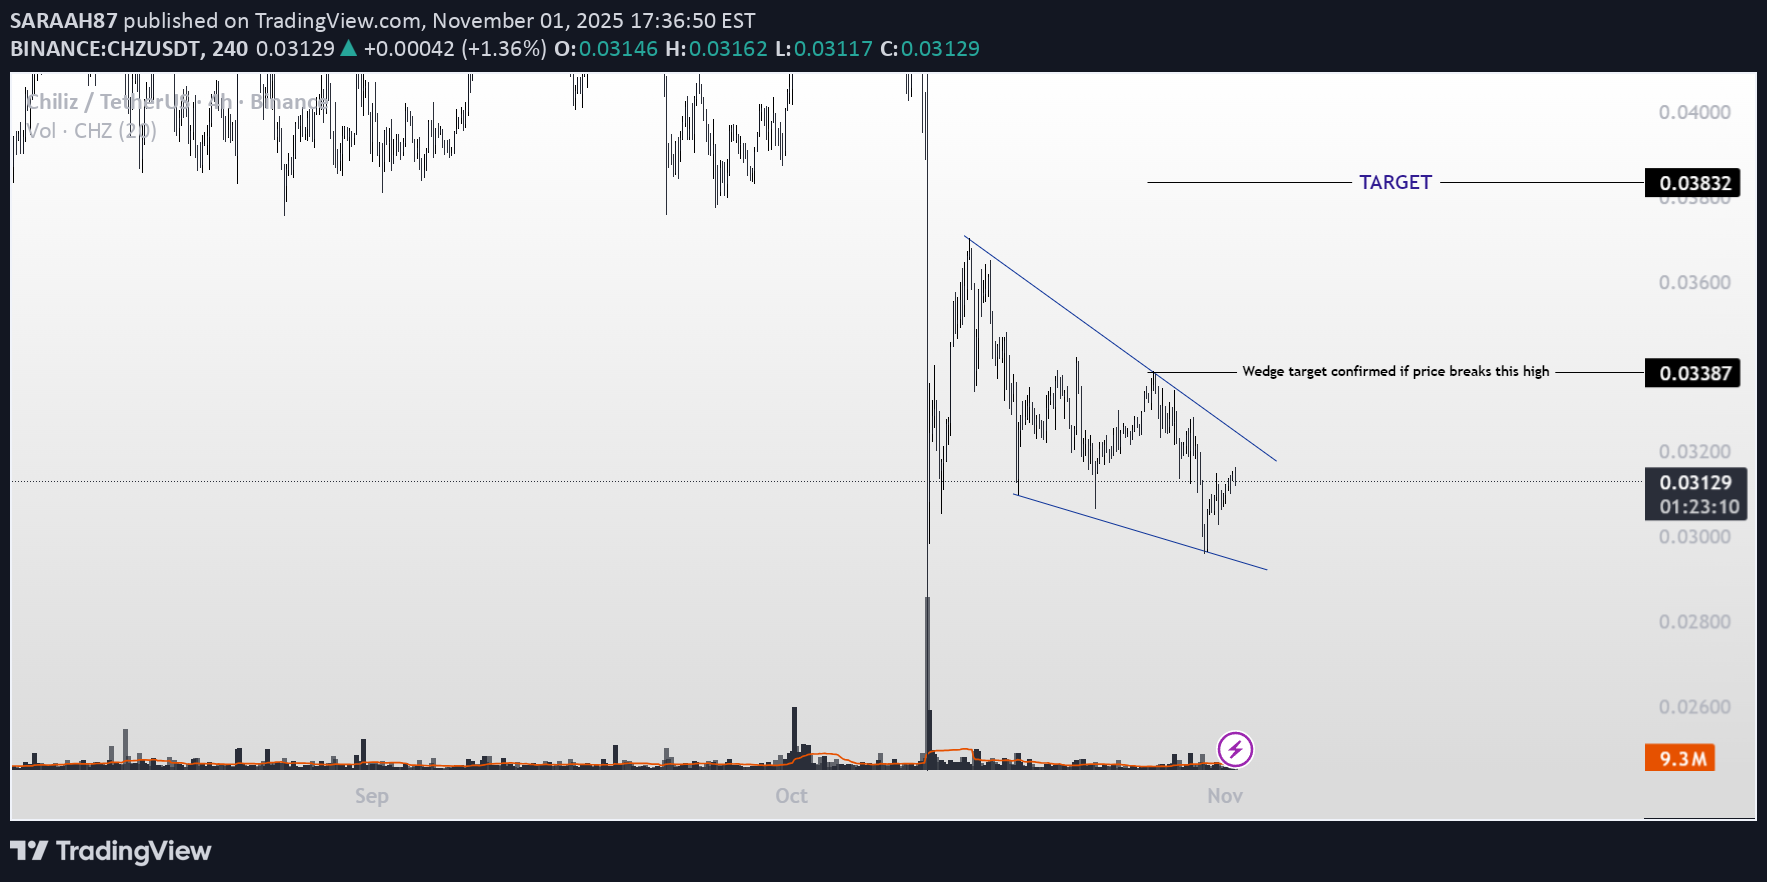
"CHZ: Volume is rising and has reached oversold levels. It’s forming a descending wedge, which is typically followed by a bullish move. The 14-period RSI has broken above its average. A breakout above the previous high would confirm the upward trend. The expected movement in the upcoming period is shown on the chart

crypto_profile
سقوط CHZ ادامه دارد: هشدار مهم و تحلیل جدید بازار!
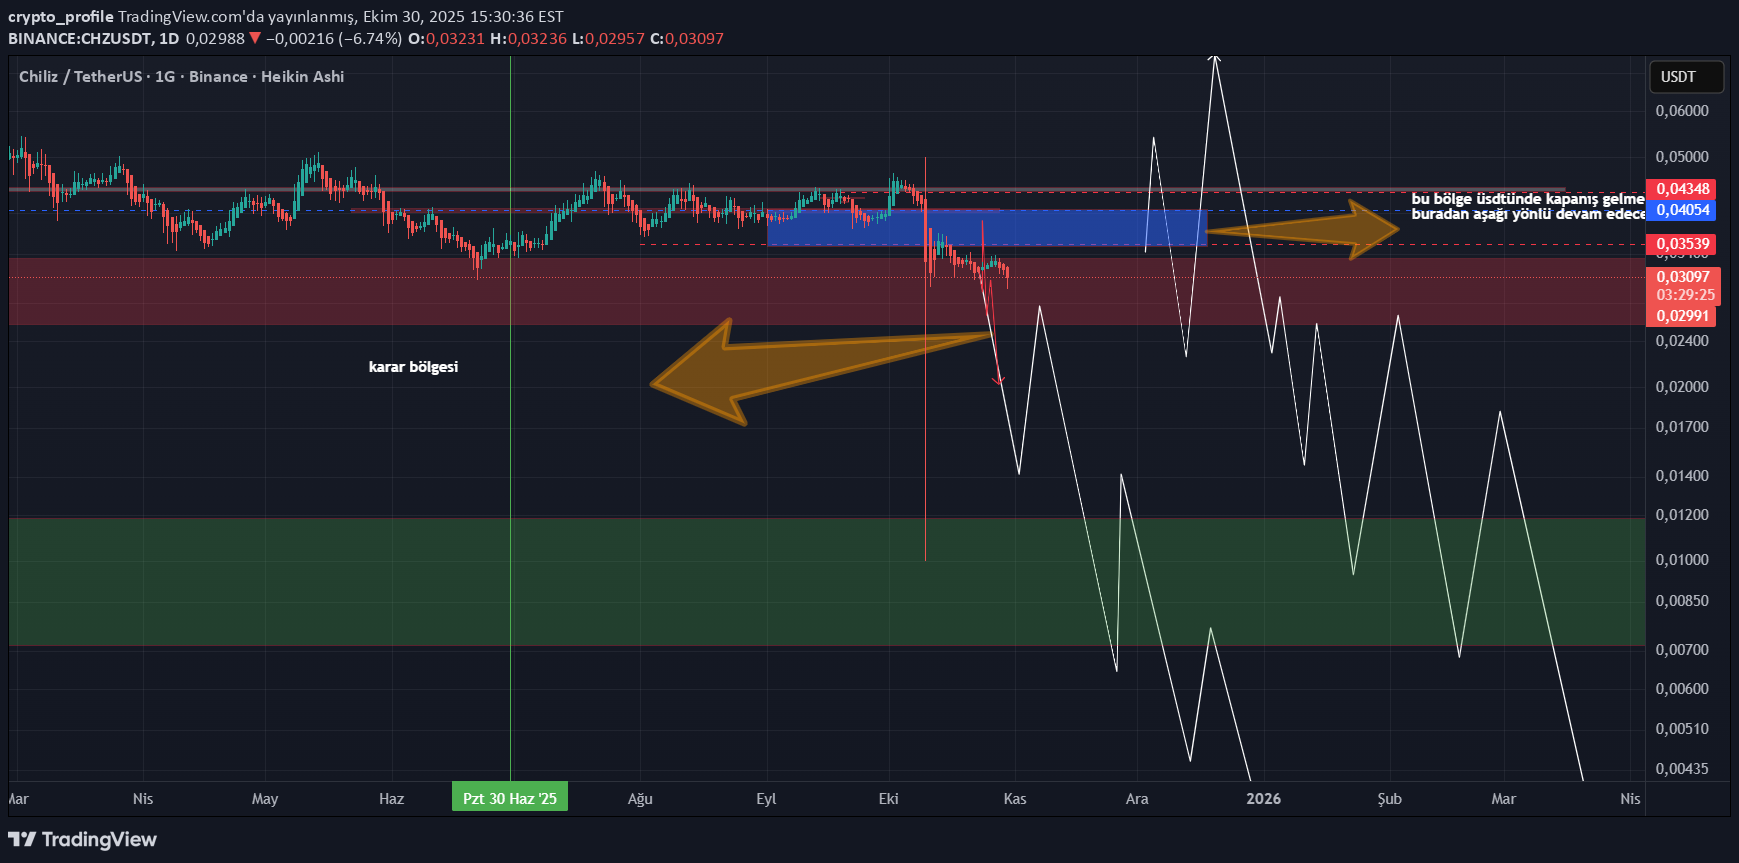
HELLO FRIENDS I won't be around for a while, so I wanted to give you information about this product. First of all, I look for a two-week close on the blue area so that we can call it a rise. I don't expect a rise even if it is a rise, but the next two-week close under the red area will continue the decline at least until the green zone. I am not saying that this area will hold us and the bull will come. This area will also break, but I think that area will linger for a while. The doors of a new decline that will last for a few months are about to open. Short rises give reasonable entry zones for swing shorts. I don't see anything else. If it is a very essential situation, I will share the developments, even if it is on mobile. It is my map, I do not give investment advice and I try to convey to you my objective perspective and safe entry areas. As I always say, logging in late may make me earn a little less, but logging in in the wrong place will melt my balance, so I will continue to wait for the right time. Take care of yourself until we meet again or until you return safely.
Disclaimer
Any content and materials included in Sahmeto's website and official communication channels are a compilation of personal opinions and analyses and are not binding. They do not constitute any recommendation for buying, selling, entering or exiting the stock market and cryptocurrency market. Also, all news and analyses included in the website and channels are merely republished information from official and unofficial domestic and foreign sources, and it is obvious that users of the said content are responsible for following up and ensuring the authenticity and accuracy of the materials. Therefore, while disclaiming responsibility, it is declared that the responsibility for any decision-making, action, and potential profit and loss in the capital market and cryptocurrency market lies with the trader.