
MoxGo_Analytics
@t_MoxGo_Analytics

What symbols does the trader recommend buying?
Purchase History
پیام های تریدر
Filter
QQQ mid-term TA

Nasdaq is having negative divergence in volumes, there'e a trampoline move in the process with a potential squeeze downside, be careful and watch for the correction in upcoming days.P.S. There are many other indicators that are being used for this TA, the above snapshot is only an example. Moreover, I've been doing technical analysis for quite some time, and I'm neither bullish nor bearish, I'm a swing trader who likes TA. And as you should know - always follow your strategy and make your own choices.
SOL mid-term TA
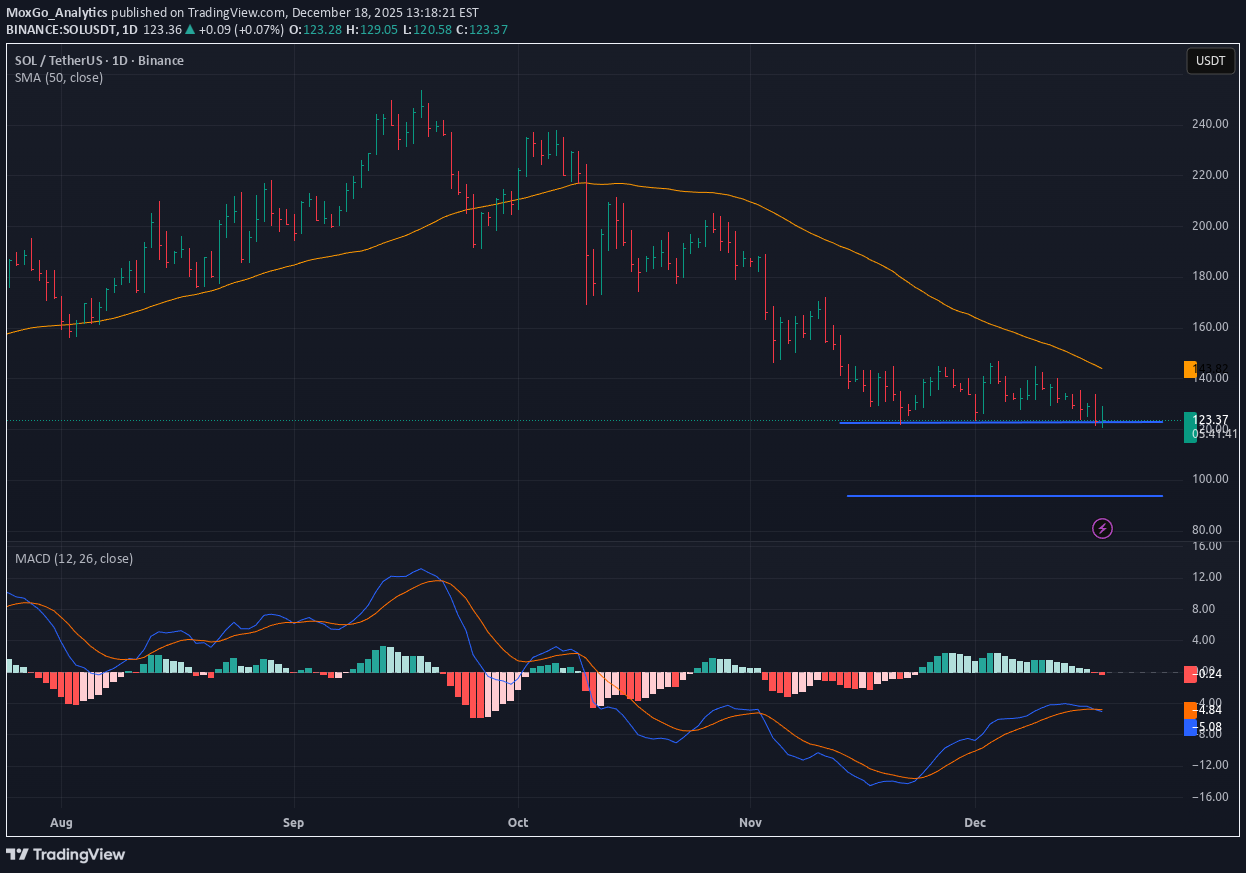
Solana is still very bearish on mid-term trend, as well as long-term there's no change in direction. Daily time frame is strictly bearish and currently Solana is entering the bearish area again, which may pull the price deeper to the previous lows around $90ish area.P.S. There are many other indicators that are being used for this TA, the above snapshot is only an example. Moreover, I've been doing technical analysis for quite some time, and I'm neither bullish nor bearish, I'm a swing trader who likes TA. And as you should know - always make your own choices.
CHZ mid-term TA
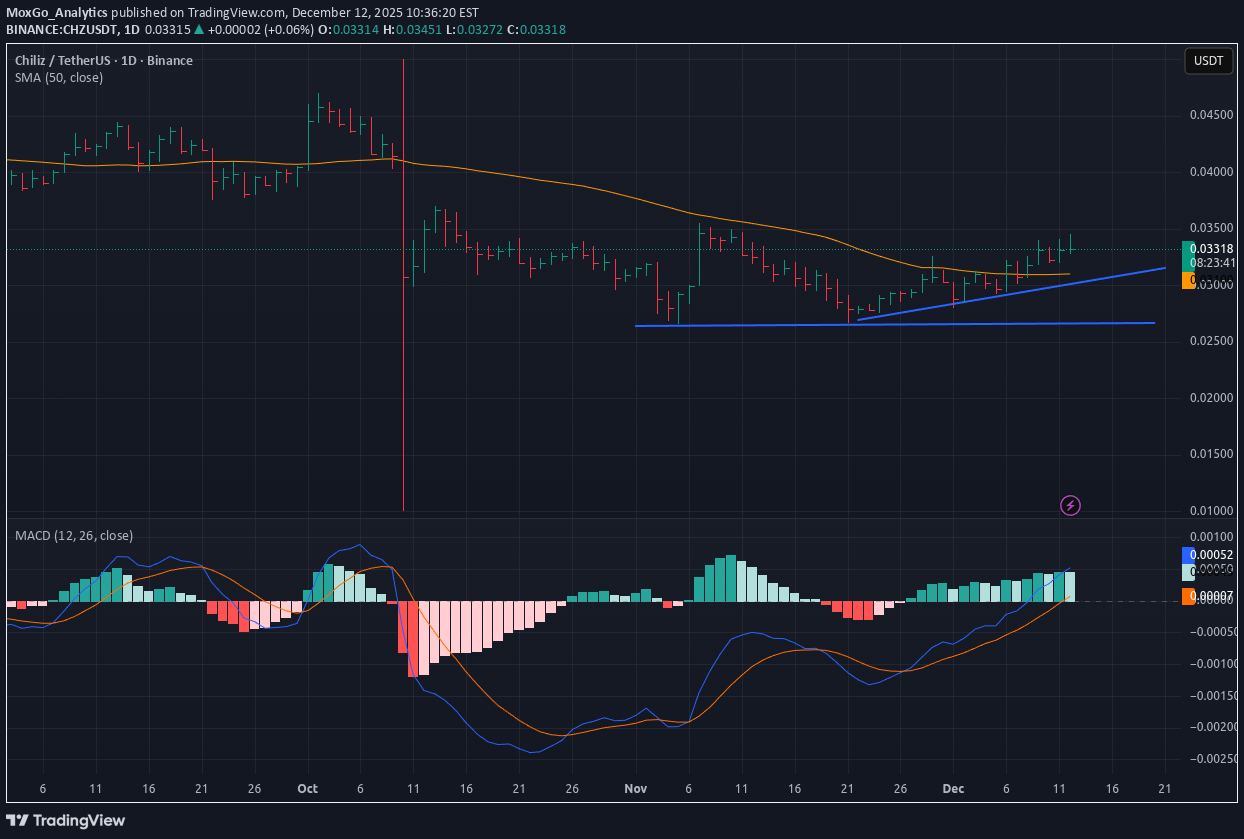
Chiliz can be an outperformer on crypto market in the upcoming weeks or months, as of now the volumes on CHZ have accelerated and there's a positive accumulation on weekly time frame as well, it's yet in the early stage of bullish formation but it's something to keep an eye on. Recently they have announced a partnership with Assetera and that could be a price pusher.P.S. There are many other indicators that are being used for this TA, the above snapshot is only an example. Moreover, I've been doing technical analysis for quite some time, and I'm neither bullish nor bearish, I'm a swing trader who likes TA. And as you should know - always make your own choices.The current formation for the uptrend has been declined. Most likely Chilliz is going to test the previous lows again. Now we need to wait and see if the support test succeeds.
QQQ mid-term TA
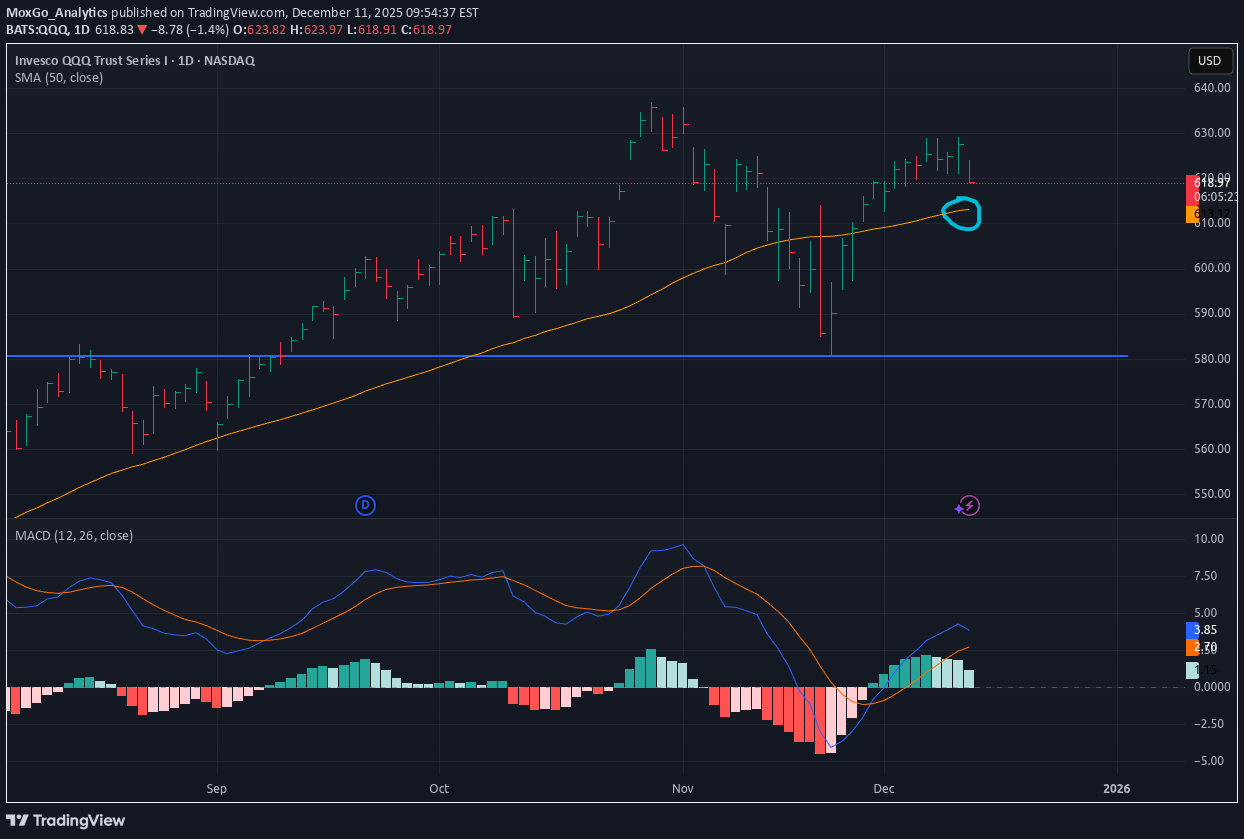
Nasdaq uptrend is still not fully restored, and it's having a negative trampoline move, the recent pump is overbought on indicators, watch out for the correction in the near future. If SMA50 test won't be successful then it may go down to test the previous lows again, watch the blue line as a pivot for the support.P.S. There are many other indicators that are being used for this TA, the above snapshot is only an example. Moreover, I've been doing technical analysis for quite some time, and I'm neither bullish nor bearish, I'm a swing trader who likes TA. And as you should know - always make your own choices.Nasdaq is getting weaker, be prepared for the possible pullback lower.
تحلیل میانمدت اتریوم: آیا رالی کریسمس در راه است یا دام خرسی؟
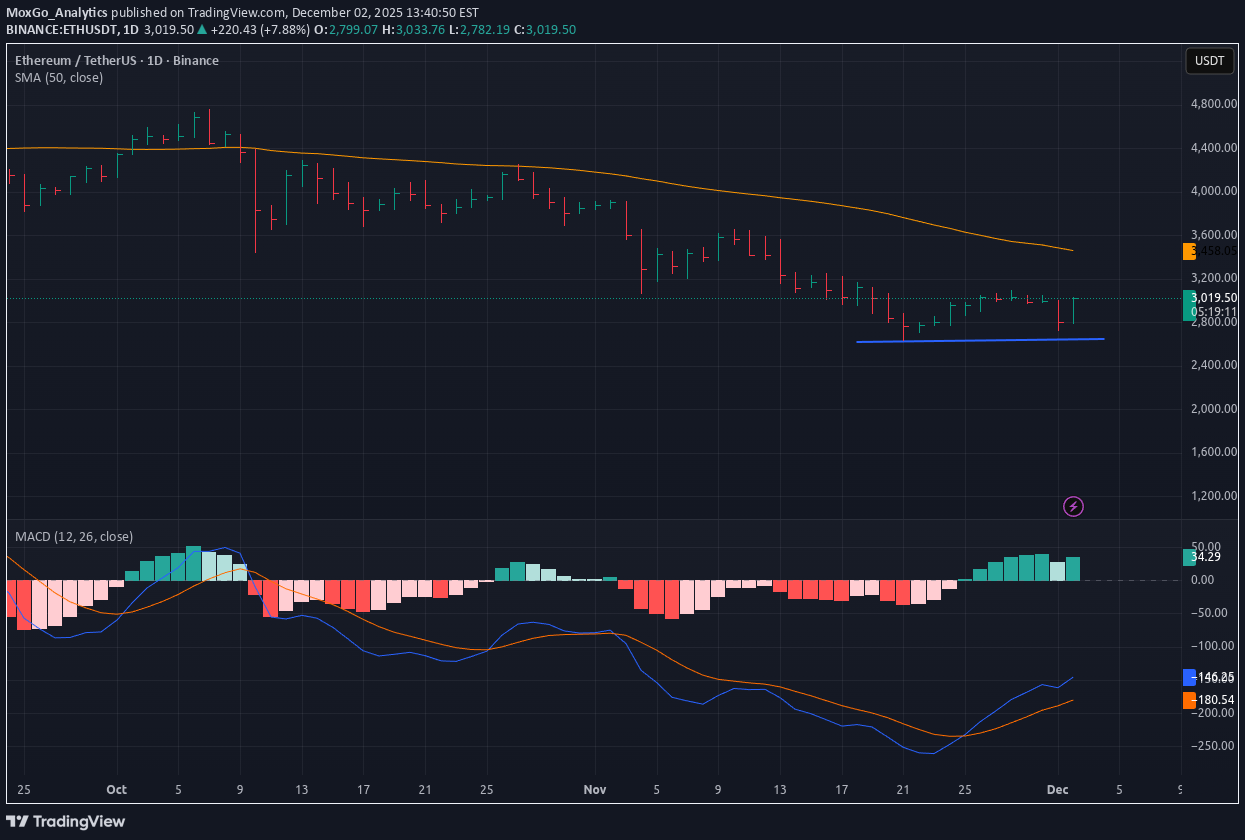
Ethereum as well as Bitcoin has stopped the distribution on daily time frame and both may have a relief X-mas rally, but it's too early to confirm yet and it's not a reversal of a downtrend either, the indicators remain in the bearish territory which may result in a short-lived rally. Be cautious of the current high risk. Technically mid-term trend remains bearish.P.S. There are many other indicators that are being used for this TA, the above snapshot is only an example. Moreover, I've been doing technical analysis for quite some time, and I'm neither bullish nor bearish, I'm a swing trader who likes TA. And as you should know - always make your own choices.Ethereum keeps getting rejected on daily time frame and it's currently dives back into the bearish area. Possible support test can go as low as $2158. Let's wait and see when the trend will finally change the direction.
تحلیل میانمدت بیت کوین: آیا رالی کریسمس دوام میآورد؟
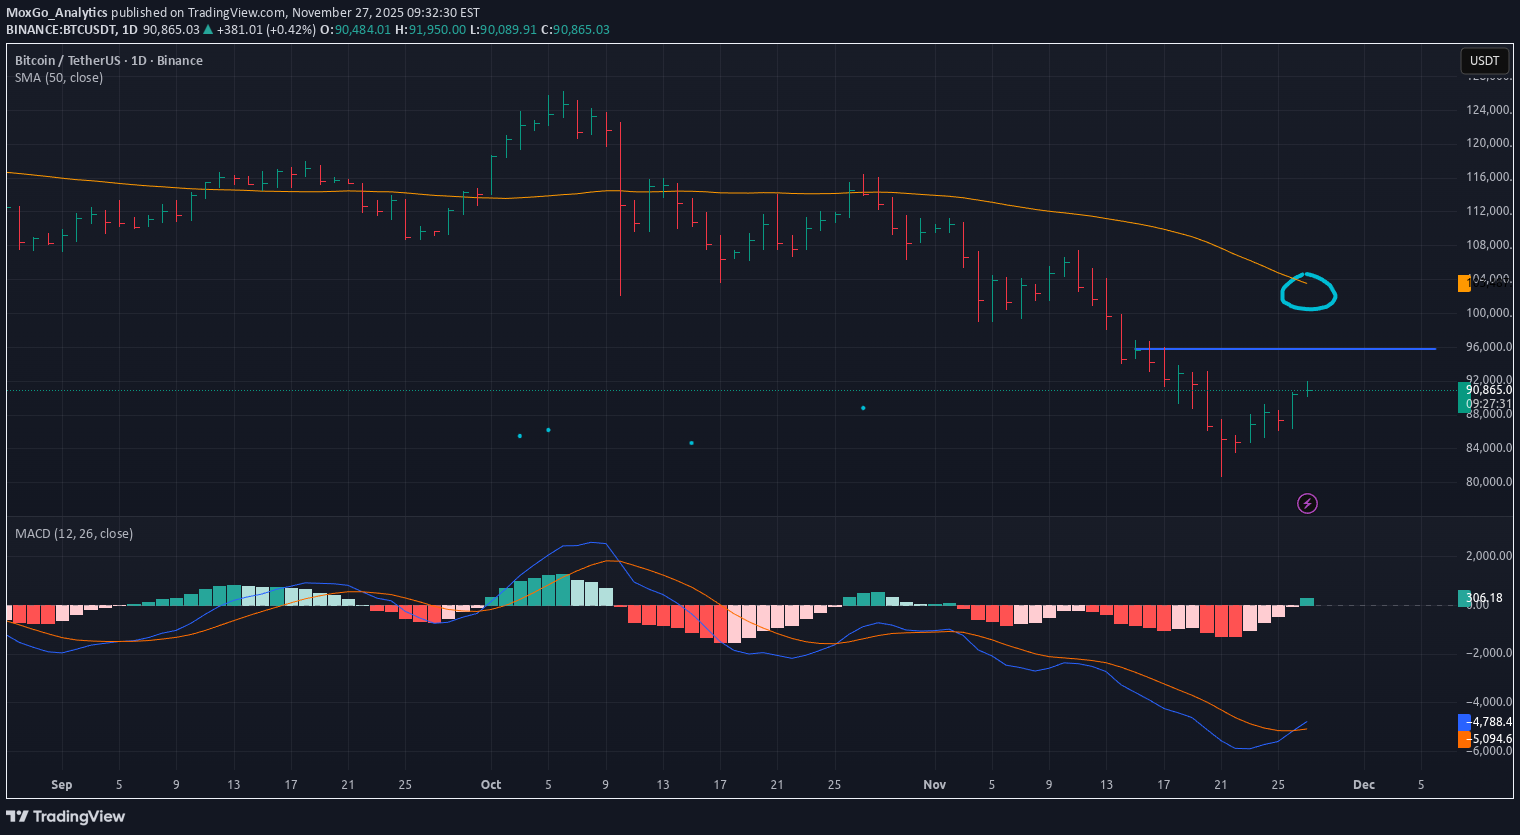
Bitcoin is having a relief rally from the continuous falling initiated by excessive selling, you may also see the MACD crossover, yes, but it's in bearish area and it's too early for the downtrend reversal, it's just a bounce or a short-lived rally, you may call it the way you like it, but the bearish downtrend is engaged and it's still very strong and it will need much more time and effort to finally bottom out. For now let's hope for X-mas rally to continue. Watch for the resistance levels at 95k and the falling SMA50.P.S. There are many other indicators that are being used for this TA, the above snapshot is only an example. Moreover, I've been doing technical analysis for quite some time, and I'm neither bullish nor bearish, I'm a swing trader who likes TA. And as you should know - always make your own choices.To give you even more information - Bitcoin has broken its mid-term uptrend since the end of August, yes you read that right, there are many indicators that were hinting on that. Since then, it has only bounces and negative trampolines like the previous one to 126k or so, which in fact was a false break.
تحلیل بلندمدت سولانا: آیا کف قیمتی در محدوده ۱۳۰ دلار تثبیت میشود؟
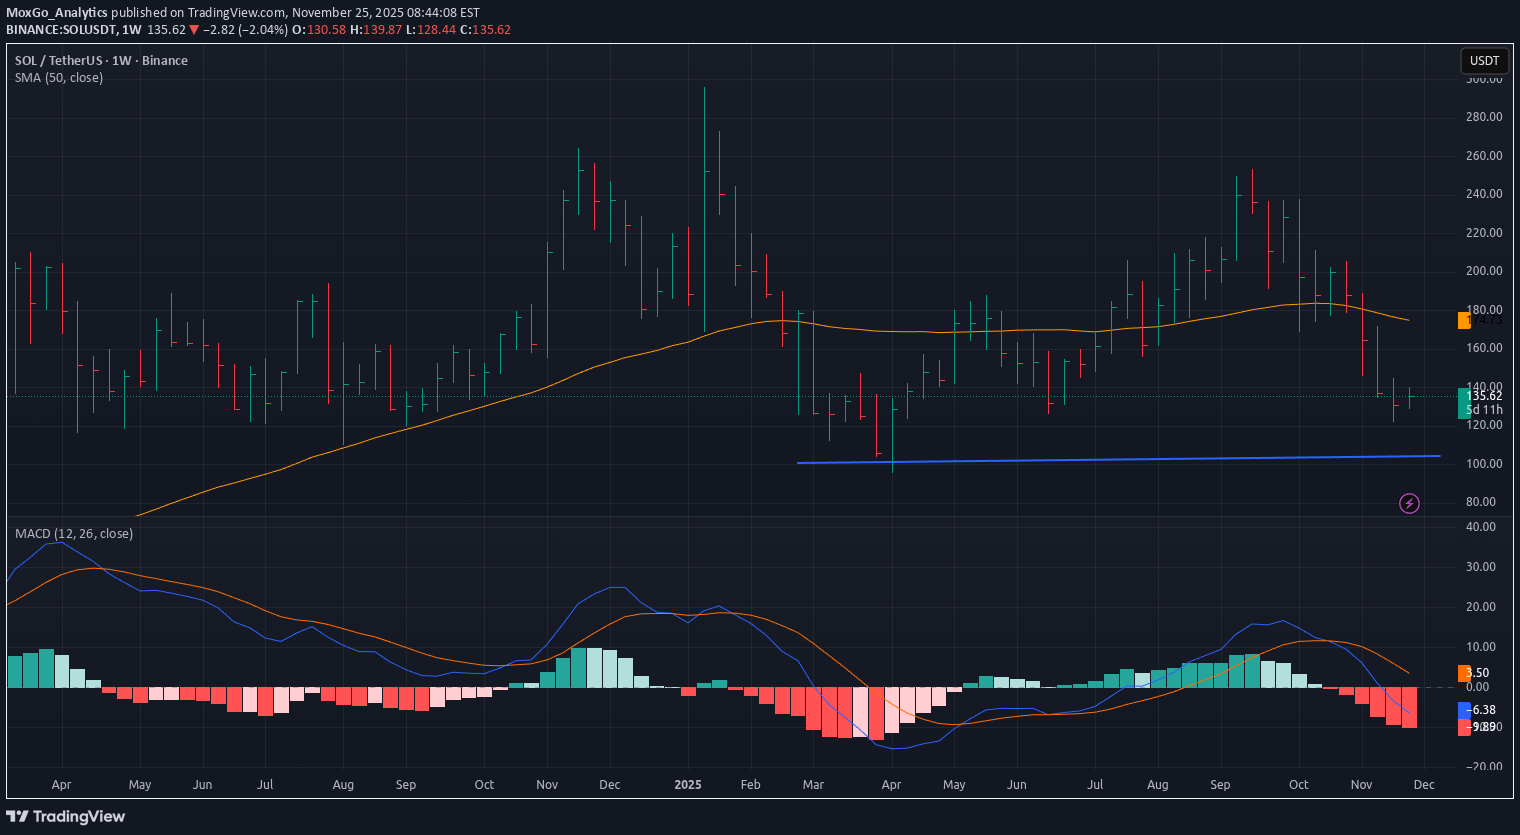
Solana is in heavy distribution, currently the weekly downtrend is engaged, it needs more time to bottom out, there's a good support at this area of $130ish and if it's broken we can see the lows of $100ish again.P.S. There are many other indicators that are being used for this TA, the above snapshot is only an example. Moreover, I've been doing technical analysis for quite a while, and I'm neither bullish nor bearish, I'm a swing trader who likes TA. And as you should know - always make your own choices.
تحلیل تکنیکال اتریوم: آیا کف حمایتی ۲۷۰۰ دلار میشکند؟ (نگاه بلندمدت)
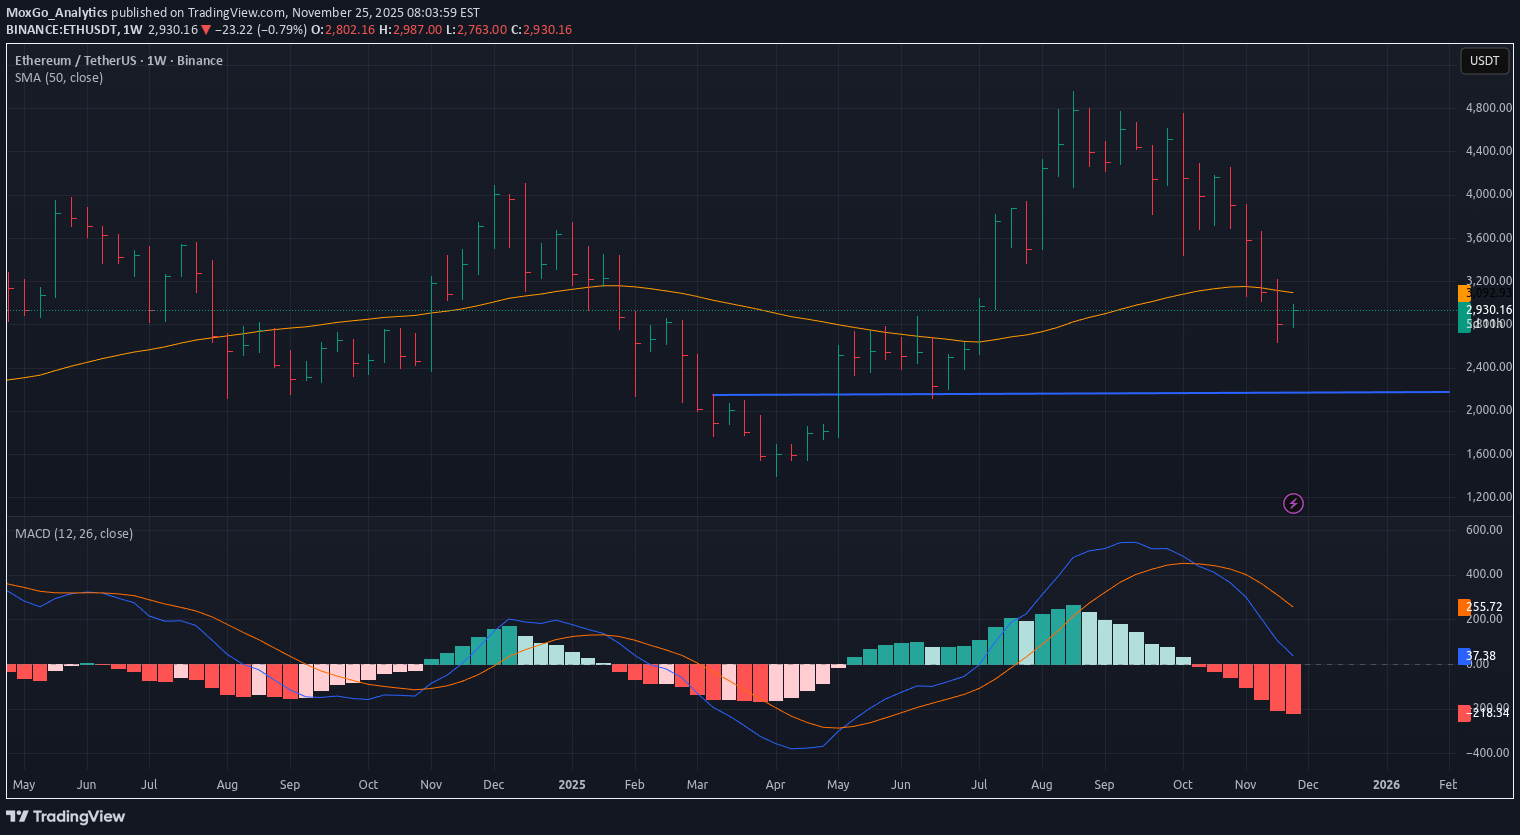
Ethereum is among the strongest crypto assets out of top 10 crypto market cap, the weekly uptrend is still holding up but has weaken a lot and currently entering bearish area which could drag Ethereum even lower.. There's current weekly support at $2700 which is holding up and if it's broken then it can go all the way to $2100 area. Mid-term is currently in heavy distribution but in general Ethereum looks stronger than Bitcoin on long-term at this moment.P.S. There are many other indicators that are being used for this TA, the above snapshot is only an example.Moreover, I've been doing technical analysis for quite a while, and I'm neither bullish nor bearish, I'm a swing trader who likes TA. And as you should know - always make your own choices.
تحلیل بلندمدت بیت کوین: پایان روند صعودی و پیشبینی زمان اصلاح بزرگ!
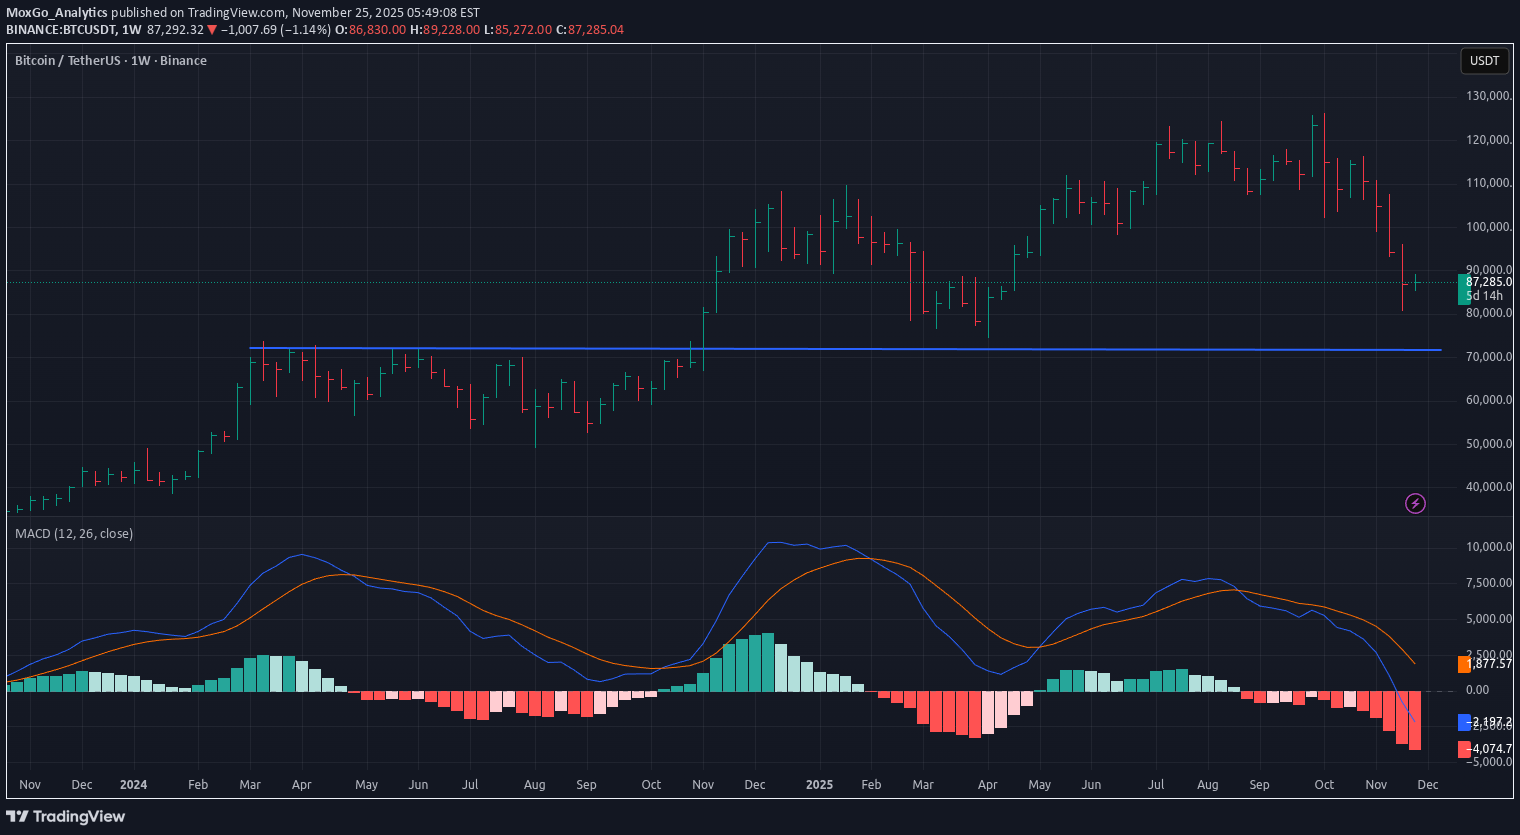
It's been a while since the lasts posts, let's keep it up! Bitcoin is entering an extreme bearish area on weekly time frame, the uptrend that lasted since March 2023 has been officially broken. The recovery may take anywhere between 6 to 12 months, no one can tell precisely but it's going to take some time.the blue line is an approximate level for the correction, but it may go lower, DeMark pivot is at 66k and the standard pivots for the support are even lower.P.S. There are many other indicators that are being used for this TA, the above snapshot is only an example.
Disclaimer
Any content and materials included in Sahmeto's website and official communication channels are a compilation of personal opinions and analyses and are not binding. They do not constitute any recommendation for buying, selling, entering or exiting the stock market and cryptocurrency market. Also, all news and analyses included in the website and channels are merely republished information from official and unofficial domestic and foreign sources, and it is obvious that users of the said content are responsible for following up and ensuring the authenticity and accuracy of the materials. Therefore, while disclaiming responsibility, it is declared that the responsibility for any decision-making, action, and potential profit and loss in the capital market and cryptocurrency market lies with the trader.