
CAKE
PancakeSwap
| تریدر | نوع سیگنال | حد سود/ضرر | زمان انتشار | مشاهده پیام |
|---|---|---|---|---|
 JuliiaRank: 129 | خرید | حد سود: تعیین نشده حد ضرر: تعیین نشده | 12/10/2025 | |
 SwallowAcademyRank: 30699 | خرید | حد سود: تعیین نشده حد ضرر: تعیین نشده | 12/10/2025 | |
 Richtv_officialRank: 29998 | خرید | حد سود: تعیین نشده حد ضرر: ۱٫۶۶ | 10/21/2025 |
Price Chart of PancakeSwap
سود 3 Months :
خلاصه سیگنالهای PancakeSwap
سیگنالهای PancakeSwap
Filter
Sort messages by
Trader Type
Time Frame
SwallowAcademy
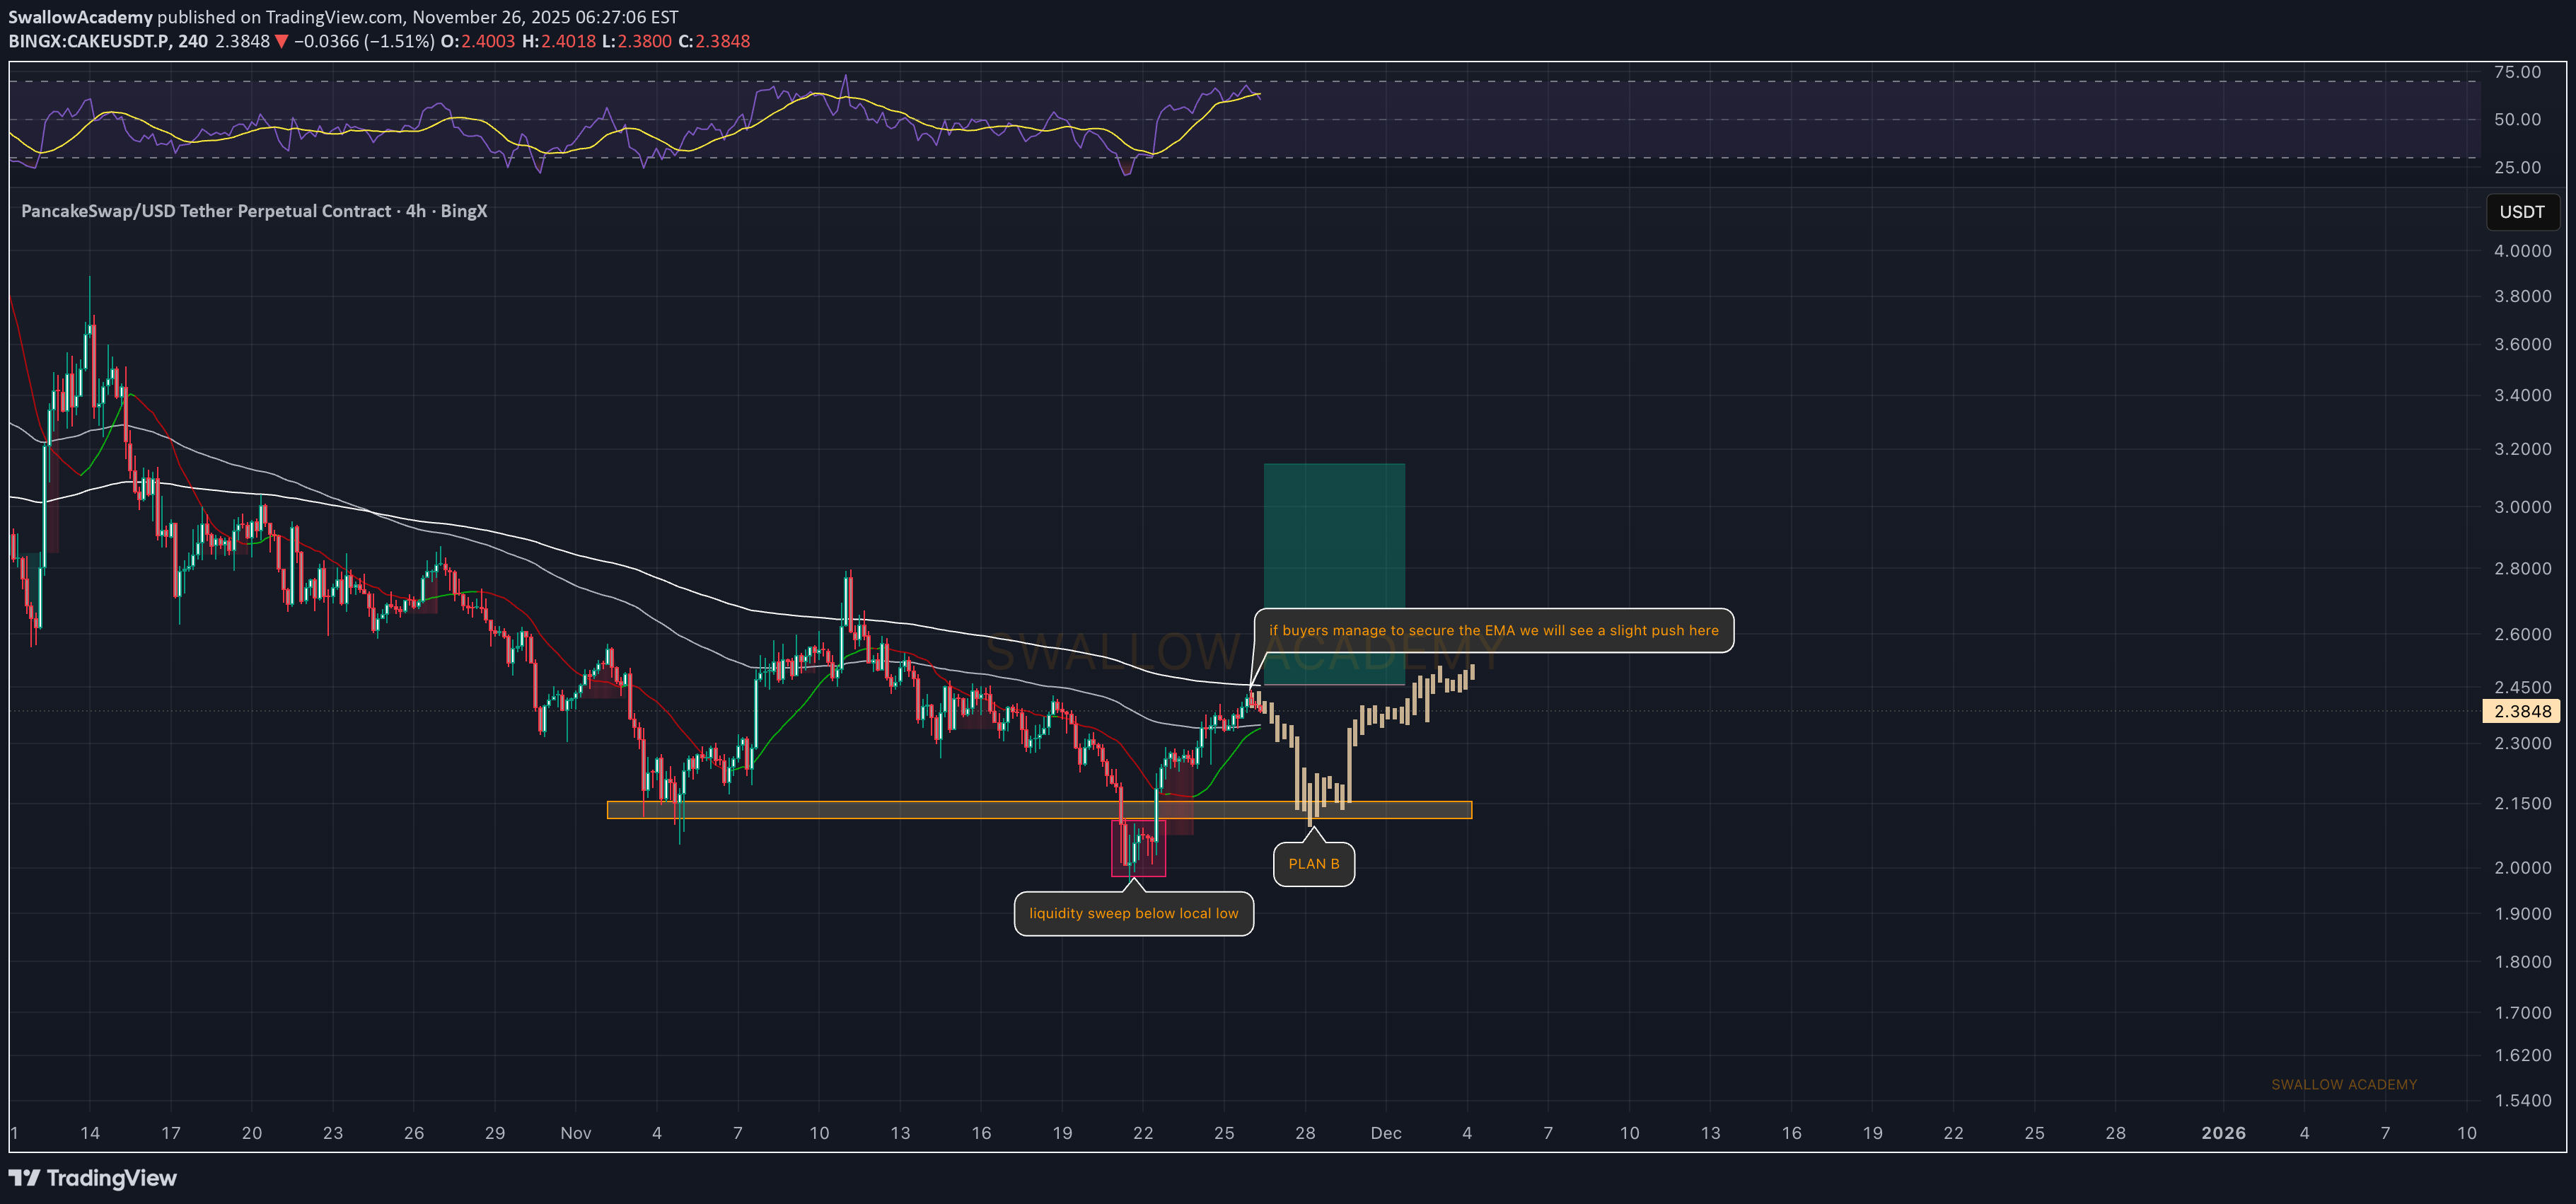
Pancake Swap (CAKE): Getting Ready To Enter The Bullish Trend
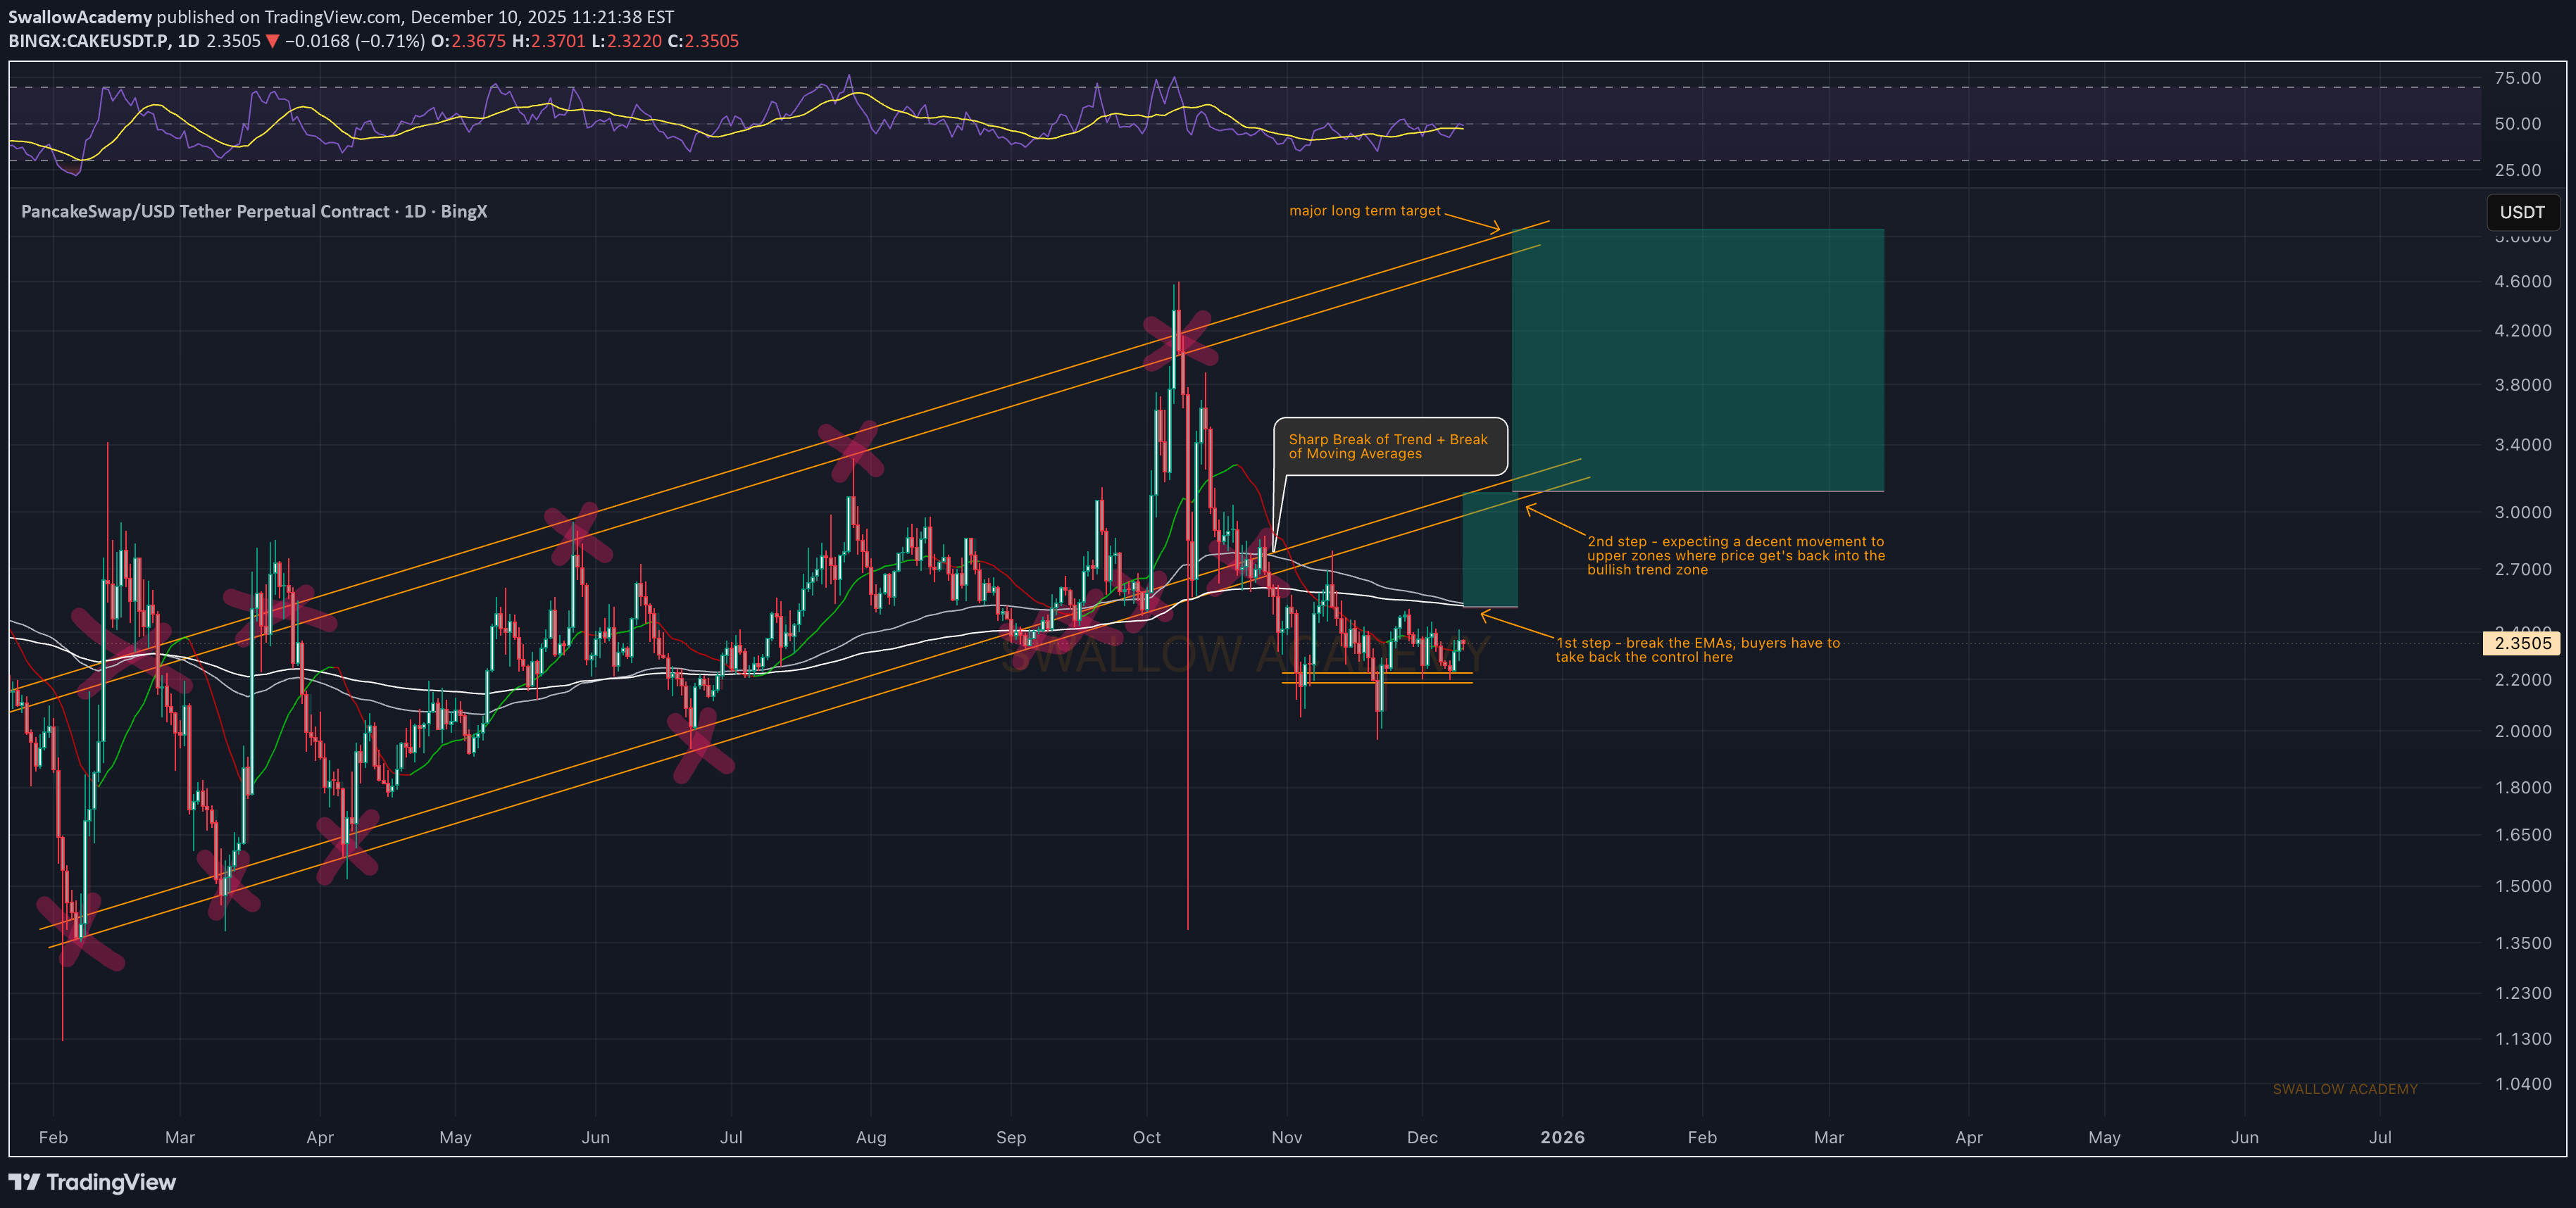
CAKE is holding the support zone, but buyers still need to take back control by reclaiming the EMAs. That’s the first step before we even think about a move into the upper zones. If buyers manage to secure the EMAs, we should see price pushing back toward the old bullish trend zone. That’s where the clearer momentum shift forms and the long-term target becomes realistic again. For now, it’s all about reclaiming those EMAs and building from this support. Swallow Academy
Juliia
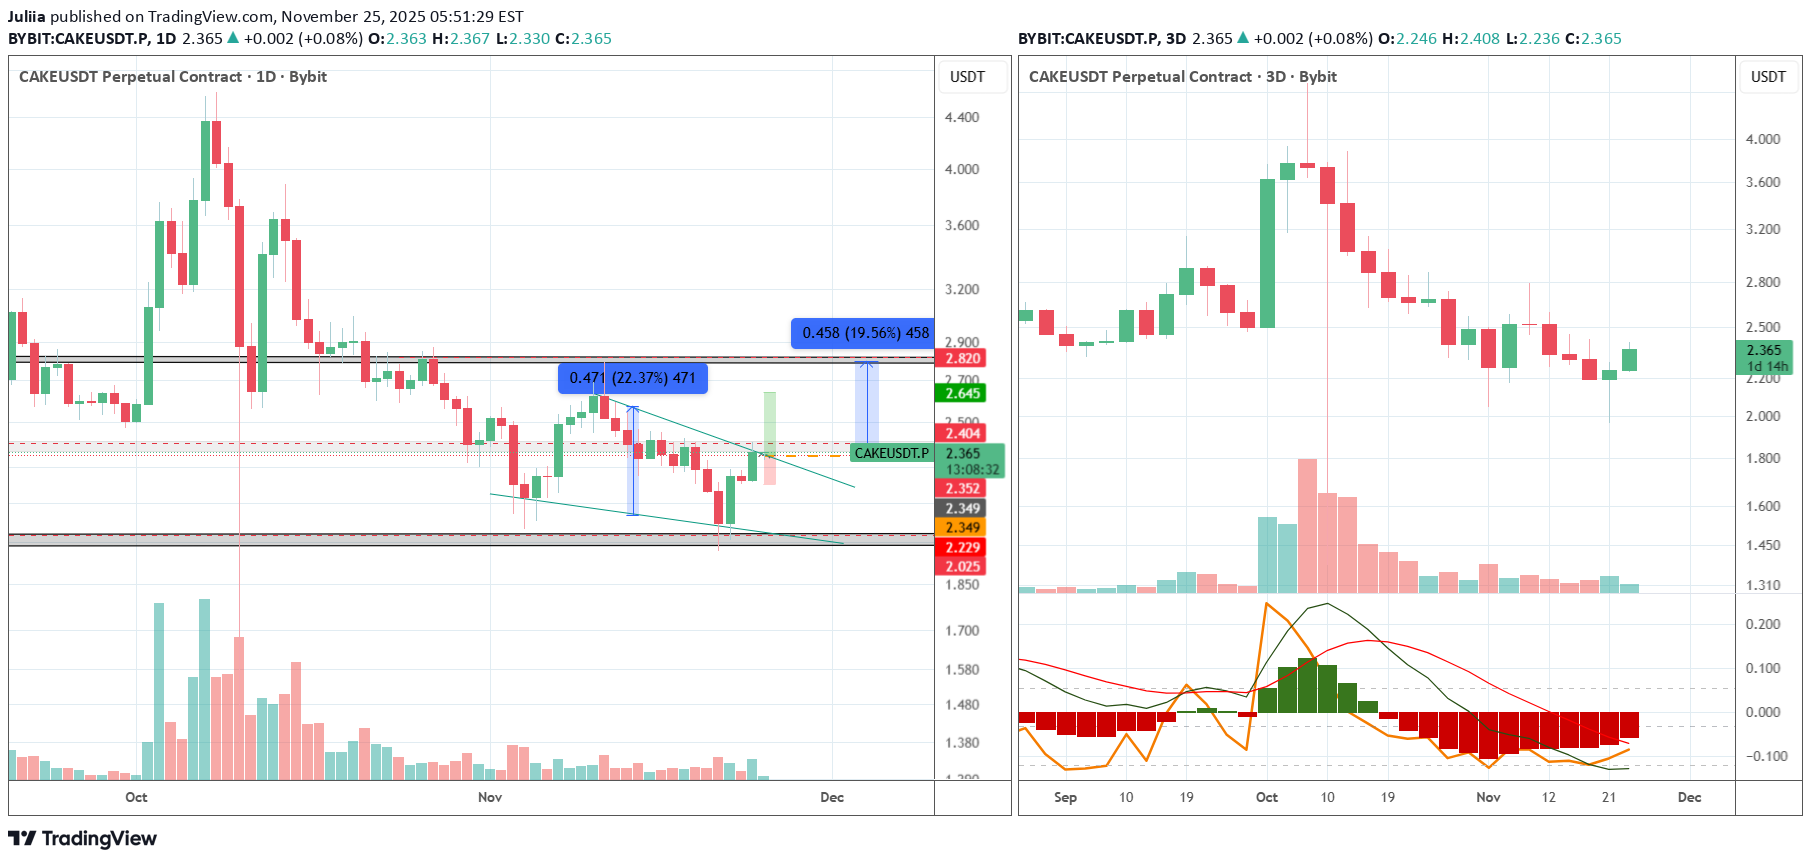
CAKE/USDT Long Setup
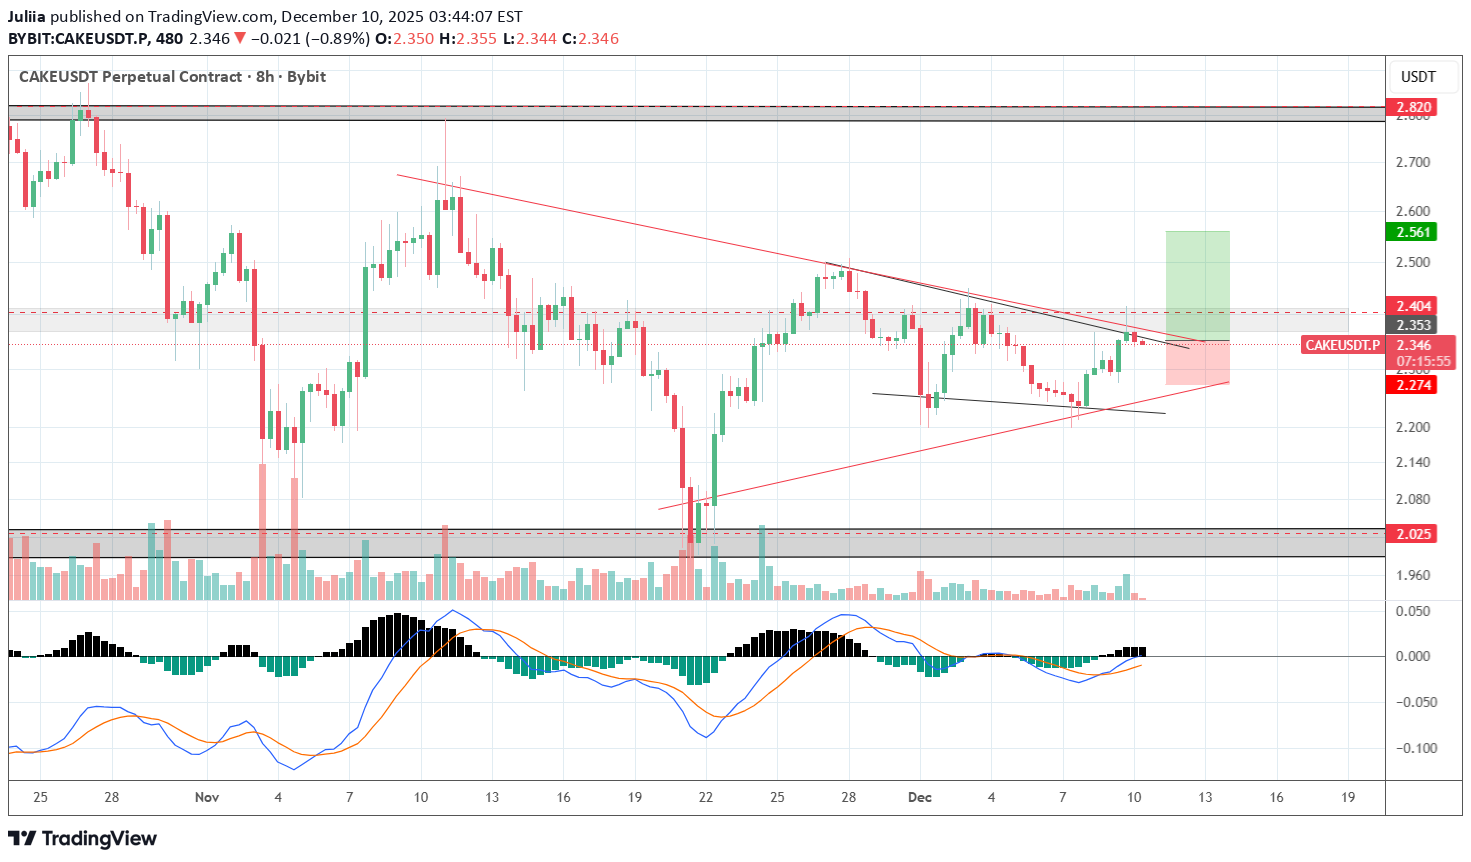
— Multiple resistance tests, decreasing volatility, price compression under the level — Entry: Conditional order (NOT market) Trigger: $2.356 Limit buy: $2.358 — Stop: $2.265 — 3.5% is the price movement from entry to stop, NOT the loss percentage — Target: $2.55 Risk per trade: 0.5% of the total account — this is the percentage of potential loss Position size: 15% of the total account, 10x leverage RR: 1:2.25

AmanSumanTrader
سیگنال فروش CAKE/USDT: آمادهاید در کوتاهمدت سود کنید؟ (تحلیل مقاومت خط روند)
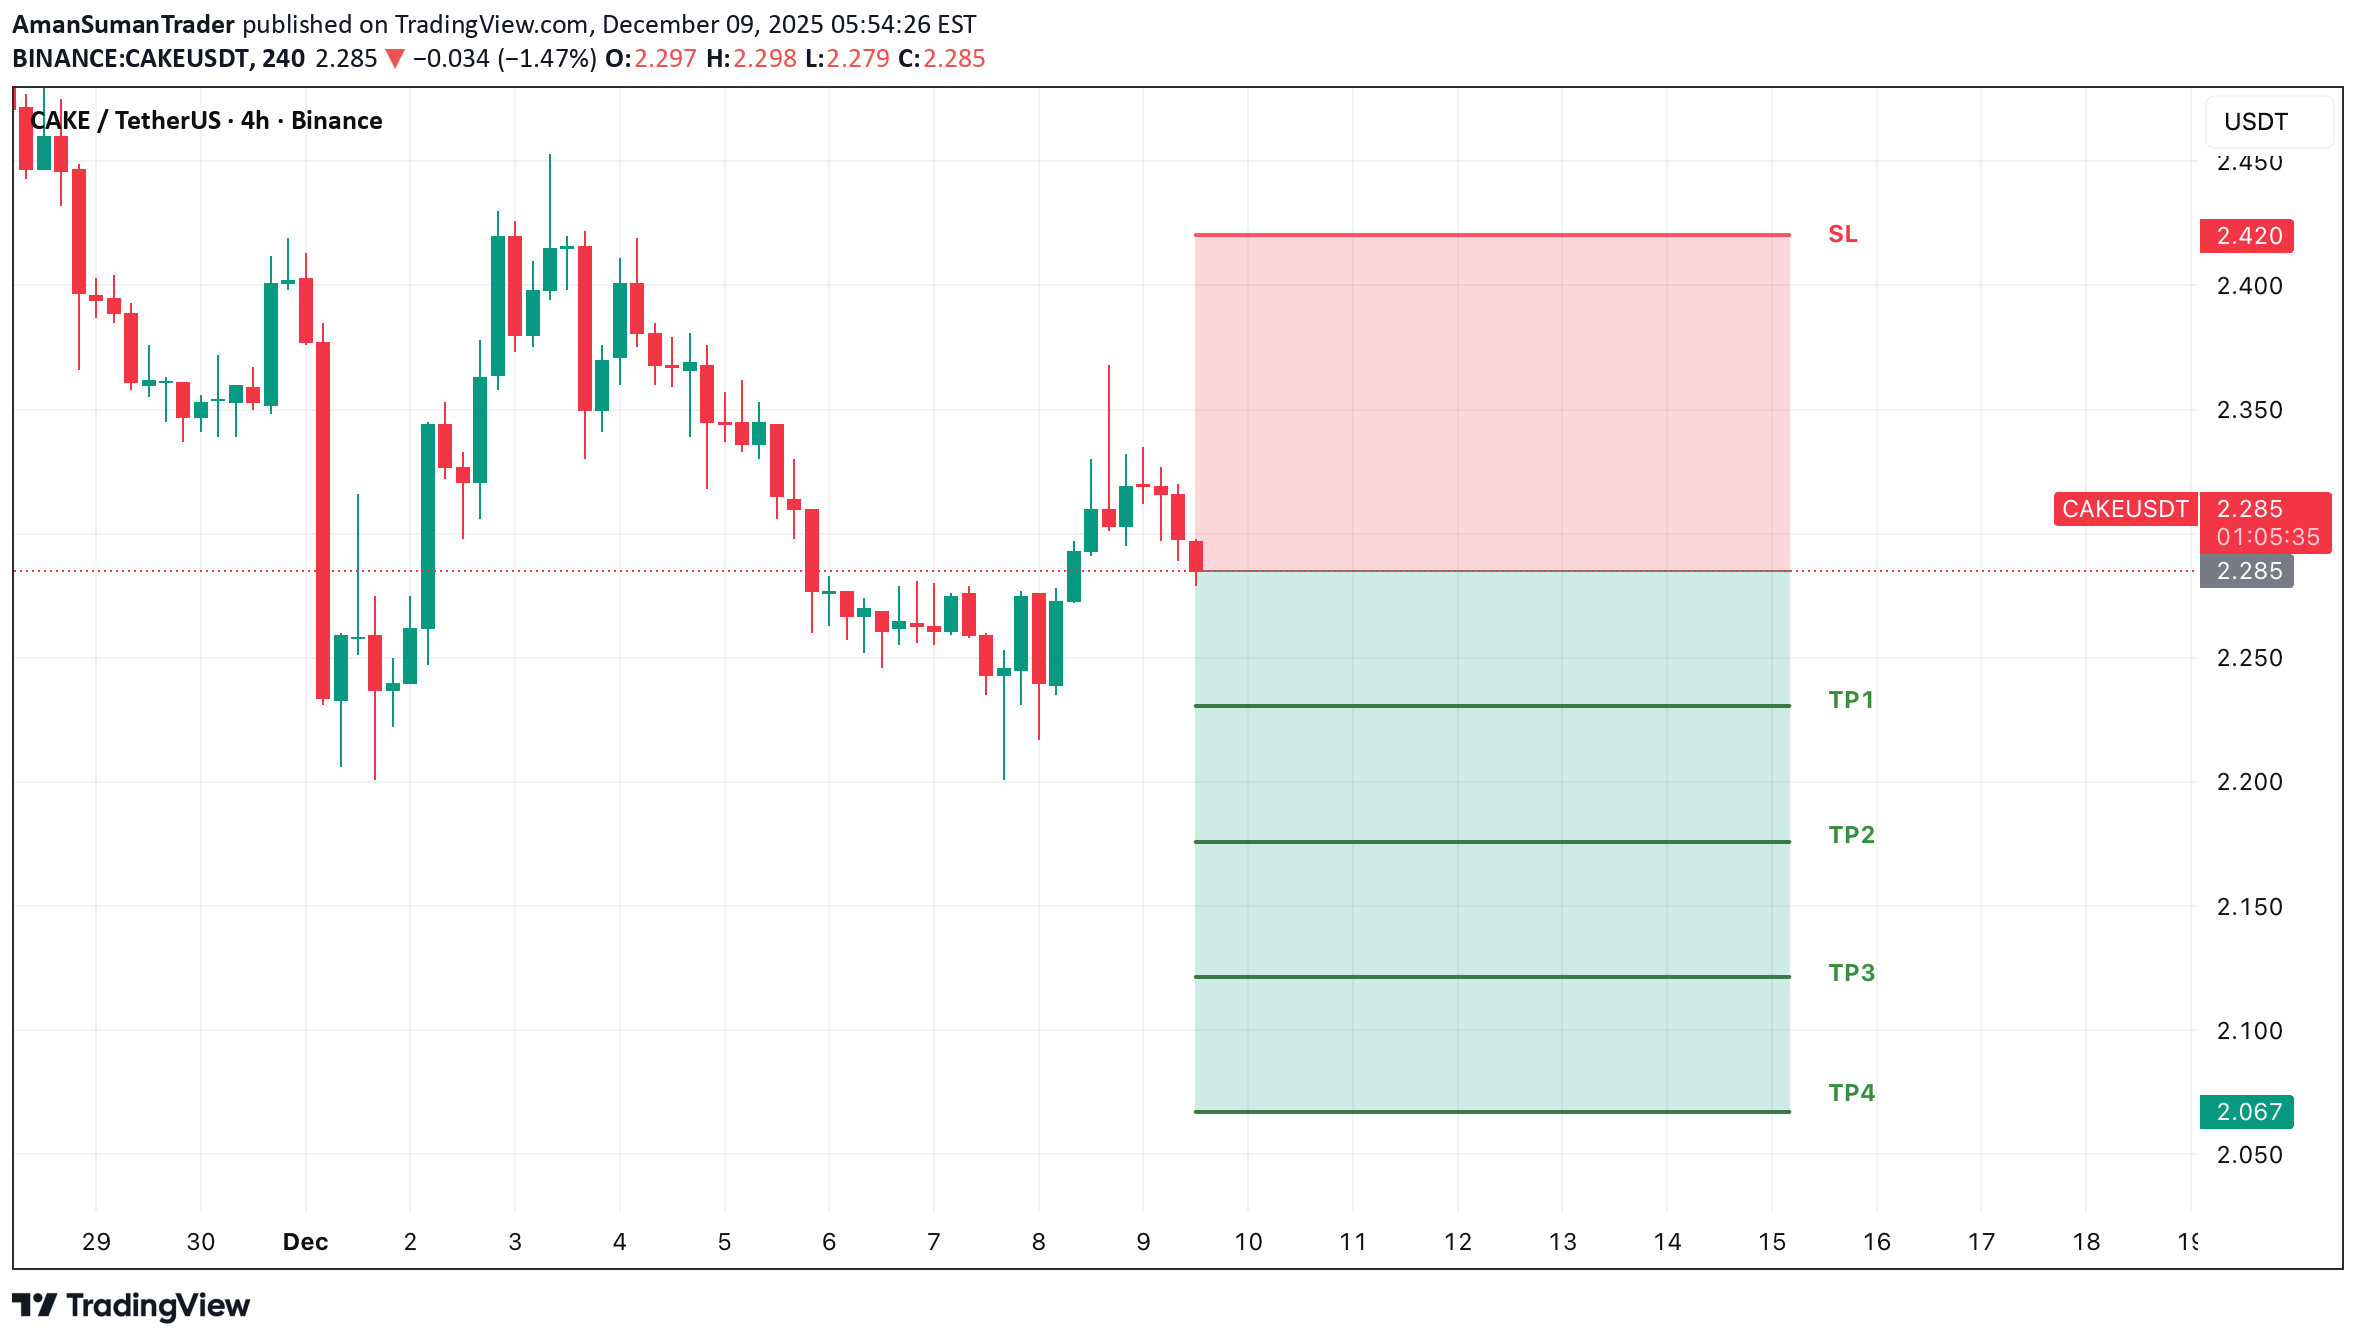
New Trade Setup: CAKE-USDT SHORT Entry: 2.2865 or CMP Target: TP1: 2.2305, TP2: 2.1760, TP3: 2.1215, TP4: 2.067 Stoploss: 2.4113 Leverage: 1X Technical Analysis: CAKE/USDT is finding the trendline resistance while in downtrend and with a high probability of moving up to test the next resistance level.

سقوط بزرگ در راه است؟ تحلیل حیاتی CAKE در منطقه حمایت کلیدی
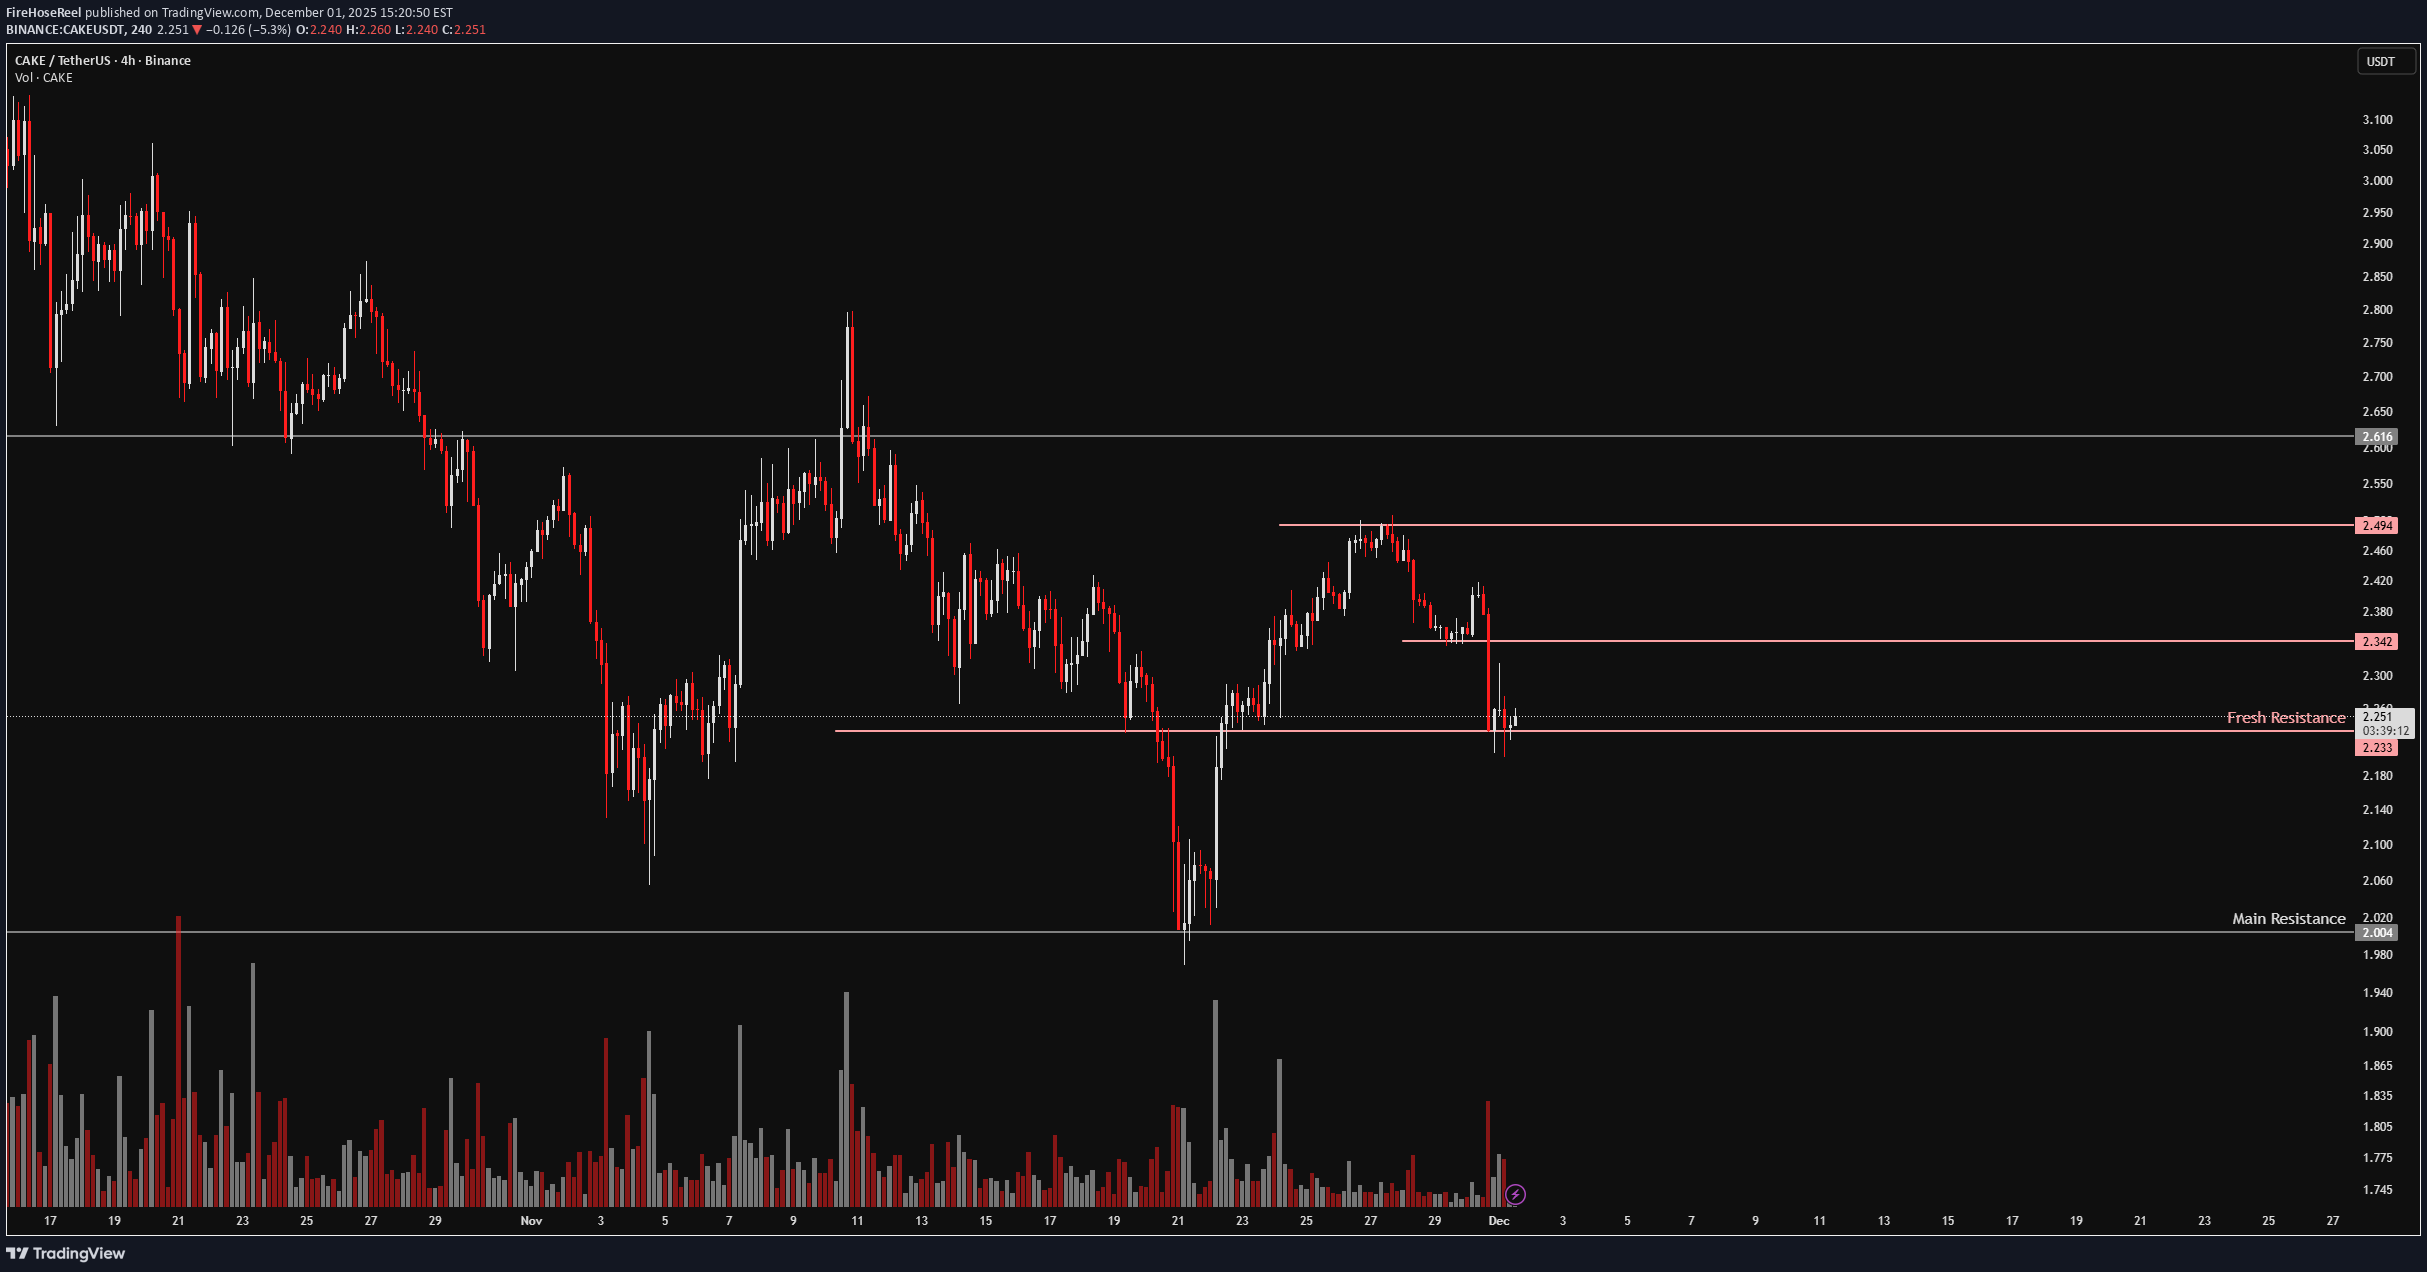
🔥 Welcome To FireHoseReel ! Let's dive into Cake analysis, the native token of PancakeSwap DEX. 👀 CAKE – Short-Term Market Breakdown After breaking its newly formed support at $2.342, CAKE moved sharply lower and formed a temporary support around $2.233. A breakdown below $2.233 could activate the next major downside trigger. 📊 Volume Analysis Selling pressure on CAKE has intensified aggressively. In a single 4H candle, sellers dominated the market with heavy force. If sell volume expands again, the current downtrend is likely to continue with momentum. 🔁 CAKE/BTC Perspective The CAKE/BTC pair is still holding a bullish structure, but a loss of its current support could trigger a corrective phase in the BTC pair as well. 📌 Trading Scenario This scenario can be used alongside your own trading strategy and risk management. 🔴 Short Scenario Breakdown below the newly formed support at $2.233 Must be accompanied by a strong increase in sell volume This could push CAKE lower and may also trigger a support breakdown on CAKE/BTC, adding further downside pressure. ❤️ Risk Management & Emotional Discipline Crypto trading is highly risky. Without proper risk management and emotional control, trading is no different from gambling. Logic must always come before emotions. Learn to manage your trades—and enjoy the process of trading with control and discipline.

St_Gex
پامپ بزرگ در راه است؟ سیگنال صعودی قوی برای توکن CAKE در صرافی پنکیکسواپ!
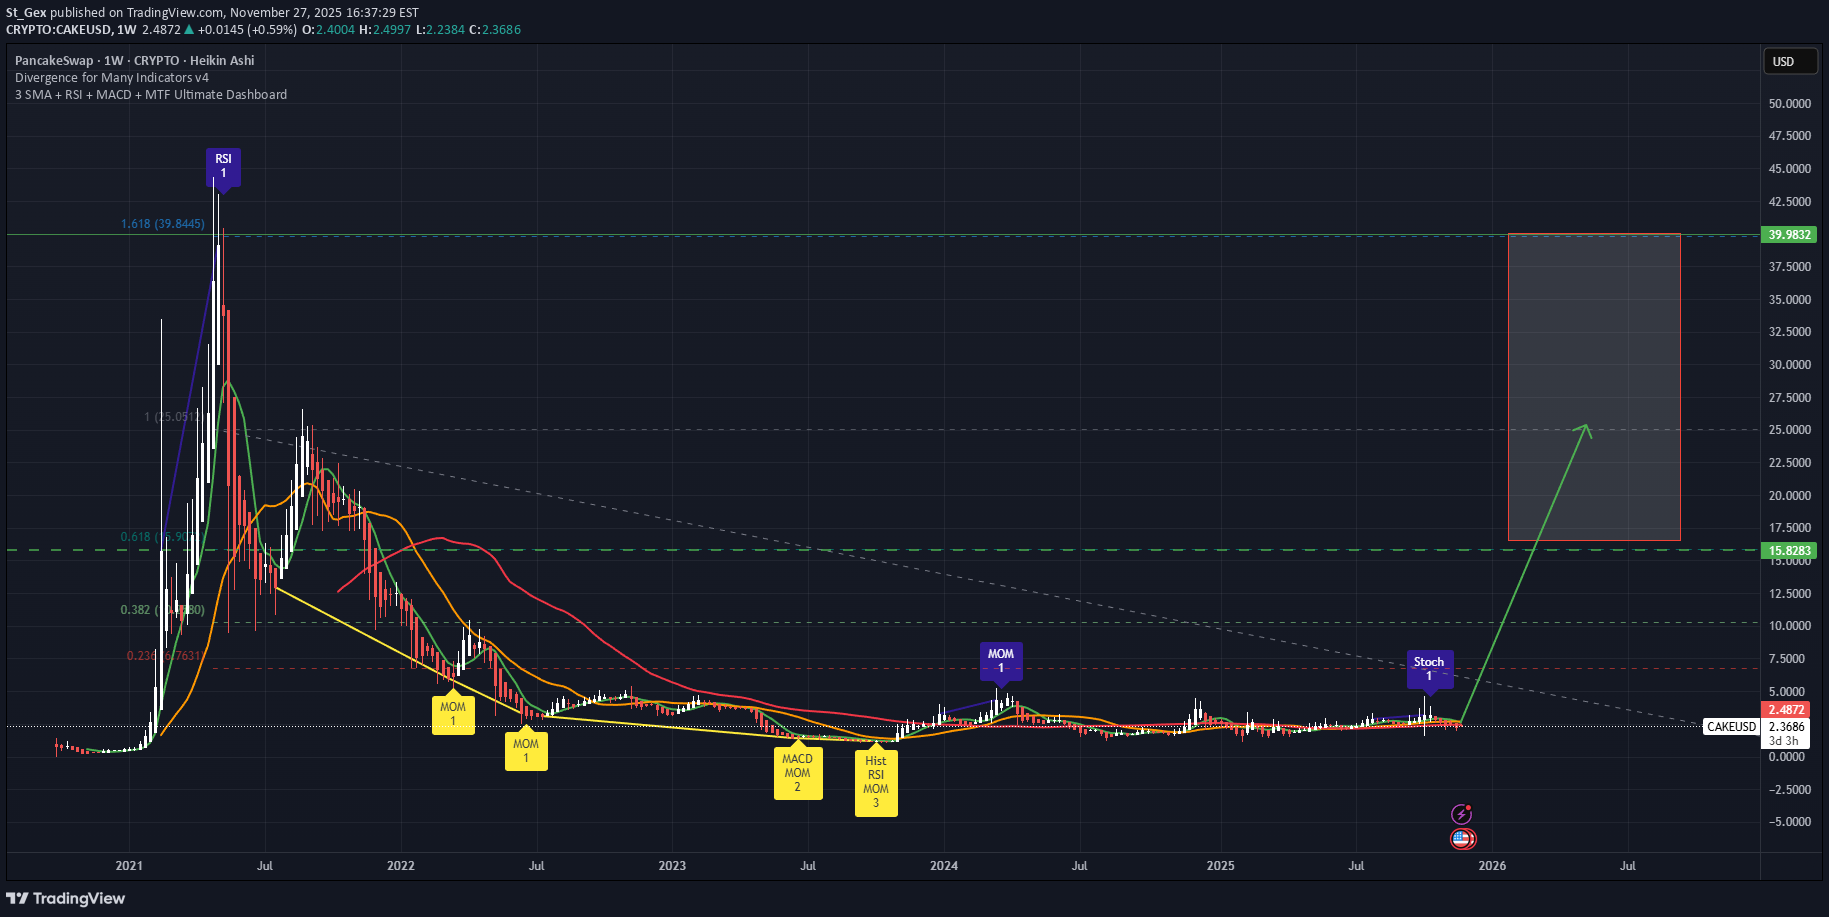
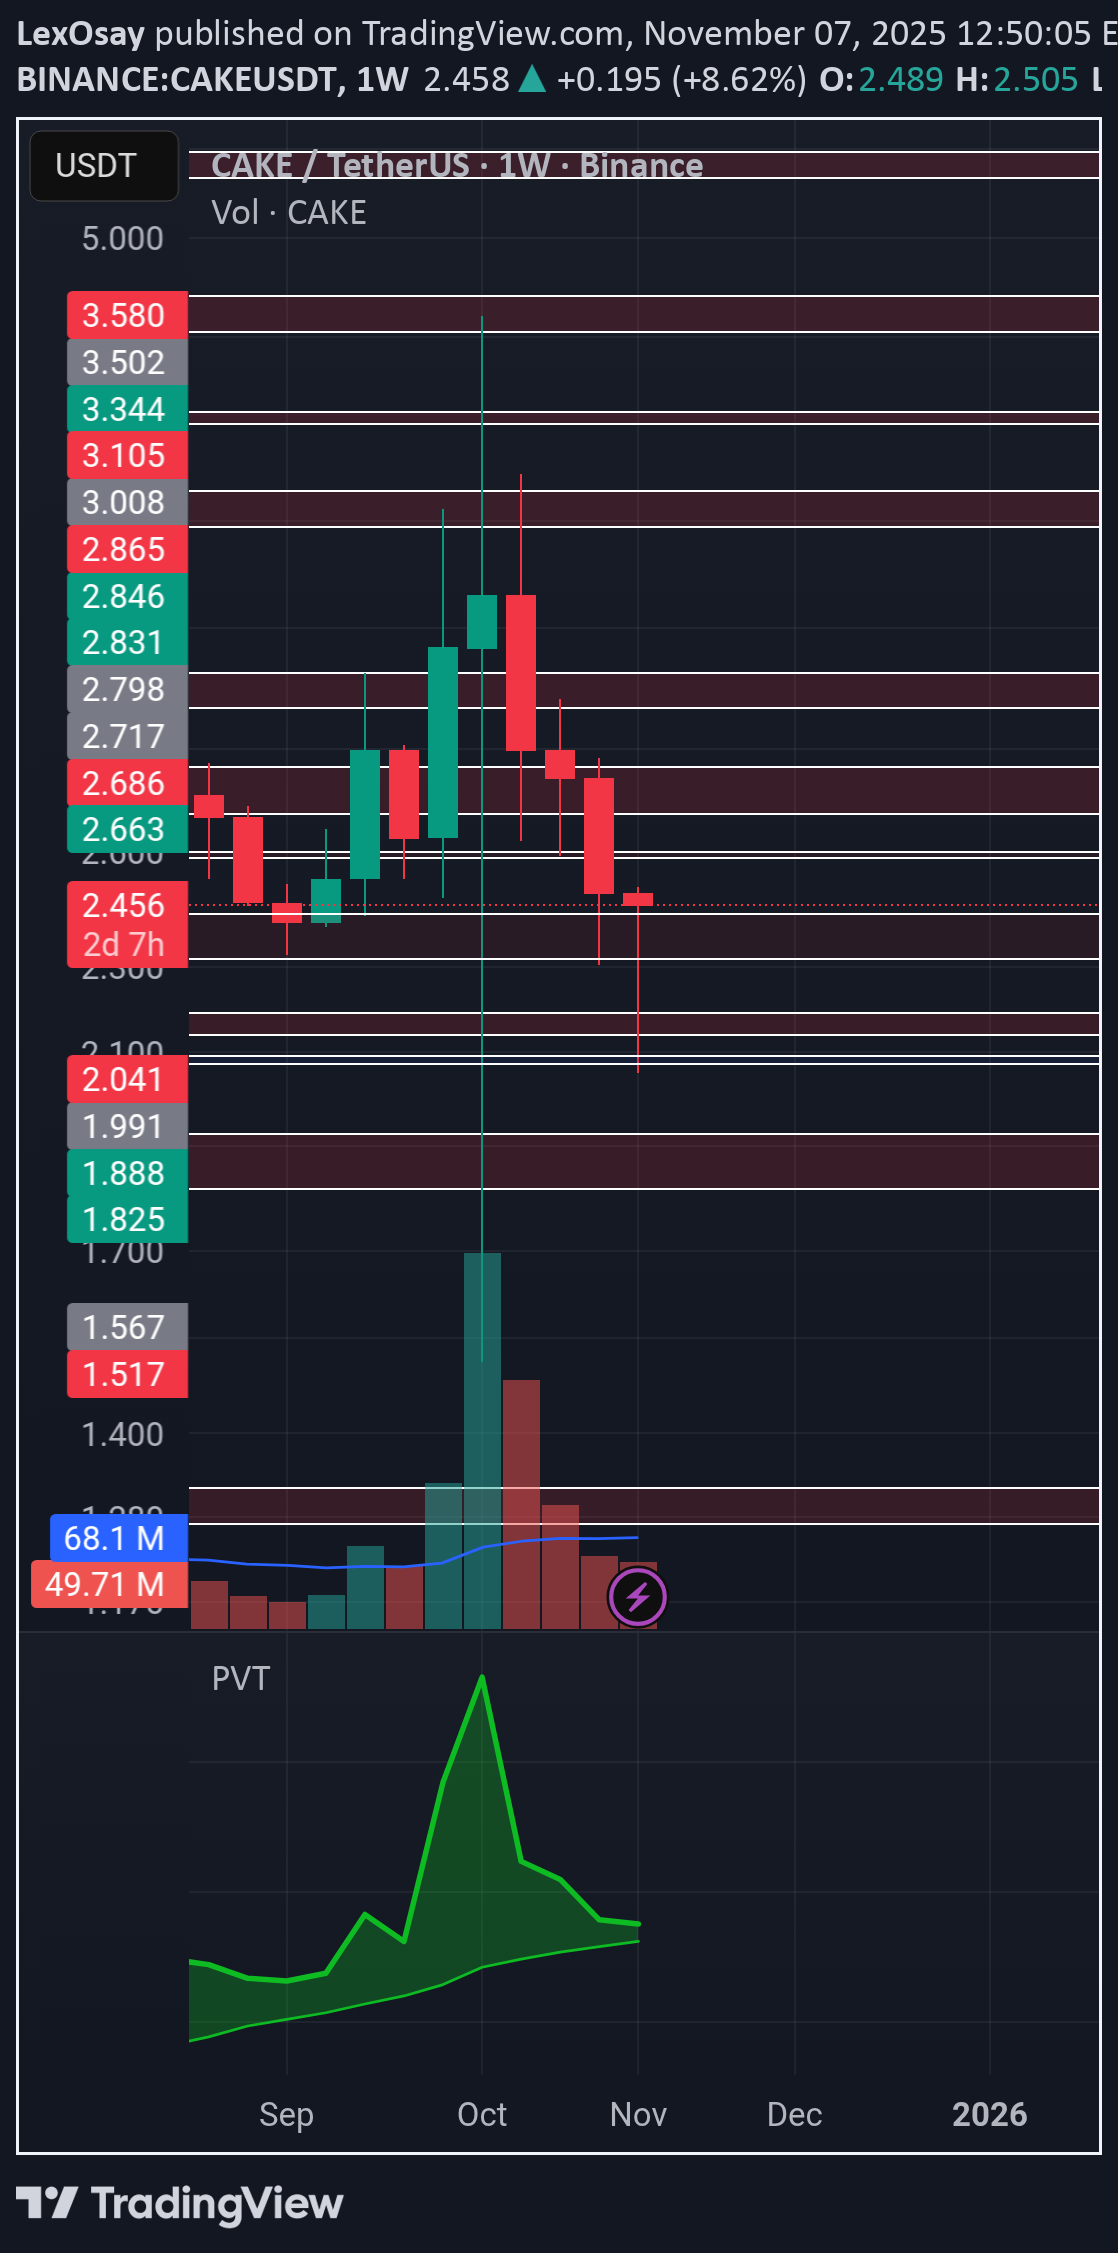
Hi Pancake Swap has around 3B TVL into his DEX and its still the most used. Owned by Binance. Even though is a big range, this kind of altcoin could be highly speculative and can reach unimaginative prices. This is not a trading advice. Thanks Gex
SwallowAcademy
تحلیل CAKE: دو استراتژی جذاب برای معامله بلندمدت (200EMA)
CAKE just tapped the EMAs again, and that’s the main thing we’re watching now. If buyers manage to secure a proper breakout above them, we should see a decent upside push toward the next resistance zone. If that doesn’t play out, then Plan B is still valid — a move back into the lower support area, where we’d look for another reaction and a long setup from there. For now, buyers just need to hold structure and show continuation above the EMAs. Swallow Academy
Juliia
فرصت خرید جذاب CAKE: پیشبینی انفجاری قیمت با اهرم عالی!
CAKE/USDT — Long — The price moved far away from the support level despite Bitcoin dropping. CAKE is now testing a resistance level with a strong approach; there may be attempts to break above it and potentially flip the trend around the MA50/200 on the daily timeframe. The setup looks strong, and Bitcoin shows signs of a slowdown. A possible bullish wedge is forming. — Entry: $2.345 (Market buy) — Stop: $2.23 (-5% price movement from entry to stop — NOT percentage loss) — Target: $2.64 Risk per trade: 0.5% of total deposit (this is the percentage loss) Position size: 10% of total deposit, leverage 10x RR: 1 : 2.4

Bithereum_io
تحلیل تکنیکال CAKEUSDT: خرید پلهای در کف کانال نزولی با اهداف صعودی جذاب
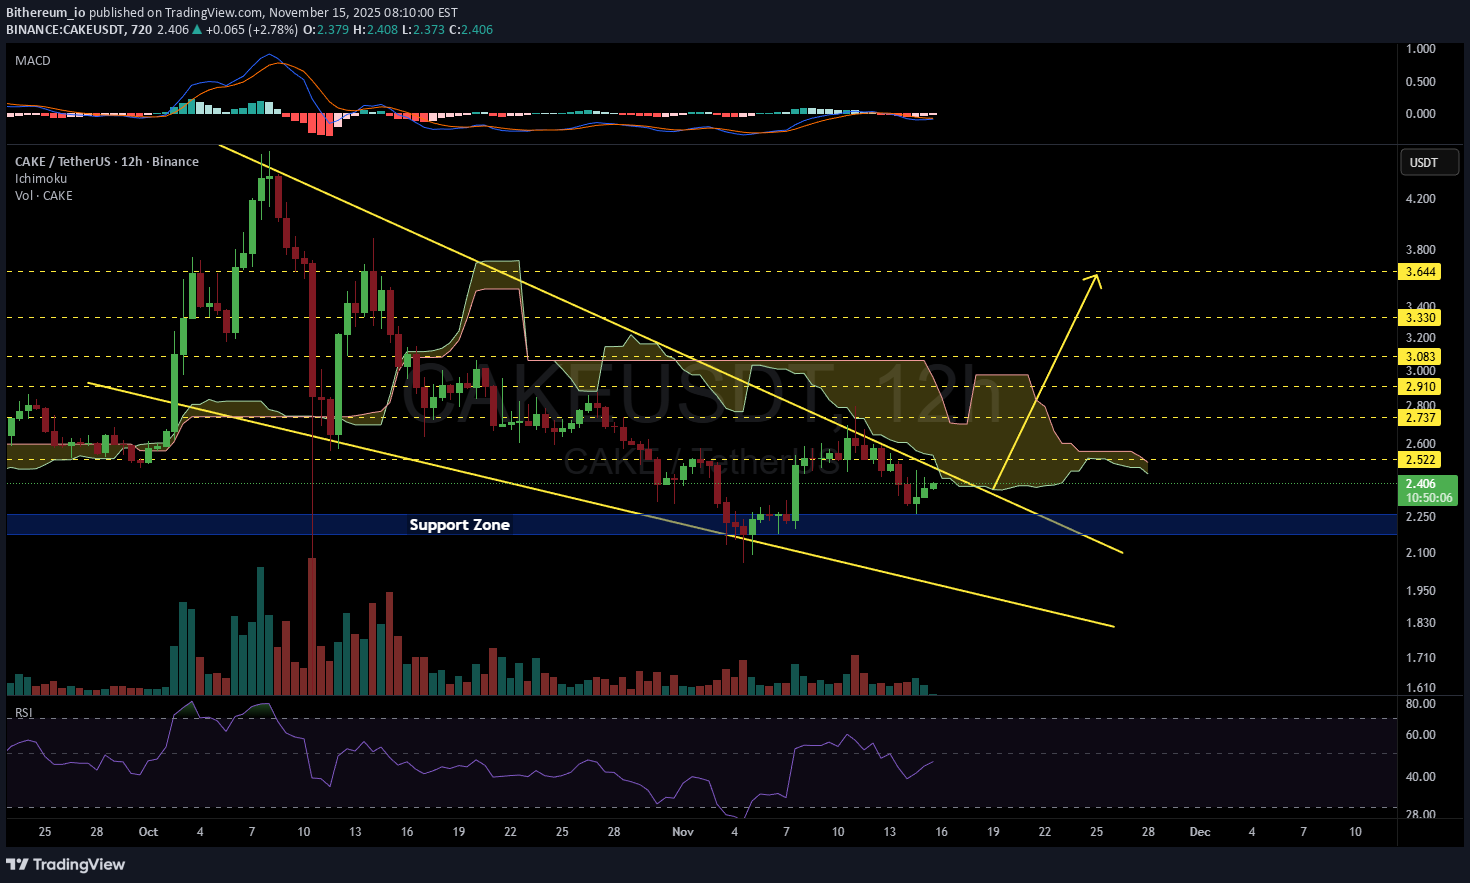
#CAKE is moving inside a falling wedge pattern on the 12H timeframe. Consider buying a small bag here, and since the Ichimoku cloud is also acting as resistance, place another buy order near the support zone. If the price breaks out above the wedge resistance, the potential upside targets are: 🎯 $2.522 🎯 $2.737 🎯 $2.910 🎯 $3.083 🎯 $3.330 🎯 $3.644 ⚠️ Always use a tight stop-loss and maintain proper risk management.

wijitha
تحلیل روند نزولی: رازهای تریدری که در بازار خرس برنده میشوند
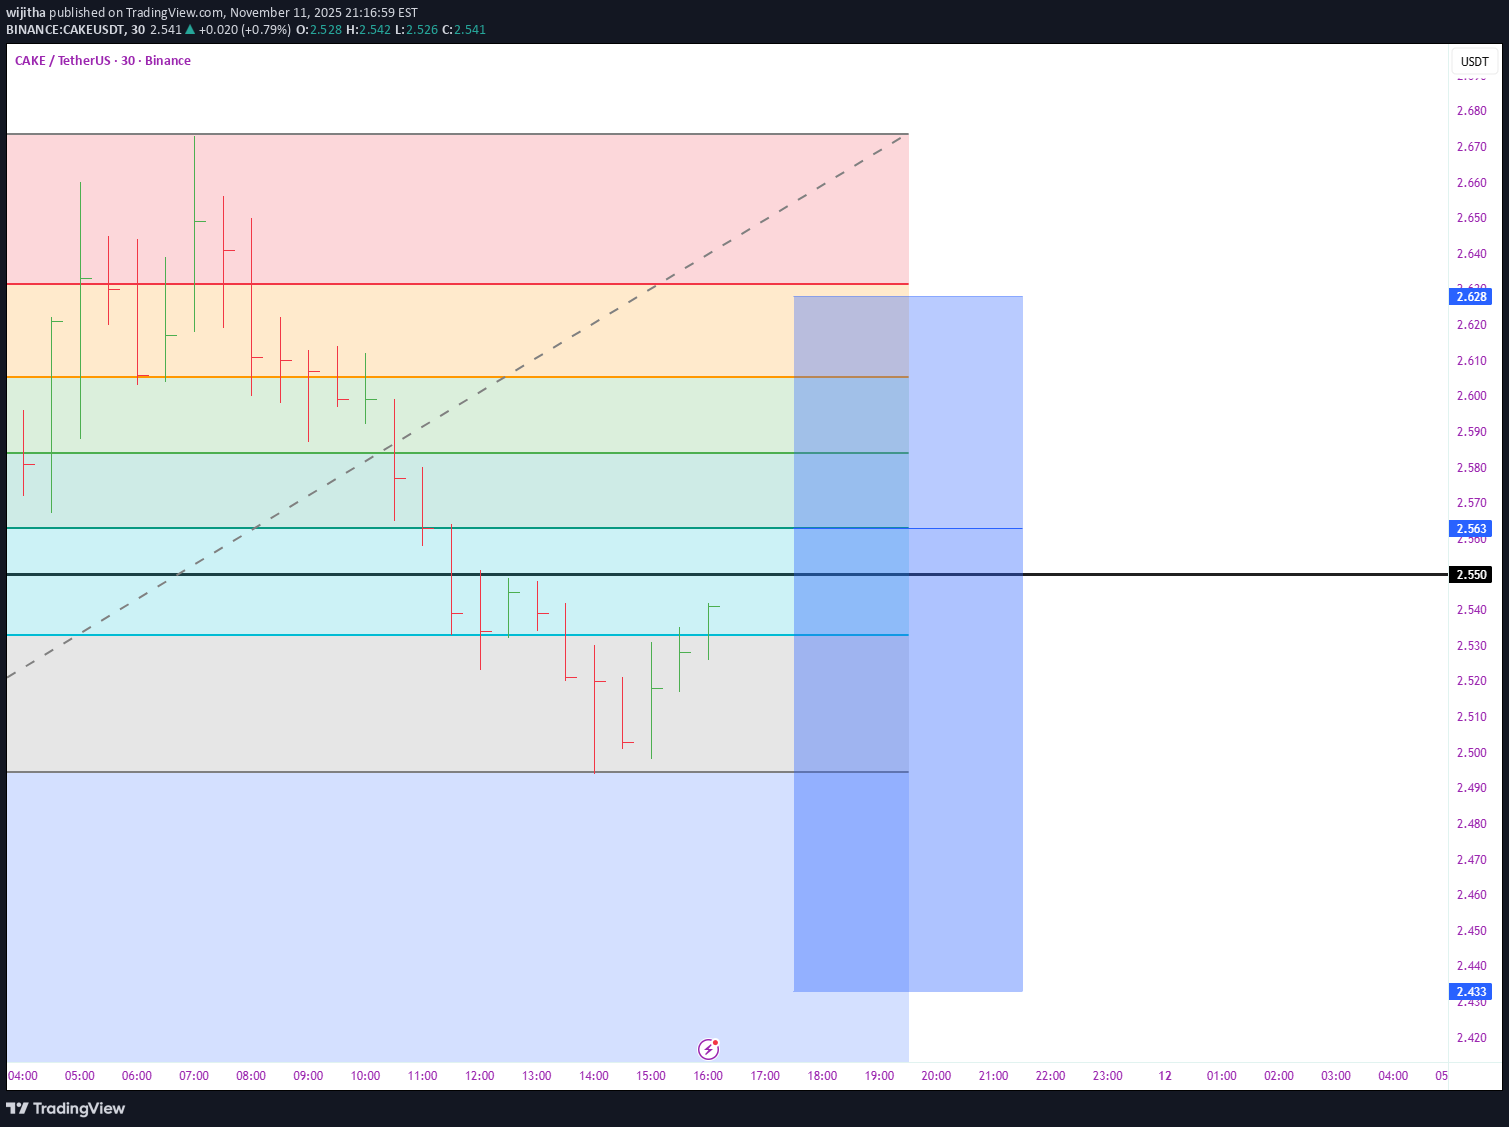
Bearish markets test the mettle of every trader—but they also sharpen strategy and reveal hidden potential. Success lies in recognizing resistance zones, anticipating trend shifts, and enforcing disciplined risk controls like stop-losses and diversified holdings. Staying informed on macroeconomic developments—such as fiscal policy, global trade dynamics, and central bank signals—adds a crucial layer of foresight. Rather than fearing downturns, seasoned traders view them as setups for future gains. With patience, adaptability, and a clear-eyed strategy, every dip becomes a stepping stone toward long-term resilience.

LexOsay
Disclaimer
Any content and materials included in Sahmeto's website and official communication channels are a compilation of personal opinions and analyses and are not binding. They do not constitute any recommendation for buying, selling, entering or exiting the stock market and cryptocurrency market. Also, all news and analyses included in the website and channels are merely republished information from official and unofficial domestic and foreign sources, and it is obvious that users of the said content are responsible for following up and ensuring the authenticity and accuracy of the materials. Therefore, while disclaiming responsibility, it is declared that the responsibility for any decision-making, action, and potential profit and loss in the capital market and cryptocurrency market lies with the trader.