
BRETT
Brett (Based)
| تریدر | نوع سیگنال | حد سود/ضرر | زمان انتشار | مشاهده پیام |
|---|---|---|---|---|
 CryptojobsRank: 32400 | خرید | حد سود: تعیین نشده حد ضرر: تعیین نشده | 1/6/2026 |
Price Chart of Brett (Based)
سود 3 Months :
سیگنالهای Brett (Based)
Filter
Sort messages by
Trader Type
Time Frame
Cryptojobs


SpyOnGems
تحلیل BRETT/USDT: در انتظار شکست خط نزولی چندماهه!

On the 8-hour chart, BRETT/USDT is clearly in a prolonged downtrend that has been respected for several months, shown by the strong descending trendline connecting the major lower highs. Price has continuously failed to break above this trendline, confirming persistent selling pressure and weak bullish strength. Recently, price is trading very close to this long-term resistance while also sitting near a short-term support zone around the 0.016–0.017 area, which shows compression and reduced volatility. This structure indicates that sellers are still in control, as each bounce has been capped below the trendline and no higher high has been formed. There is no confirmed trend reversal yet because market structure remains bearish and price is still below all major previous distribution levels. Overall, the chart reflects a market that is stabilizing at low levels but remains structurally bearish until a clear and sustained break above the descending trendline occurs with strong continuation.

CryptoNuclear
BRETT/USDT — Approaching the Break Point: Breakout or Breakdown
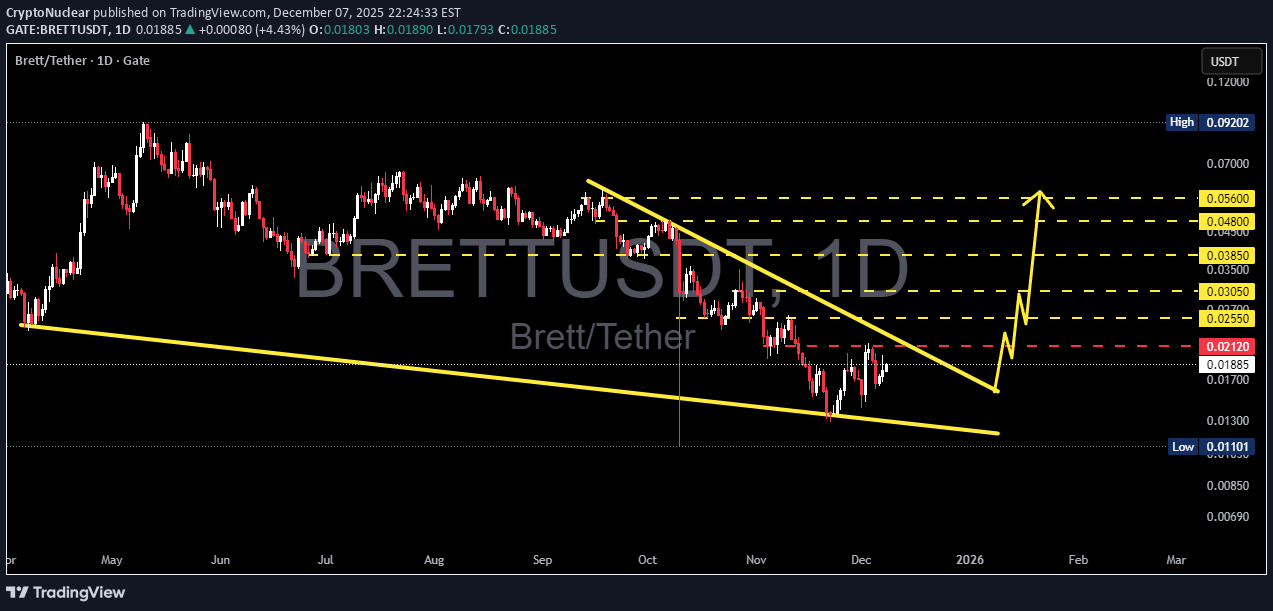
BRETT/USDT is approaching one of its most critical zones of the entire downtrend structure. After months of sustained bearish pressure under a persistent descending trendline, the market is now forming a large falling-wedge compression, a pattern that often precedes strong trend reversals when a breakout is confirmed. The chart shows a clear dynamic: Price continues to respect the descending resistance, while the lows begin stabilizing around a gradually flattening support zone. As these two structures narrow, the market is essentially coiling, building pressure before releasing its next major directional move. The key level to watch is 0.02120. This isn’t just another resistance—it's the decision point that separates a continuation of the downtrend from the first true structural shift toward bullish territory. A confirmed daily close above 0.02120, ideally supported by a volume expansion, would mark the first legitimate breakout from the multi-month wedge. If this happens, BRETT opens a wide path toward a series of upside targets: 0.02550 → 0.03050 → 0.03850 → 0.04800 → 0.05600. Each of these levels represents both structural and psychological checkpoints where momentum tends to accelerate once the wedge breaks. However, as long as price remains below 0.02120, bears still have control. A strong rejection at this level could trigger renewed sell pressure, dragging price back toward the mid-support zone at 0.013–0.014, or even a retest of the major low around 0.01101 if sentiment weakens. BRETT is now in its compression phase, often the calm before a significant move. Conservative traders will wait for a confirmed breakout, while aggressive price-action traders may already be watching for early signals in volume and candle structure. In short: The market is quiet— not because it's dead, but because it's preparing for a major decision. And that decision will be dictated by the battle around 0.02120. --- Bullish Scenario If 0.02120 breaks with confirmation: Trend shifts from bearish → neutral → bullish. Targets unlock sequentially: 0.0255 → 0.0305 → 0.0385 → 0.0480 → 0.0560. Expect momentum acceleration as the wedge breakout gains participation. Validation: strong daily candle close + higher-than-average 7-day volume. --- Bearish Scenario If 0.02120 rejects strongly: Market falls back into distribution. Downside targets: 0.014 → 0.011. A breakdown below 0.011 may create new cycle lows and extend the bearish trend. #BRETT #BRETTUSDT #CryptoAnalysis #BreakoutWatch #FallingWedge #PriceAction #TrendReversal #KeyLevels #CryptoOutlook #MarketStructure

Crypto-by-PRIME
CryptoNuclear
آیا پایان نزول طولانی مدت BRETT/USDT نزدیک است؟ تحلیل حیاتی!

The 3D chart of BRETT/USDT is currently sitting at a critical juncture — right where a major horizontal support zone meets a long-term descending trendline. This setup reflects the classic “moment of truth” in technical analysis — a key crossroads between a potential trend reversal or a continuation of bearish momentum. At the time of analysis, the price is around 0.02639 USDT, positioned inside the strong demand zone at 0.022–0.0265, which has historically acted as a major accumulation area. The long wick down to 0.01101 indicates a possible liquidity sweep — a typical signal that weak hands have been flushed out, often followed by a relief rally or reversal phase. However, the descending trendline continues to act as a strong dynamic resistance, compressing every attempt of upward momentum. As long as this trendline holds, sellers remain in control — but the persistence of this support zone suggests the potential for a major reversal base. --- Pattern & Structure Overview Main Pattern: Descending Triangle — lower highs compressing against a flat support line. While this pattern traditionally leans bearish, a failed breakdown from it can trigger a strong bullish reversal. Liquidity Sweep (0.011): A deep wick likely cleared stop-loss clusters, meaning liquidity below support may already be exhausted. Descending Trendline: Acts as the psychological “barrier” — a clean breakout above it could trigger a short squeeze. Momentum: Seller pressure is slowing down near the support area; watch for increasing volume as a sign of accumulation. --- Bullish Scenario (Reversal Potential) If buyers continue to defend the 0.022–0.0265 zone, the market could be forming a structural bottom. A bullish confirmation would require: 1. A clear break and 3D close above the descending trendline (around 0.03866). 2. A visible increase in trading volume, signaling strong buying participation. 3. Formation of a higher low above 0.026, confirming a shift in market structure. Bullish Targets: 0.03866 → first breakout target 0.06305 → medium-term resistance 0.07784 → confirmation of full reversal 0.15278+ → potential expansion target if bullish momentum extends --- Bearish Scenario (Breakdown Continuation) If the price fails to hold above 0.022, especially with a confirmed 3D or weekly close below it: Expect a continuation of the current distribution phase. The market could retest the liquidity area near 0.011, or even form new lows if sell volume spikes. Bearish Targets: 0.017–0.013 → potential short-term reaction zone. Below 0.011 → opens the door for a deeper capitulation phase. --- Conclusion BRETT is currently standing on its final line of defense. The 0.022–0.0265 zone is not just a regular support — it’s the stronghold for bulls and a potential entry point for smart money accumulation. A breakout above the trendline could mark the beginning of a major trend reversal, while a breakdown below support could confirm a new leg down. Given the current structure, BRETT is one of the most technically interesting assets to watch in the upcoming quarter — both for swing traders and long-term players. --- #BRETT #CryptoAnalysis #MarketReversal #TrendlineBreak #CryptoTrading #SupportZone #BreakoutSetup #Downtrend #TechnicalAnalysis #SwingTrade #SmartMoney #LiquiditySweep
CryptoNuclear
BRETT/USDT در آستانه انفجار قیمتی؟ تحلیل مثلث فشردگی و نقاط ورود/خروج کلیدی

🔎 Pattern Analysis BRETT/USDT is currently trading inside a contracting triangle (descending resistance + flat/rising support). This pattern shows: Lower Highs: sellers consistently pressing the price lower. Higher Lows / Flat Support: buyers holding the floor strongly. The market is in a “pressure cooker” phase — volatility is shrinking, and once price escapes, the move is usually explosive. Technically, a symmetrical triangle is neutral, but since the prior trend was bearish, probabilities lean slightly bearish unless a breakout to the upside is confirmed with strong volume. --- 📈 Bullish Scenario If price breaks upward: 1. Trigger: 2D candle close above 0.05617 with strong volume. 2. Healthy Retest: price pulls back to confirm support and then bounces. 3. Upside Targets: TP1: 0.06472 (+44%) TP2: 0.07961 (+77%) TP3: 0.09073 (+102%) TP4: 0.11532 (+156%) TP5 (measured move / extension): 0.130–0.150 (strong momentum case). 4. Psychology: breakout means buyers take control, and if BTC/ETH are stable or bullish, momentum could accelerate. --- 📉 Bearish Scenario If price breaks downward: 1. Trigger: 2D candle close below 0.038–0.040 with strong volume. 2. Failed Retest: price retests support turned resistance and rejects. 3. Downside Targets: TP1: 0.03400 TP2: 0.03000 TP3: 0.02340 (major low, nearly −48% downside). 4. Psychology: breakdown signals capitulation — sellers dominate while buyers step aside. --- 🎯 Measured Move Applying the height of the triangle gives a projected target: Upside breakout: 0.11 – 0.13 Downside breakdown: 0.023 – 0.025 --- ⚖️ Risk & Money Management Confirmation is key: wait for a 2D close + volume, not just intraday wicks. Stop Loss: For longs → below triangle support / under 0.039. For shorts → above triangle resistance / above 0.056. Risk/Reward: aim for at least 1:2 before entering. Position sizing: risk only 1–2% of total capital per trade. --- 🚨 Key Catalysts to Watch 1. Bitcoin & Ethereum trend: if BTC dumps, alts usually follow. 2. Liquidity/volume: thin order books risk false breakouts. 3. News/events: project updates, listings, or partnerships can be catalysts. 4. Macro market: US equities, Fed policy, and the Dollar Index (DXY) often influence crypto capital flows. --- 📝 Summary BRETT/USDT is compressing inside a 2D contracting triangle, and volatility is set to expand. Bullish trigger: 2D close >0.05617 + volume → targets 0.0647 / 0.0796 / 0.0907 / 0.115–0.13. Bearish trigger: 2D close <0.038–0.040 → targets 0.034 → 0.030 → 0.0234. Golden rule: wait for confirmation (2D close + strong volume) to avoid false breaks. This setup provides a clear trading map with defined upside/downside levels, offering opportunities in both directions. --- #BRETT #BRETTUSDT #Crypto #Altcoin #TechnicalAnalysis #TrianglePattern #Breakout #SupportResistance #CryptoTrading

Filnft
Cryptojobs
BRETT - TECHNICAL OUTLOOK
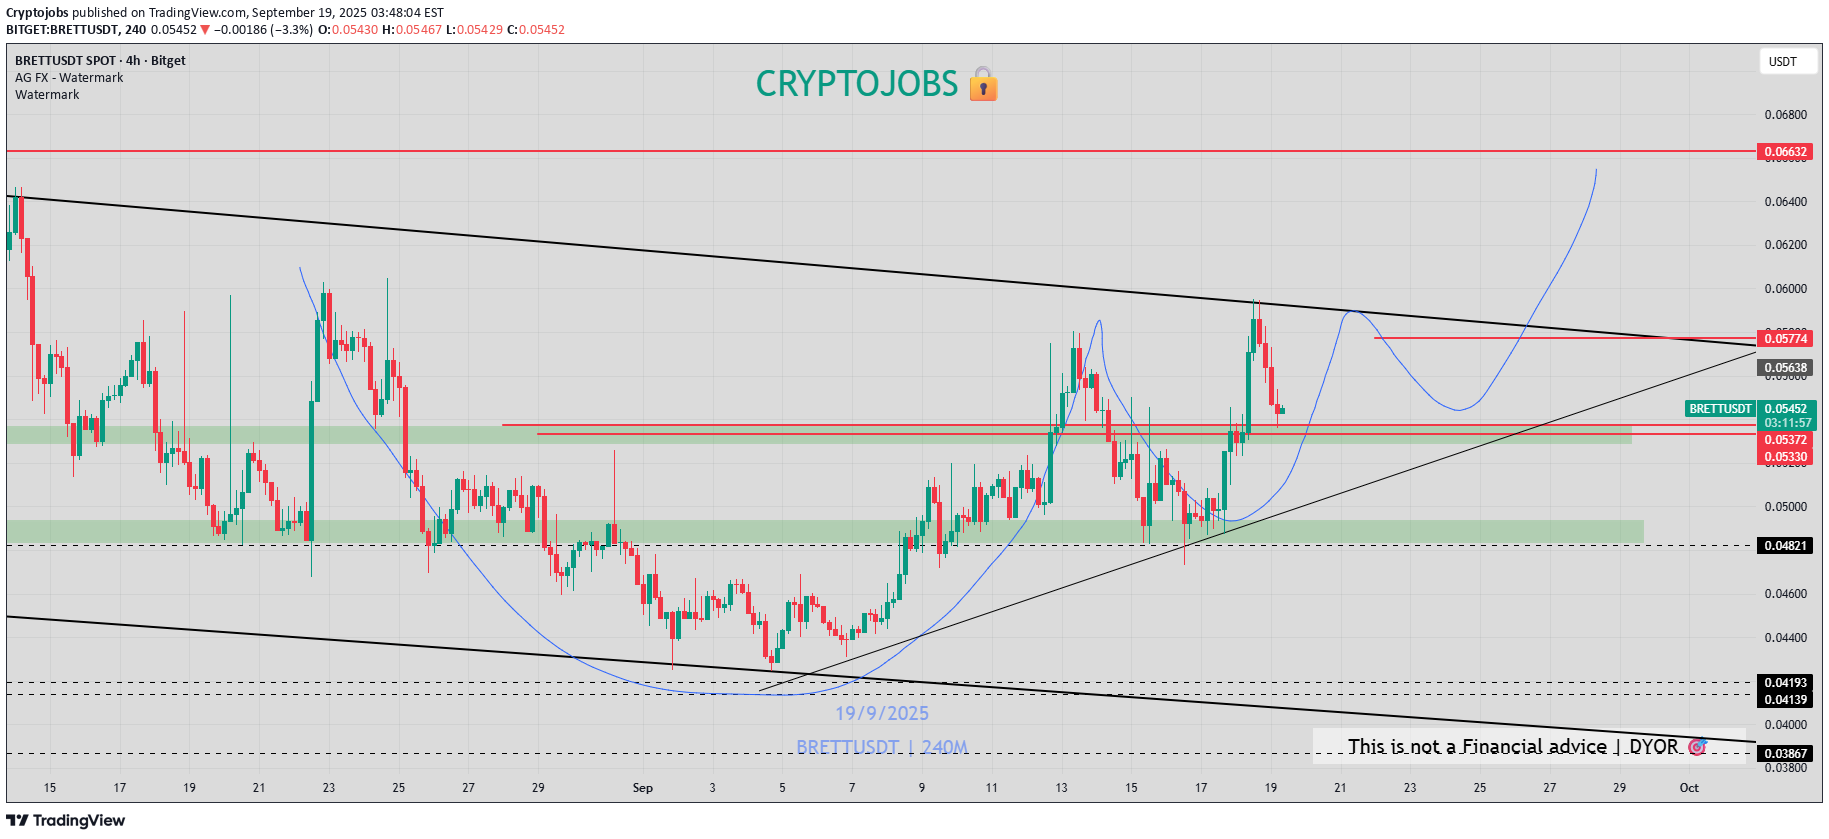
$BRETT - Price Analysis 🔍 🟨 Neutral vibes on the daily chart right now. The price is still stuck below that key $0.05800 weekly resistance, bulls just can’t break through yet! 🚦 Green light only if we close and consolidate above $0.05800. That’s the level to watch for any real breakout and bullish momentum. Local support: $0.0530 - 0.05350 [Bull retest?] The 4H structure? Actually looking pretty decent – could be setting up for a bullish consolidation here. But let’s not get too excited yet: any move under resistance is just noise. TLDR: 🔸Major resistance: $0.05800 (weekly) 🚧 🔸Potential support: Recent local lows 🔸Bias: Cautious until a clear breakout #TA #TradingView #BRETT

HexaTrades
BRETTUSDT – Symmetrical Triangle Breakout!
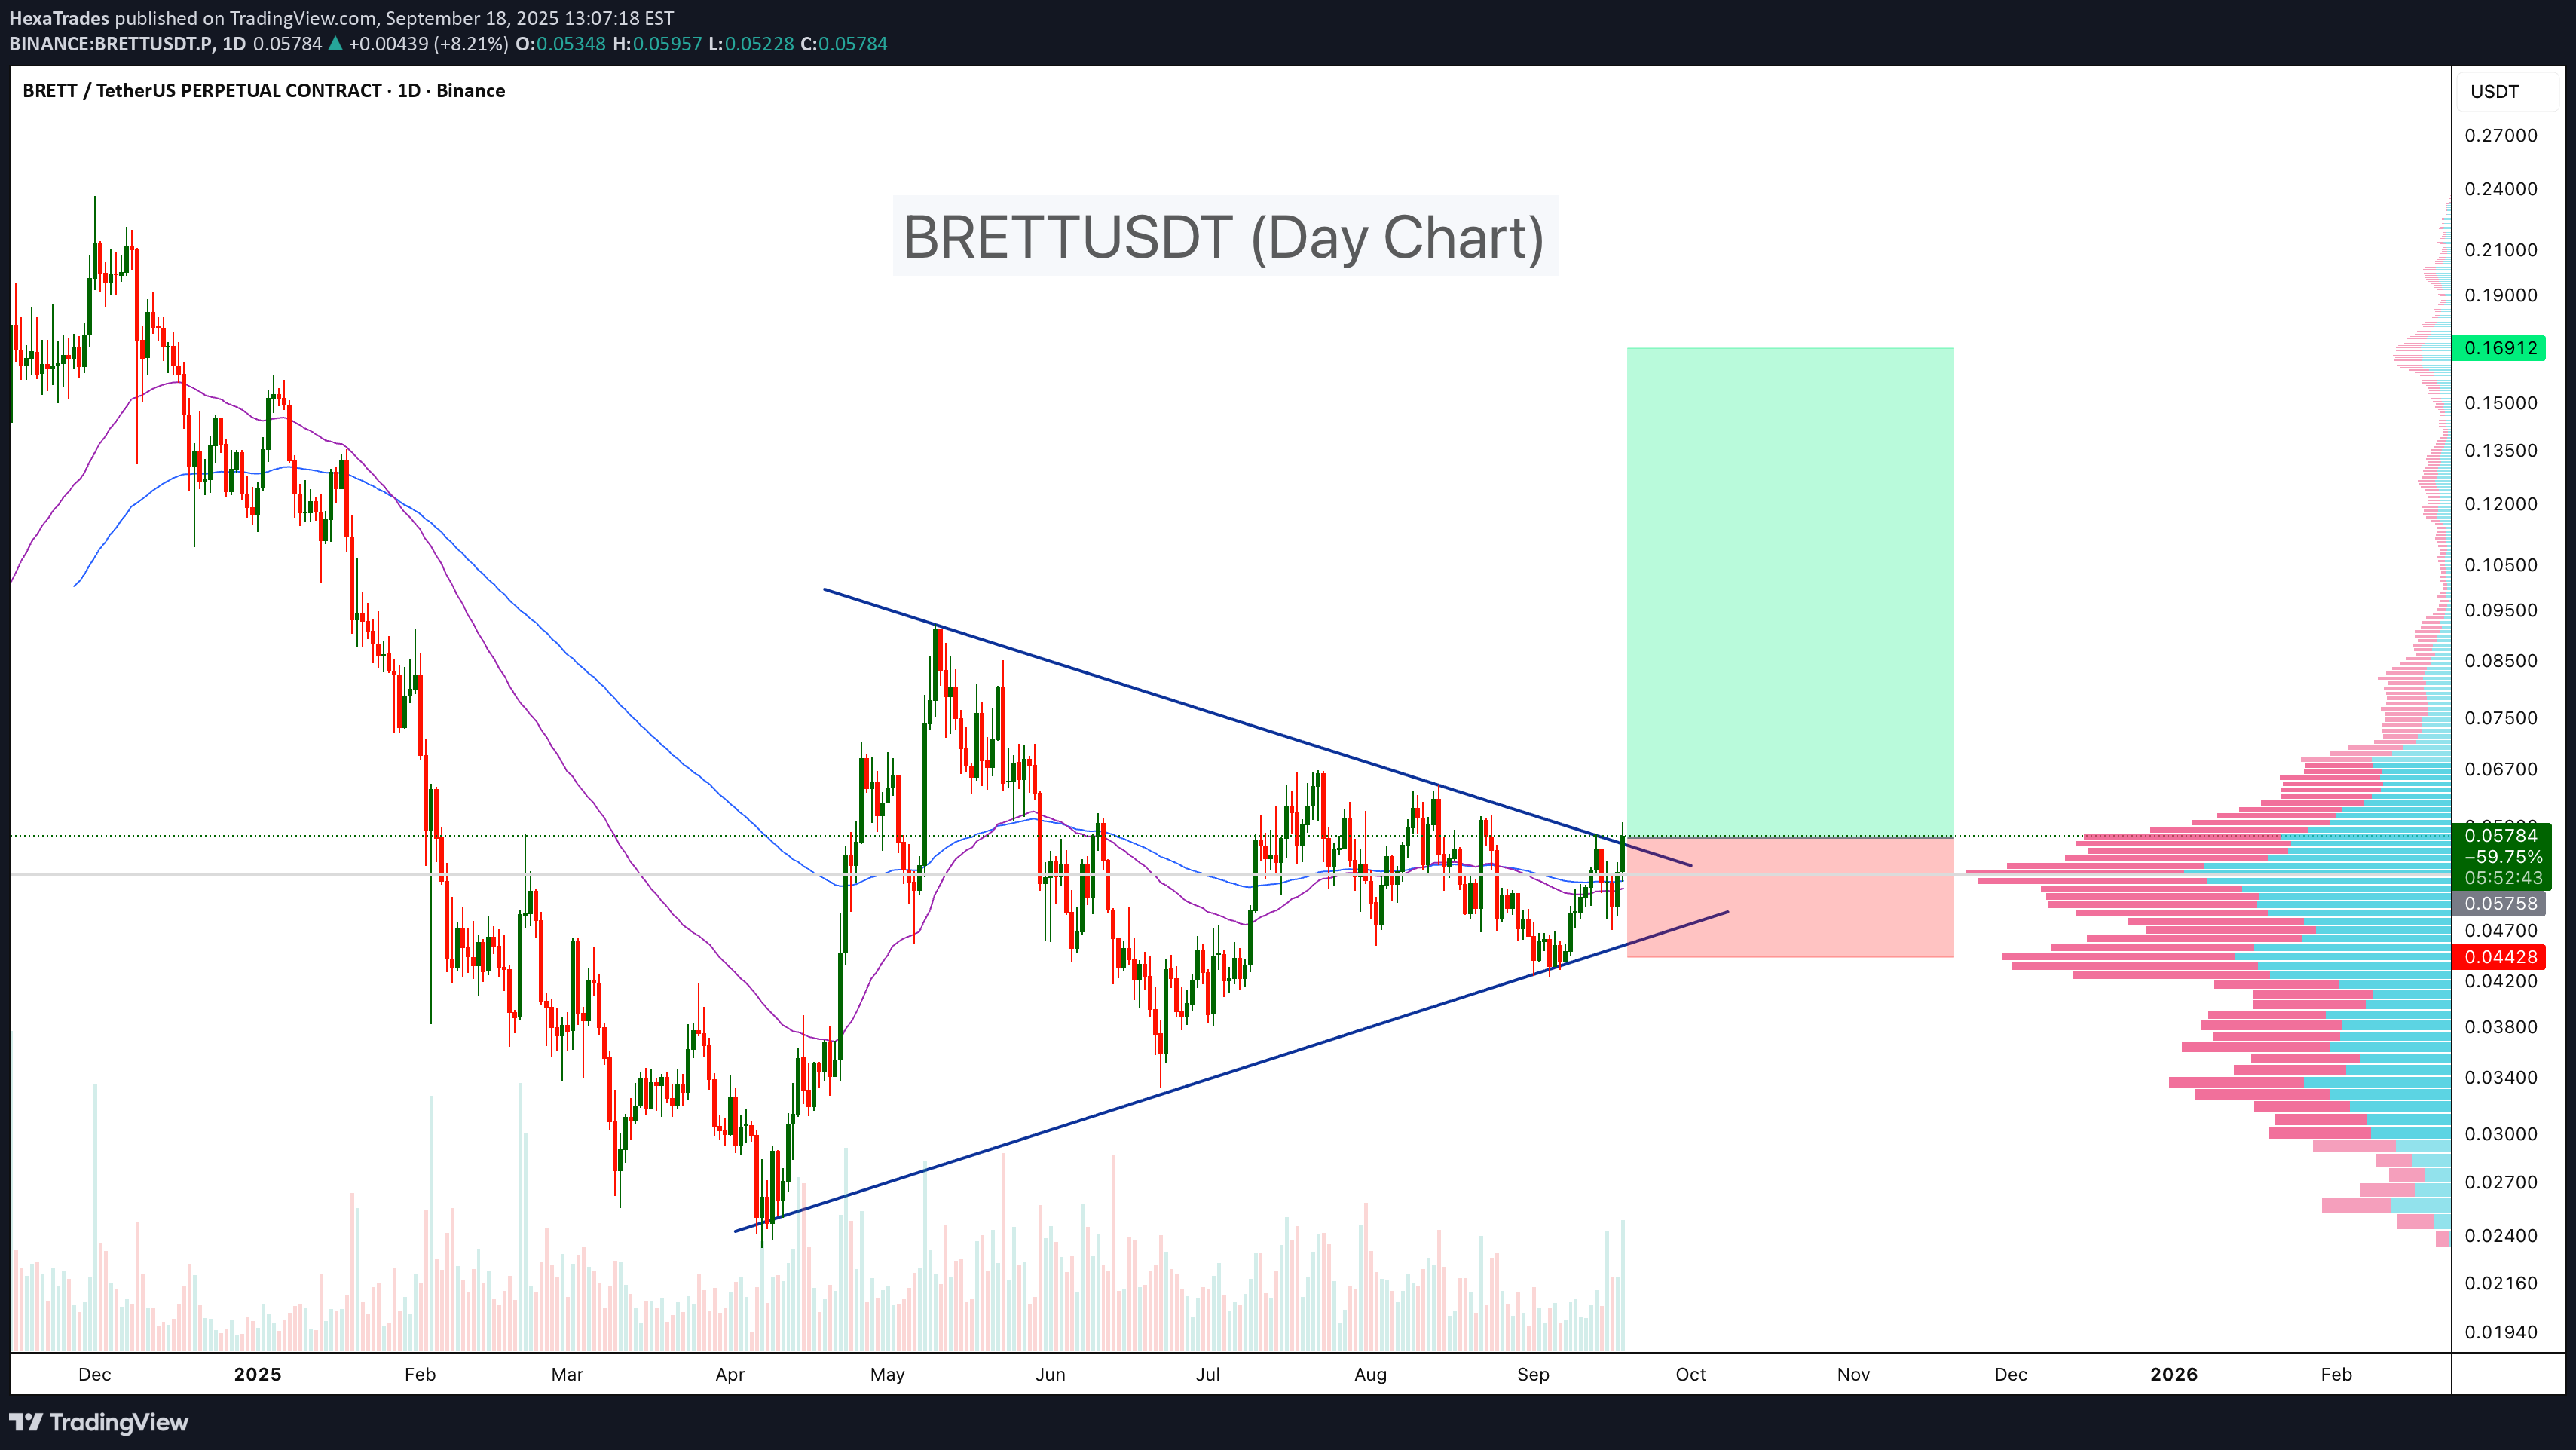
BRETTUSDT has been consolidating within a symmetrical triangle for several months, showing strong compression between ascending support and descending resistance. Recently, price action has started to break above the resistance trendline, signaling a possible bullish continuation. With moving averages turning supportive and volume profile showing a low-resistance zone above, this breakout could trigger a strong move higher. Key Points: - Pattern: Symmetrical triangle consolidation since April. - Support: Strong base around 0.045 USDT (stop-loss zone). - Resistance Breakout: Price breaking above 0.058 level. - Volume Profile: Thin liquidity gap above, could accelerate upside. - Target Zone: 100%-200% move in midterm - Moving Averages: Price reclaiming 50 & 100 EMA, confirming bullish momentum. Cheers Hexa
Crypto-by-PRIME
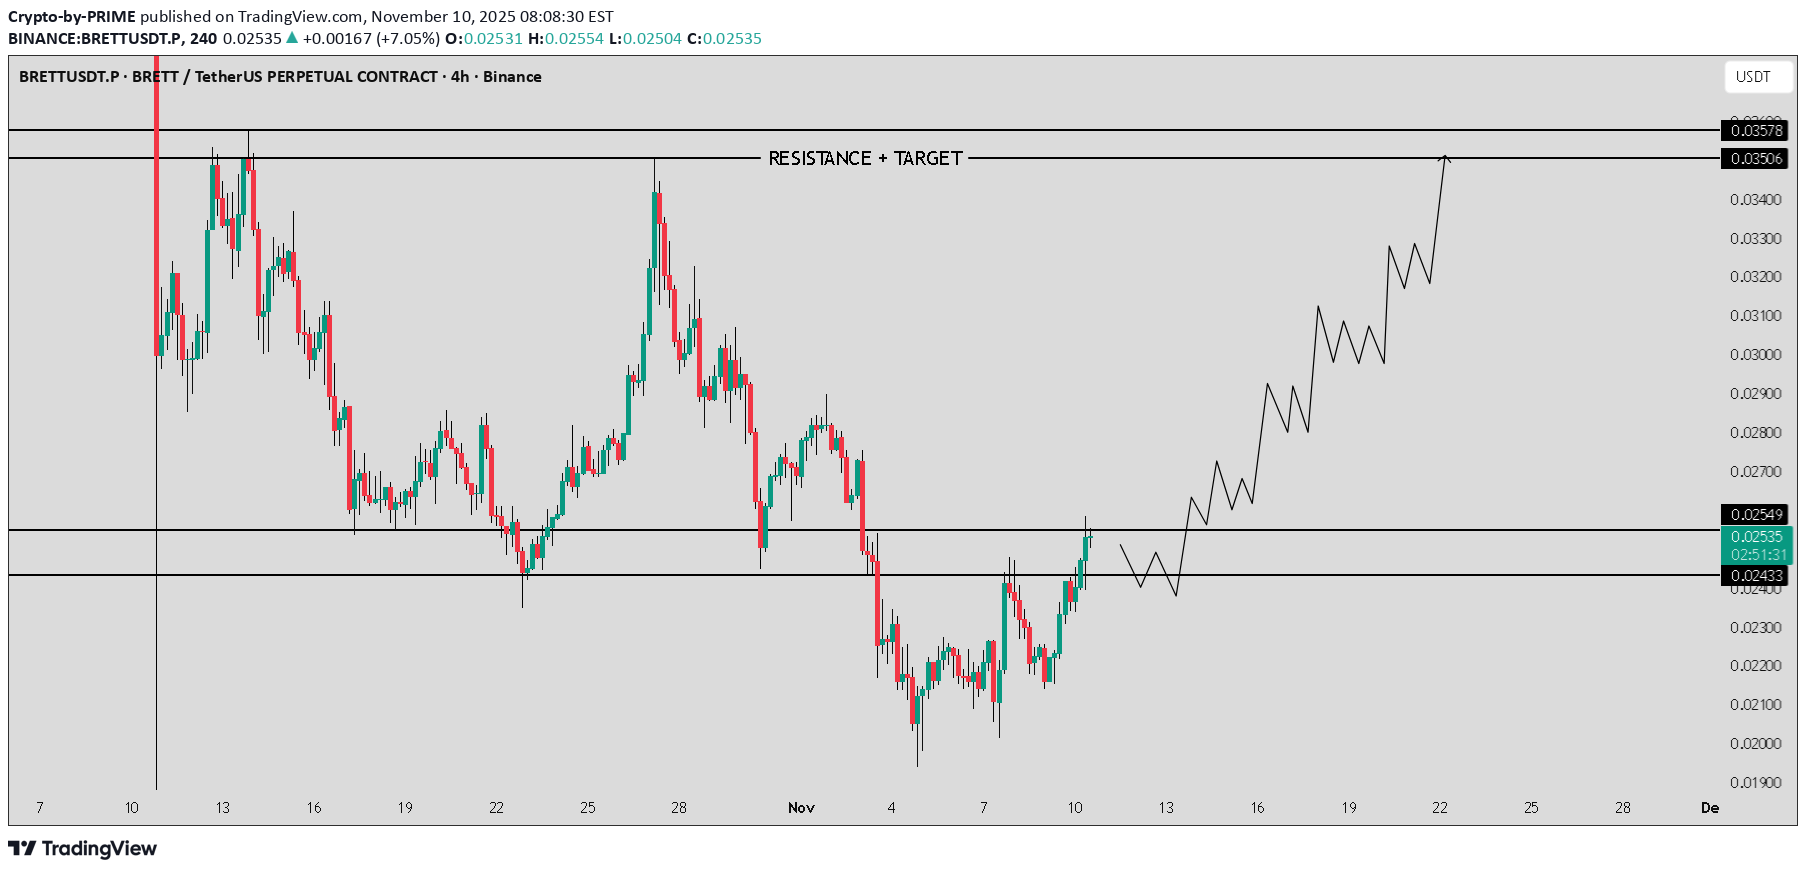
BRETT / USDT : Breaking out from symmetrical triangle
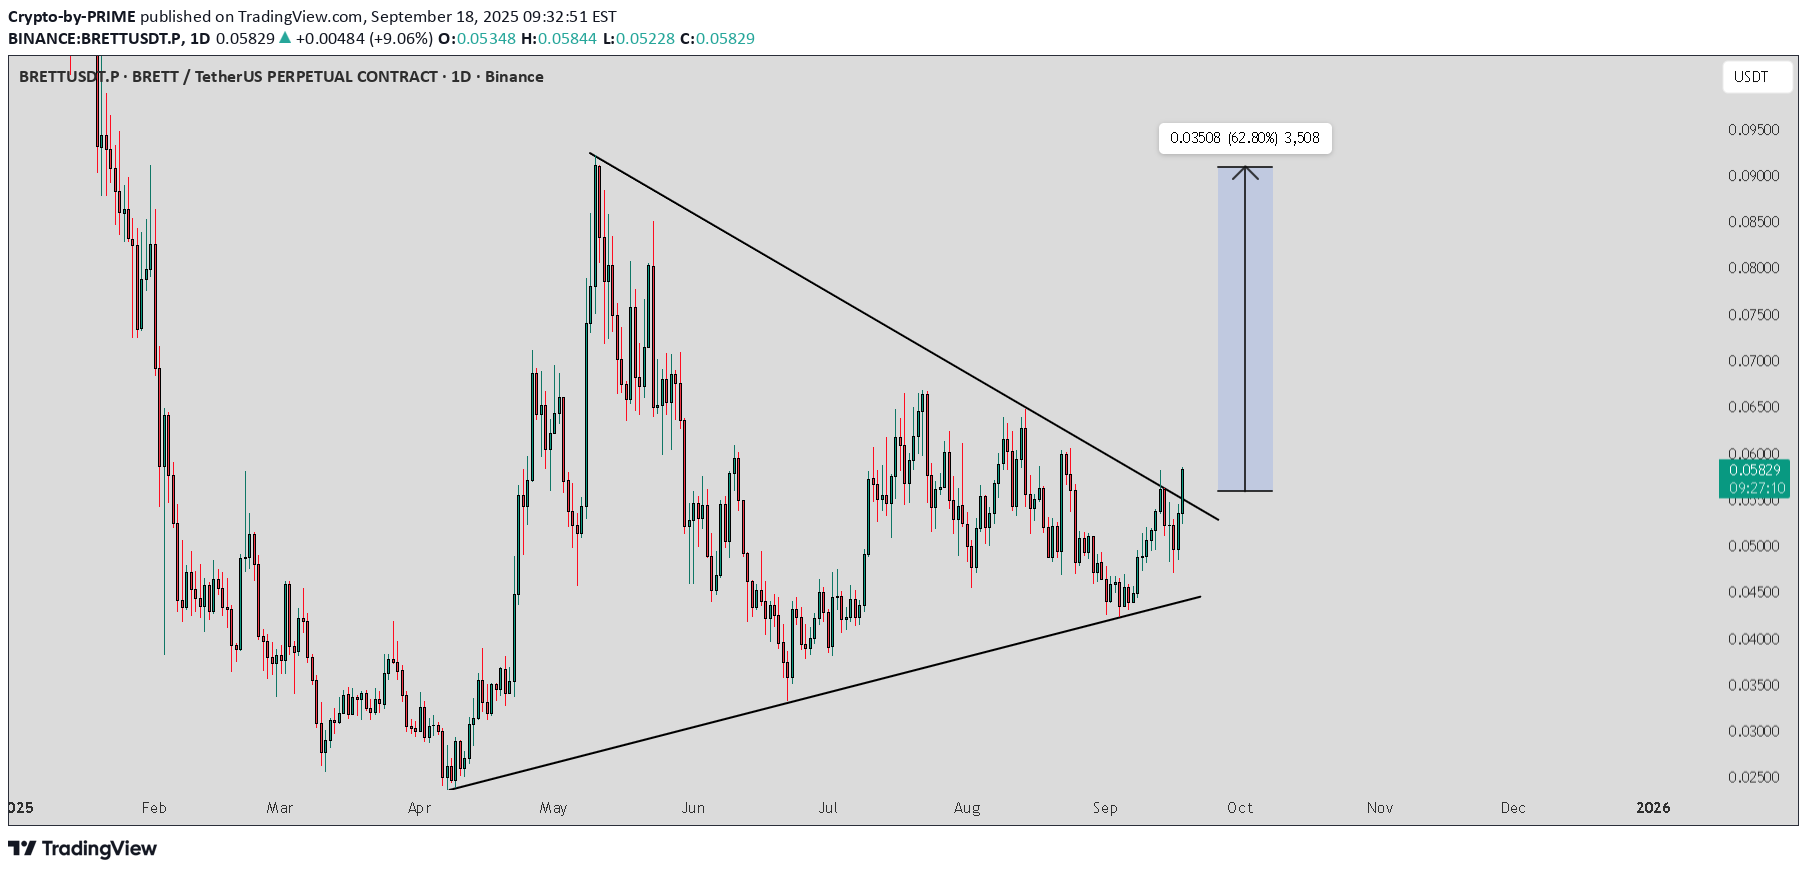
BRETT / USDT is breaking out from the symmetrical triangle. If this breakout holds, we could see a strong rally towards $0.085 – $0.095 in the short term. Always wait for confirmation and manage risk properly.
Disclaimer
Any content and materials included in Sahmeto's website and official communication channels are a compilation of personal opinions and analyses and are not binding. They do not constitute any recommendation for buying, selling, entering or exiting the stock market and cryptocurrency market. Also, all news and analyses included in the website and channels are merely republished information from official and unofficial domestic and foreign sources, and it is obvious that users of the said content are responsible for following up and ensuring the authenticity and accuracy of the materials. Therefore, while disclaiming responsibility, it is declared that the responsibility for any decision-making, action, and potential profit and loss in the capital market and cryptocurrency market lies with the trader.