
BERA
Berachain
| تریدر | نوع سیگنال | حد سود/ضرر | زمان انتشار | مشاهده پیام |
|---|---|---|---|---|
No results found. | ||||
Price Chart of Berachain
سود 3 Months :
سیگنالهای Berachain
Filter
Sort messages by
Trader Type
Time Frame

Artem_Dishel
تحلیل تکنیکال BERAUSDT: منتظر شکست مقاومت ۱.۰۷۸ برای ورود به معامله خرید (لانگ) باشید!
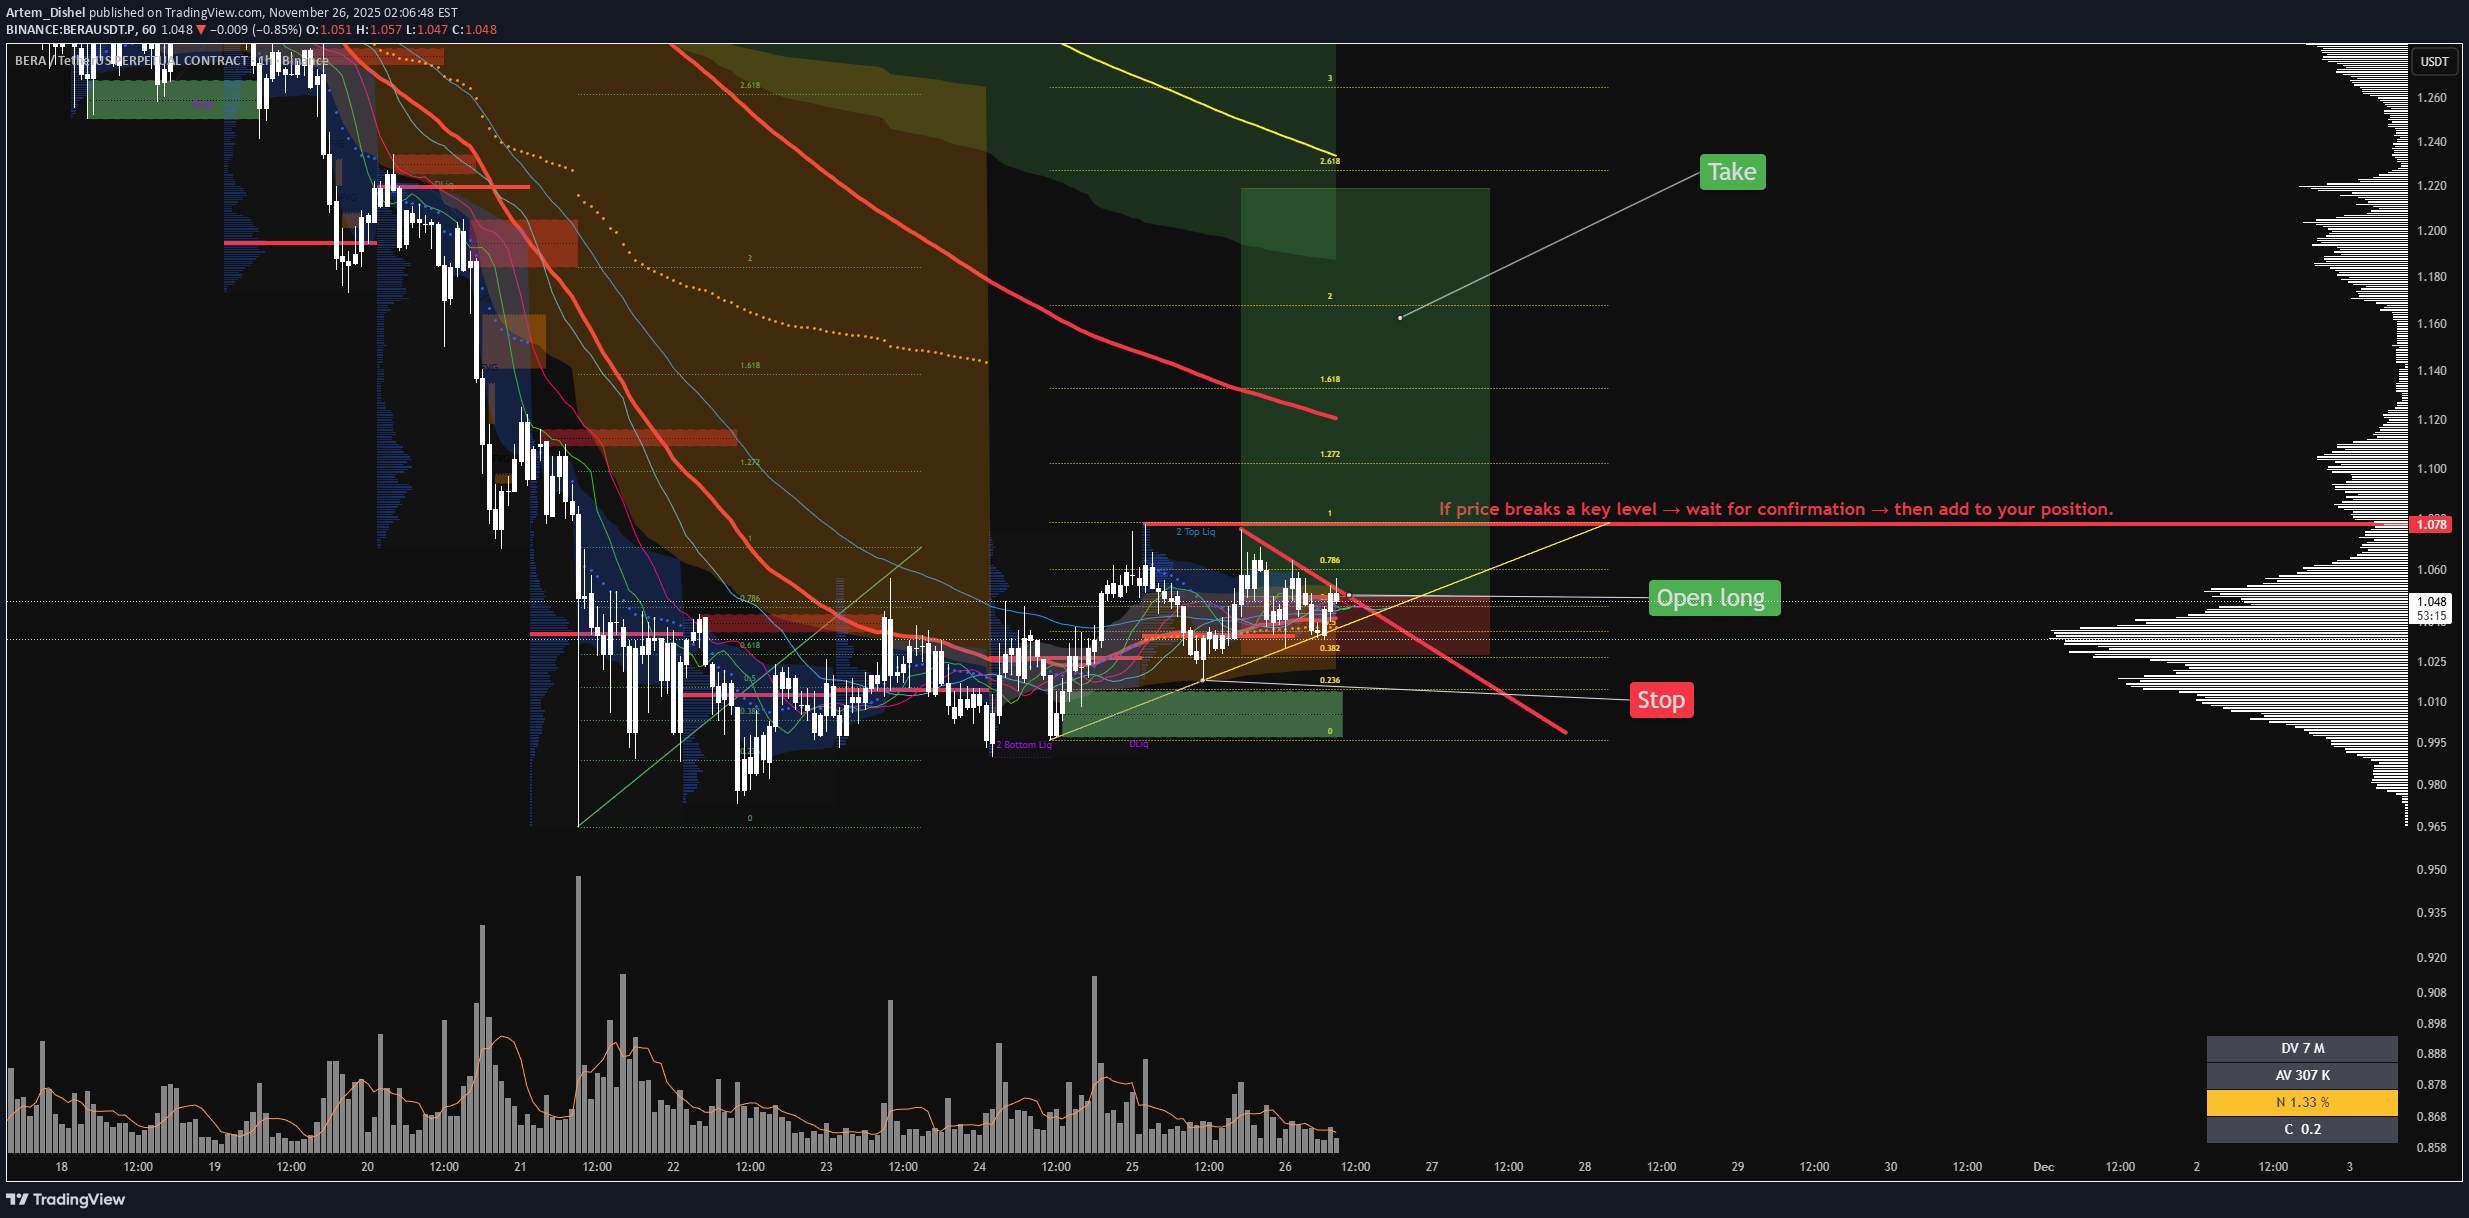
Market Update: Price is compressing under a key resistance at 1.078. This level will decide the next strong move. 🟢 Bullish scenario If price breaks and closes above 1.078, then retests it → long continuation possible. Targets: 1.150 → 1.180 → 1.230 (main) → 1.270 🔴 Bearish scenario If 1.078 rejects again → price may drop back to 1.02 and possibly 0.95–0.97. ➡️ Summary Market is neutral until 1.078 breaks. Breakout = long opportunity. Rejection = short-term pullback.

Stan_Leimanis
تحلیل تکنیکال: آیا بازار در سراشیبی است؟ منتظر حرکت بزرگ بازار هستیم!
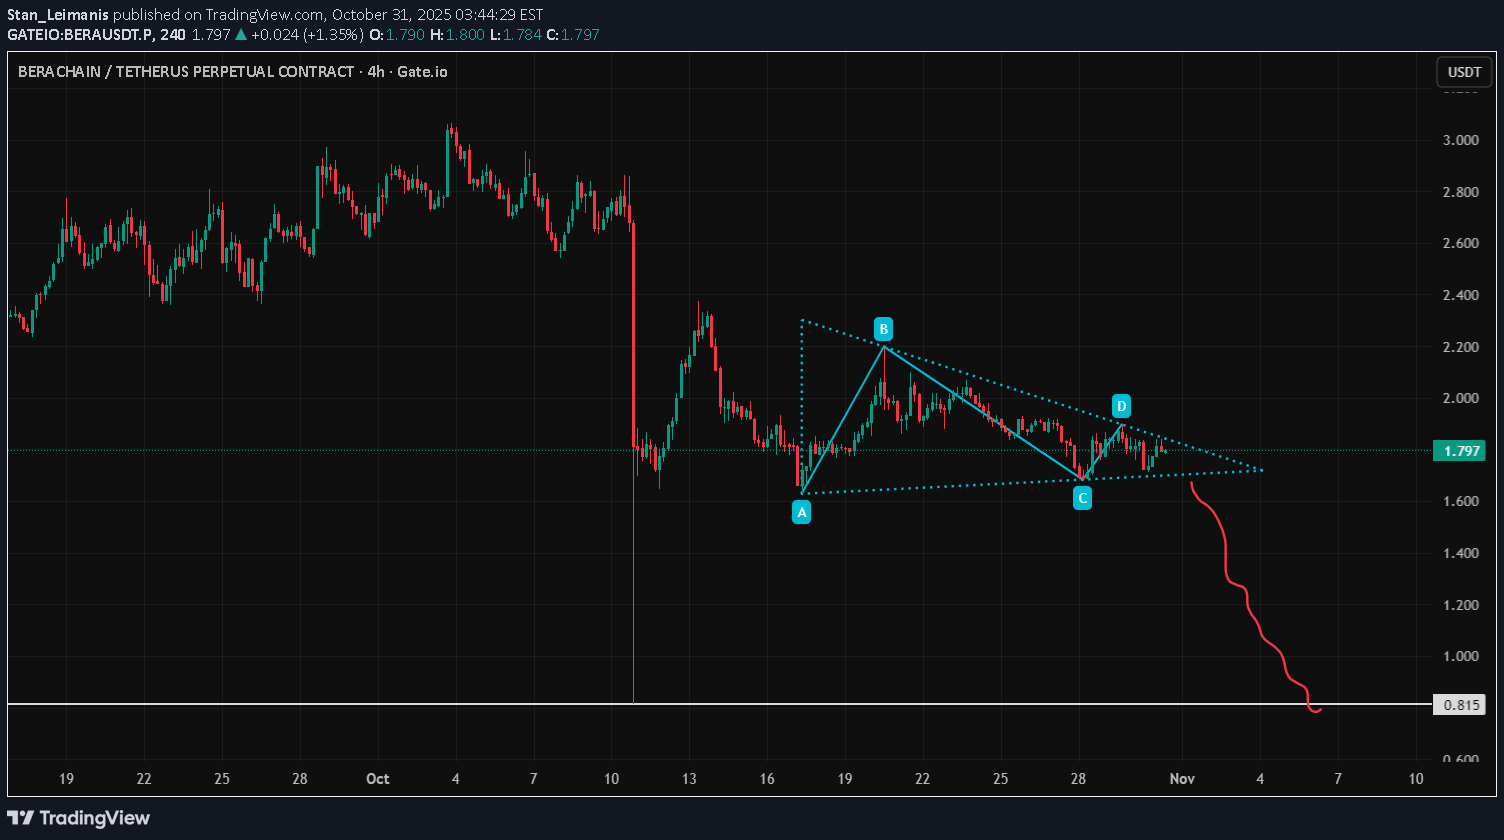
Logically, this set up looks bearish to me. But let's see what MM will do.

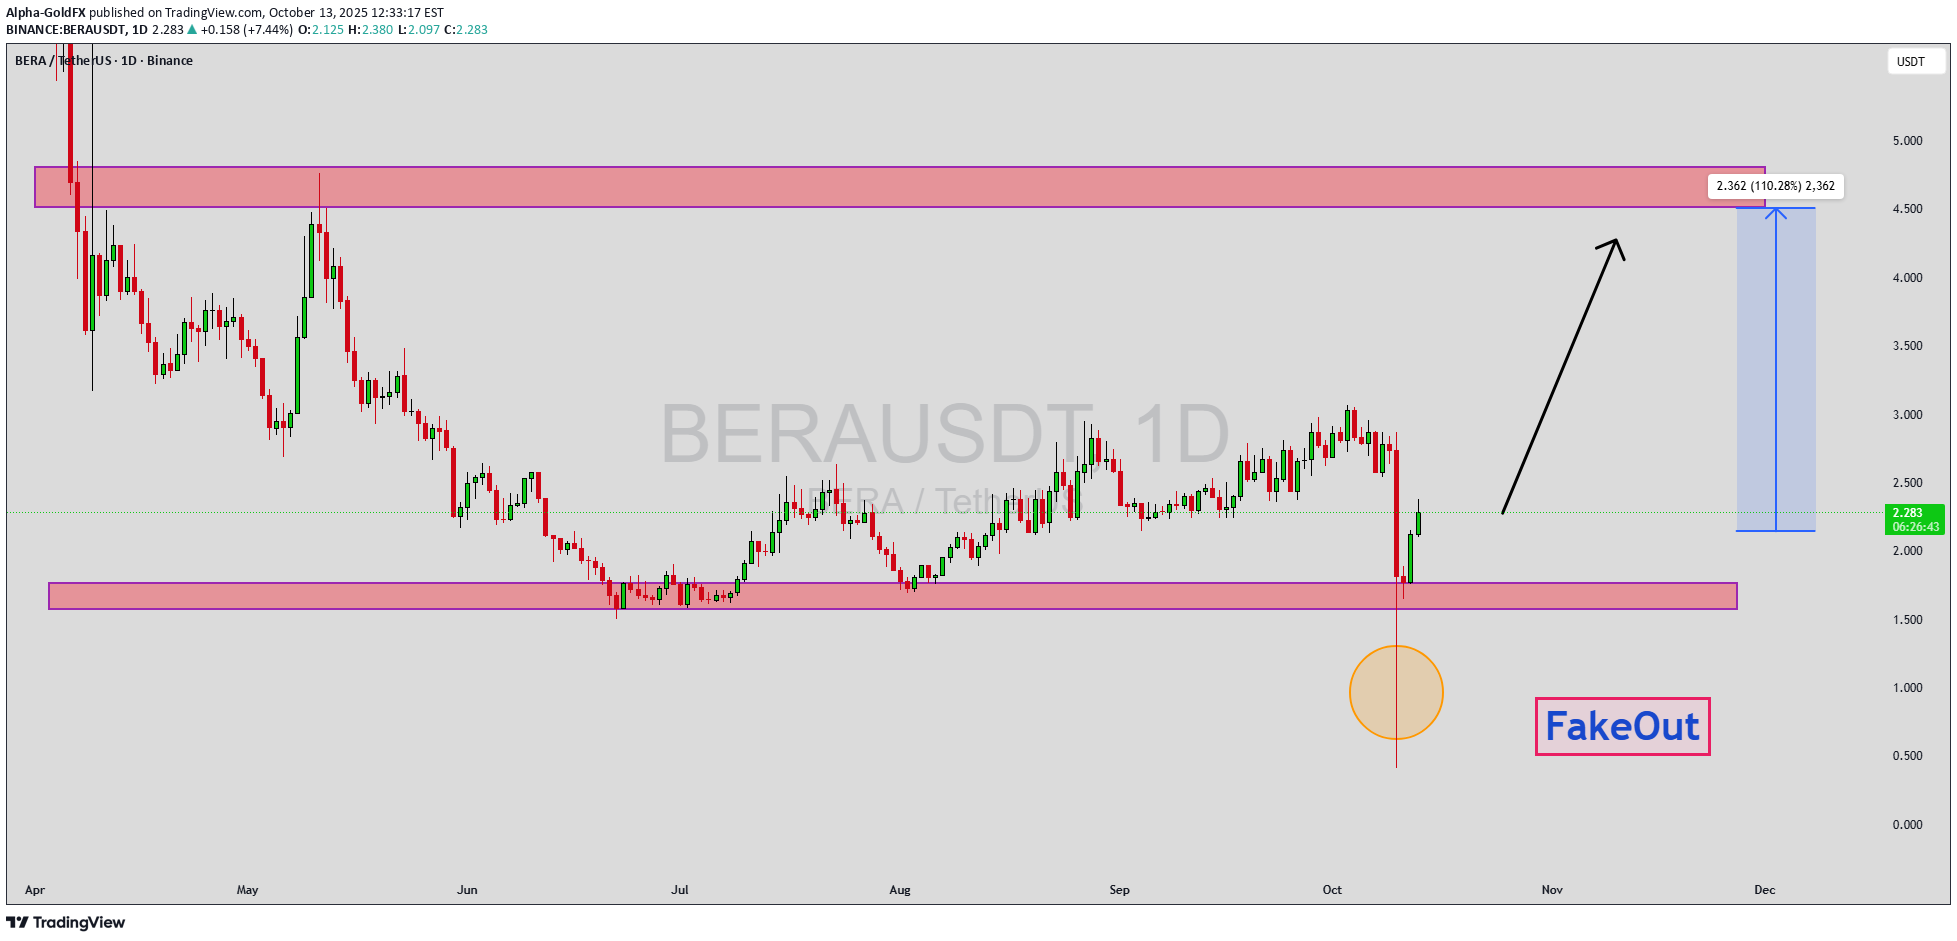
Alpha-GoldFX
انفجار قیمتی BERAUSDT در راه است؟ پیشبینی سود 100 درصدی!
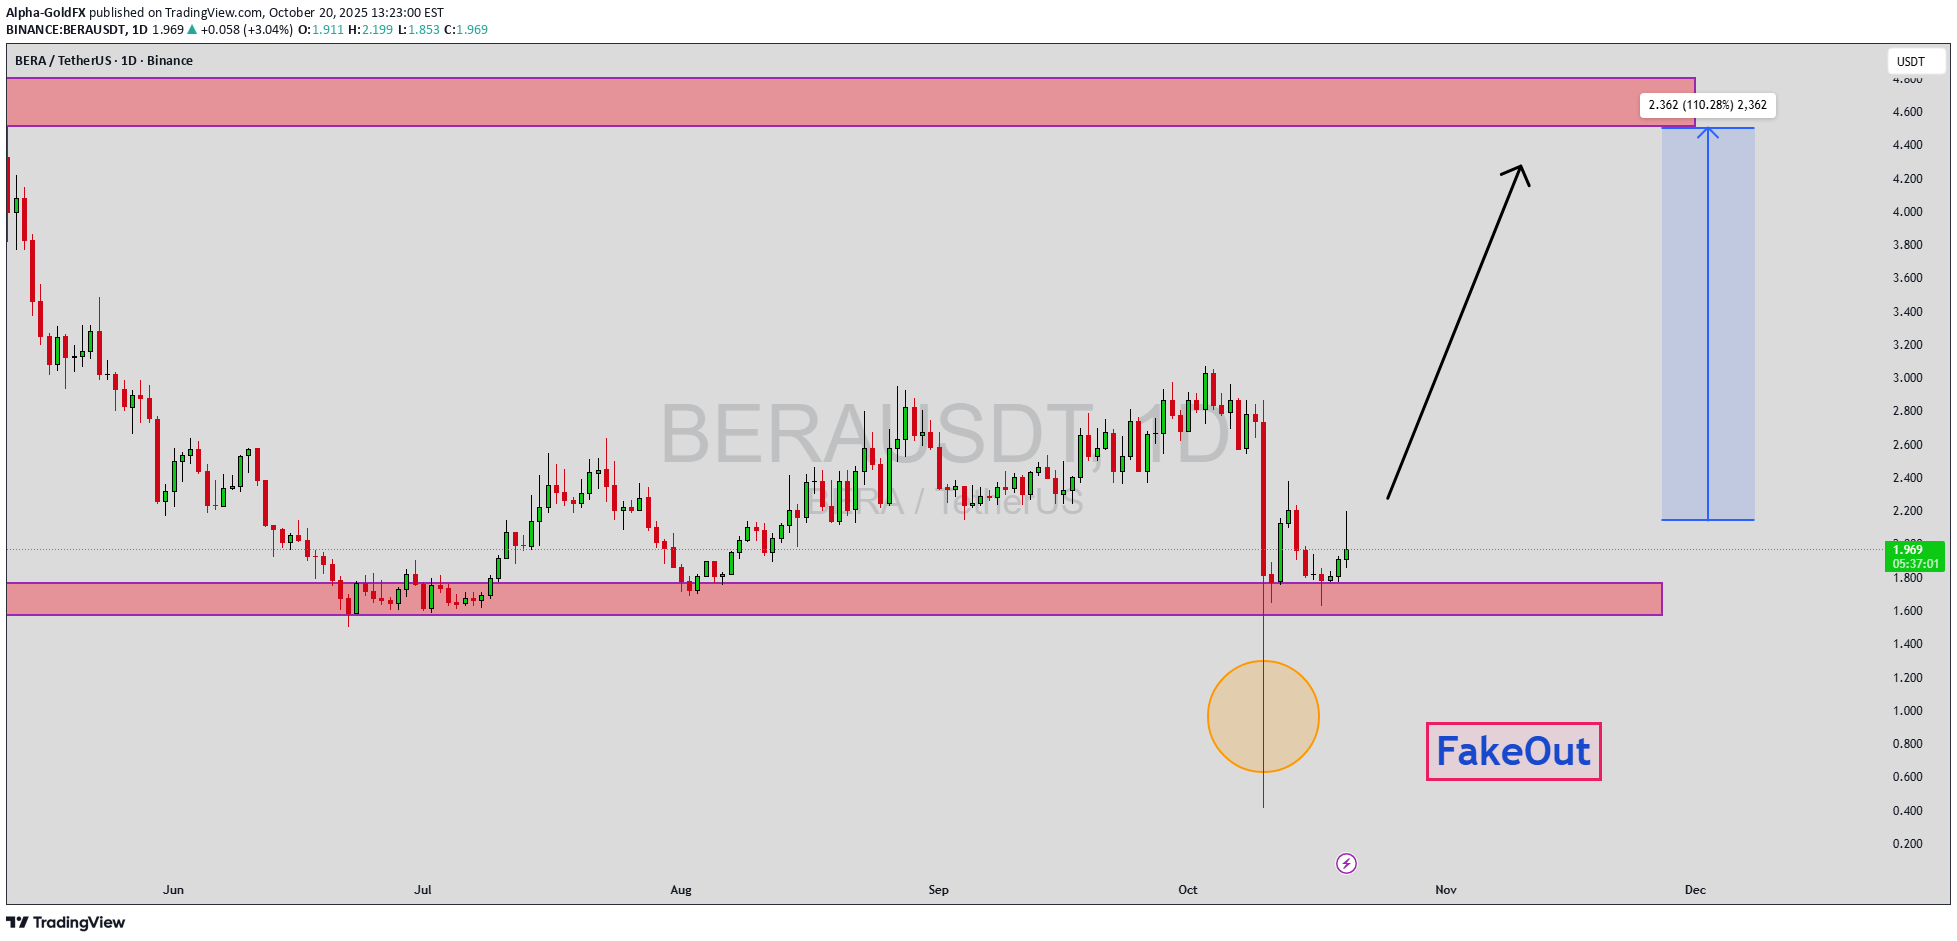
BERAUSDT is currently showing a strong bullish momentum pattern, signaling that the market sentiment around this coin is turning increasingly positive. The price action is building higher lows and testing resistance zones with improving volume — a key indicator that buying pressure is intensifying. This setup often precedes a significant move to the upside, and with good trading volume confirming participation, the momentum could easily translate into an expected gain of 90% to 100%+ if the bullish continuation remains intact. The bullish momentum pattern reflects sustained buyer dominance and renewed confidence in the BERAUSDT market structure. As price consolidates near recent highs, traders are watching closely for a breakout above the next resistance level to confirm the next upward leg. Once the breakout materializes, the price could accelerate rapidly as short-term traders and long-term investors pile in, anticipating further appreciation. Investor interest in BERAUSDT has been growing steadily, which strengthens the bullish outlook. The increased engagement and consistent accumulation behavior suggest that more participants are positioning themselves for the next move. With momentum indicators aligning positively and volume supporting the trend, BERAUSDT could soon become one of the top-performing altcoins in the near term. ✅ Show your support by hitting the like button and ✅ Leaving a comment below! (What is You opinion about this Coin) Your feedback and engagement keep me inspired to share more insightful market analysis with you!

CryptoWithJames
تحلیل بیداری BERA: پتانسیل سود 100 درصدی از حمایت کلیدی!
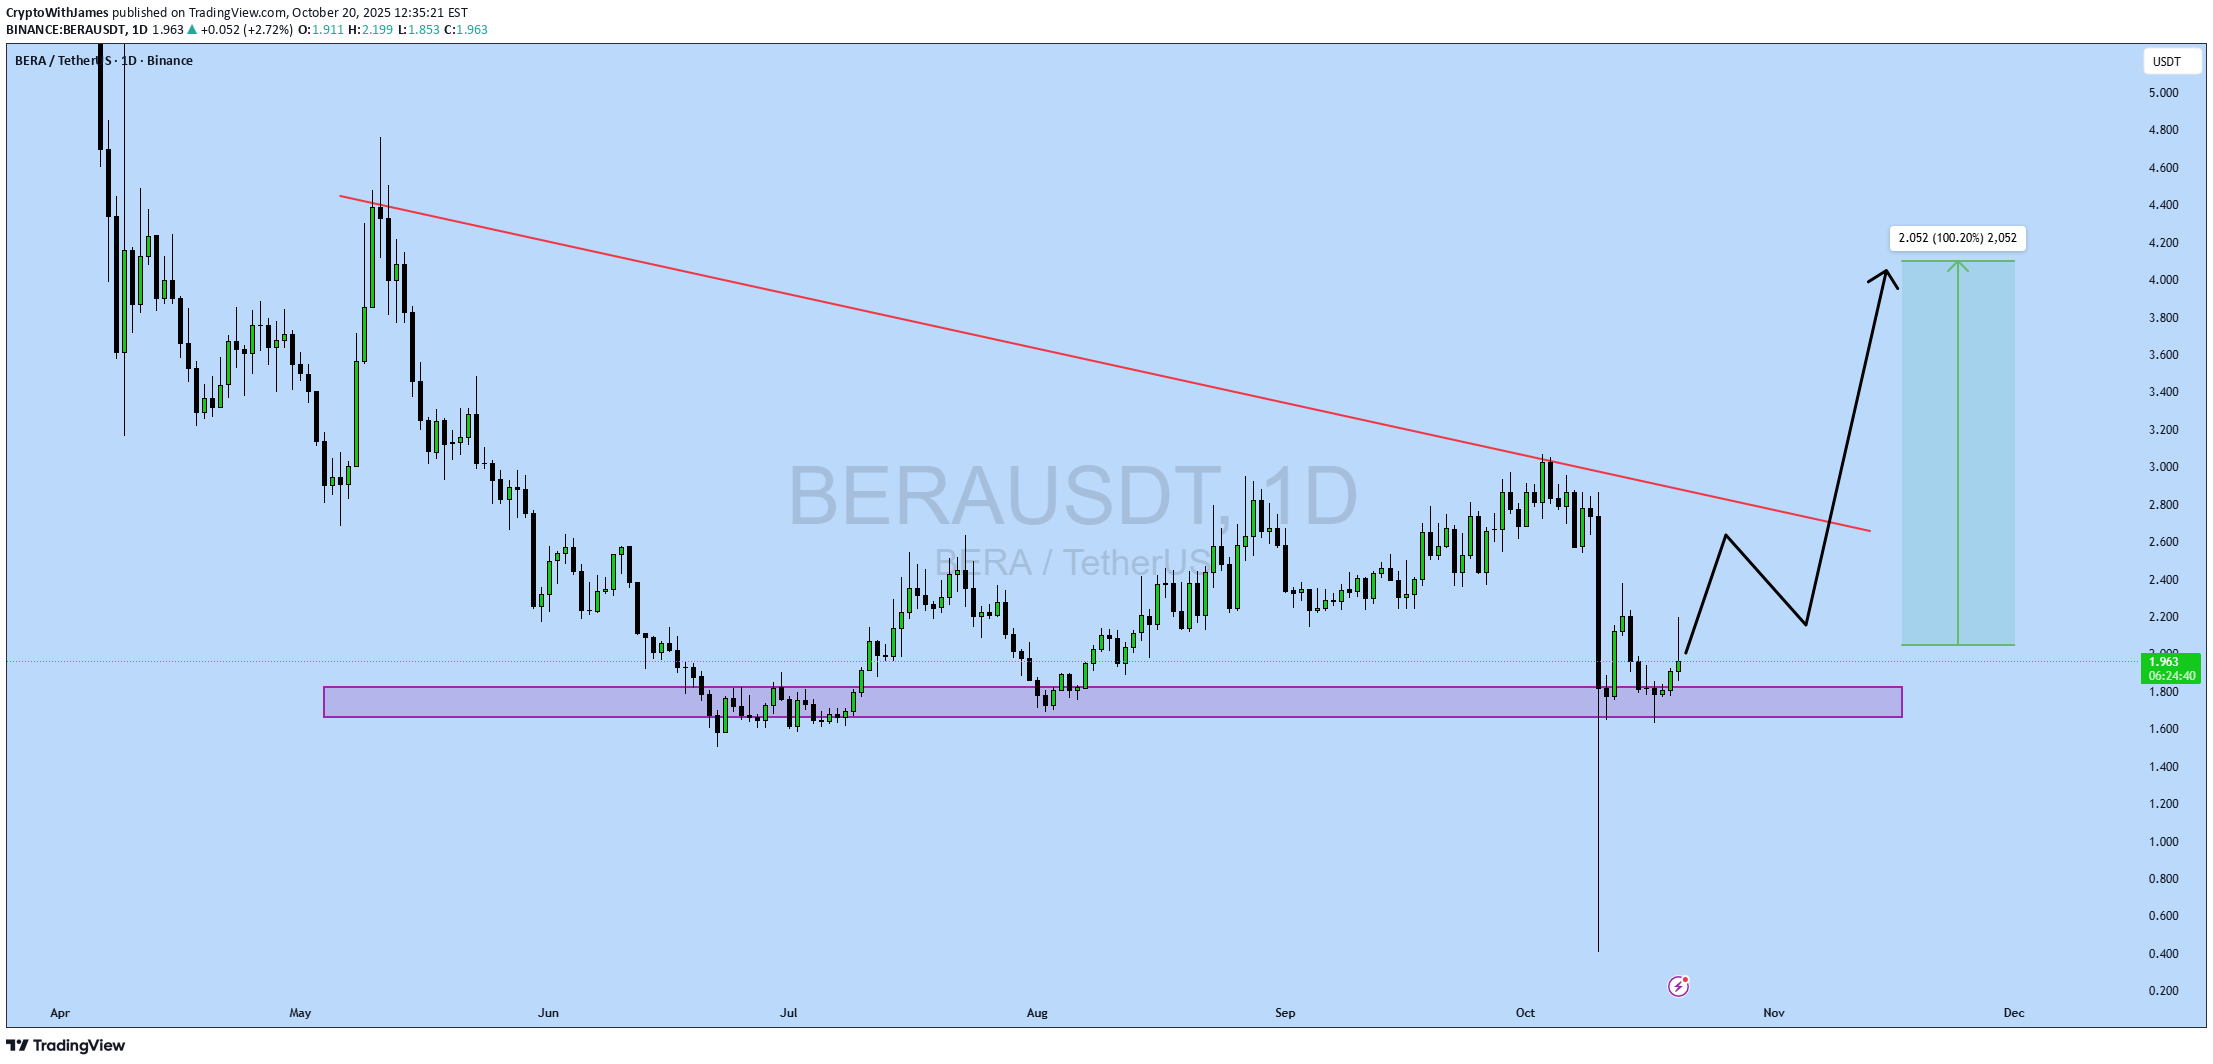
#BERA UPDATE BERA Technical Setup Pattern: Bullish reversal from key support zone Current Price: $1.96 Target Price: $4.02 Target % Gain: 100.2% BERA has rebounded strongly from a major support zone, indicating a potential bullish reversal on the 1D timeframe. With the current price at $1.96, the projected target stands around $4.02, reflecting a 100% potential upside. A break above the descending trendline could confirm further bullish continuation. Time Frame: 1D Risk Management Tip: Always use proper risk management.
Alpha-GoldFX
انفجار قریبالوقوع BERAUSDT: آیا آماده جهش ۹۰ درصدی هستید؟
BERAUSDT is displaying a strong bullish momentum pattern, signaling a potential continuation of its upward trend. The market structure shows clear accumulation at lower levels, followed by a decisive breakout that highlights growing buyer confidence. This kind of price behavior often acts as a precursor to a major rally, especially when combined with increasing volume and strong market sentiment. With momentum shifting firmly to the upside, traders are expecting a 90% to 100%+ move in the coming sessions as the pair targets higher resistance zones. The volume profile remains healthy, suggesting that investors are actively positioning themselves in anticipation of the next bullish leg. This consistent demand underscores rising confidence in BERA’s long-term potential, as well as the growing strength of its ecosystem. The ongoing market activity indicates that the bulls are firmly in control, with dips being quickly bought up — a strong confirmation of upward momentum building beneath the surface. If current conditions persist, BERAUSDT could soon challenge major breakout levels, triggering a surge in buying pressure and pushing prices into new highs. Technical indicators also align with this bullish outlook, hinting at strong trend continuation and a favorable setup for medium to long-term traders. ✅ Show your support by hitting the like button and ✅ Leaving a comment below! (What is You opinion about this Coin) Your feedback and engagement keep me inspired to share more insightful market analysis with you!

Bithereum_io
فرصت خرید BERA: جهش از حمایت و اهداف صعودی جذاب در تایم فریم روزانه

#BERA has bounced off the support zone on the daily chart and is currently facing the daily SMA100. Consider buying some #BERA here and near the support levels of $2.125 and $1.952. Our targets are: 🎯 $2.656 🎯 $2.987 🎯 $3.317 🎯 $3.788 🎯 $4.388 ⚠️ Always remember to use a tight stop-loss and maintain proper risk management.

behdark
تحلیل تکنیکال بـِرَا: آیا اصلاح صعودی آغاز شده؟ (فقط فروشندگان بخوانند)

From the point where we placed the green arrow on the chart, it seems that a corrective bullish phase has started, which appears to be either a diametric or symmetrical pattern. Note that we are not looking for a buy/long position on this asset; we will only enter a sell/short position if the price enters our red zone. In the red zone, it seems that wave F will complete. The closing of a daily candle above the invalidation level will invalidate this analysis. For risk management, please don't forget stop loss and capital management When we reach the first target, save some profit and then change the stop to entry Comment if you have any questions Thank You

mistasgw
BERAUSDT Buy Signal

BERAUSDT Buy signal produced by Indicator. SL: 2.606

AliHikmetHarun
BERAUSDT.P | LONG | Leonardo Harmonik Formasyon Onaylandı
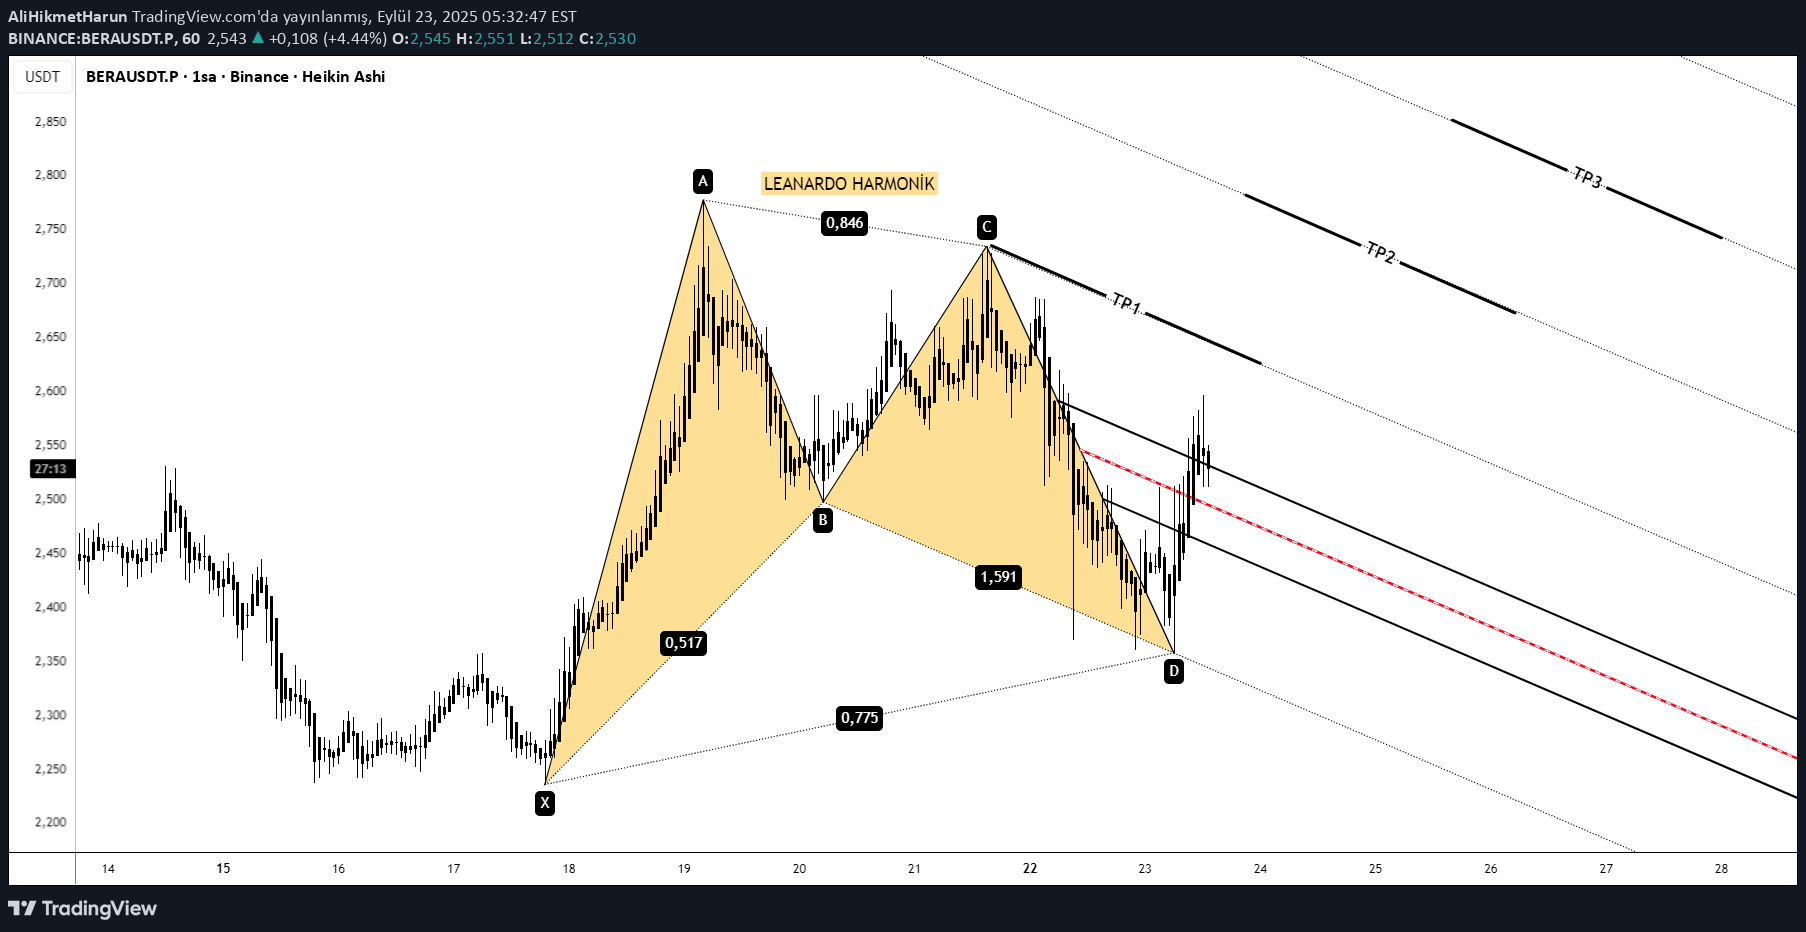
Berausdt.p | Long | Leonardo harmonic formation approved 🚀 Overview: Asset: berausdt.p Time Zone: 15 minutes Processing: Long (ascension) Technical Analysis Approvers: Leonardo Harmonic Formation: The price has completed the D point of Leonardo harmonic formation, which pointed to a strong rise turn on the bottom. This formation indicates that the price will move upward by taking a reaction from the 1.618 level. Pulsefork Formation: Processing Introduction and Targets are planned on sensitive levels determined by the Pulseform formation, which is part of the Dirgen Strategy. This increases the certainty of the analysis. TDG indicator: The TDG oscillator passed to the positive area and confirmed that the momentum was in the direction of rise and supported the Long position signal. The WMA50 & WMA200: The price shows that the medium -term trend is over and the WMA200 remains above the WMA200, while the main trend is still in the bull market. Macro market approvals: Crypto Market: The macro table shows that the money flow is still in BTC and stable coins, which may be a "bear trap" or "panic mode". However, reactions from Altcoins give signals that the risk appetite increases. Global Markets: Nasdaq's horizontal course and the weakening of the dollar creates an environment of "bull preparation". Transaction Plan: Introduction: With the D Point D approval of the Leonardo formation, Pulseform has entered over the sensitive level determined. Targets: TP1 and TP2 levels are the targets set by both the formation and the Pulseform. The TP3 target is the extension of the formation. Stop-Loss: It is placed just below point D, at the bottom level of the formation.

Morningtsar
bera
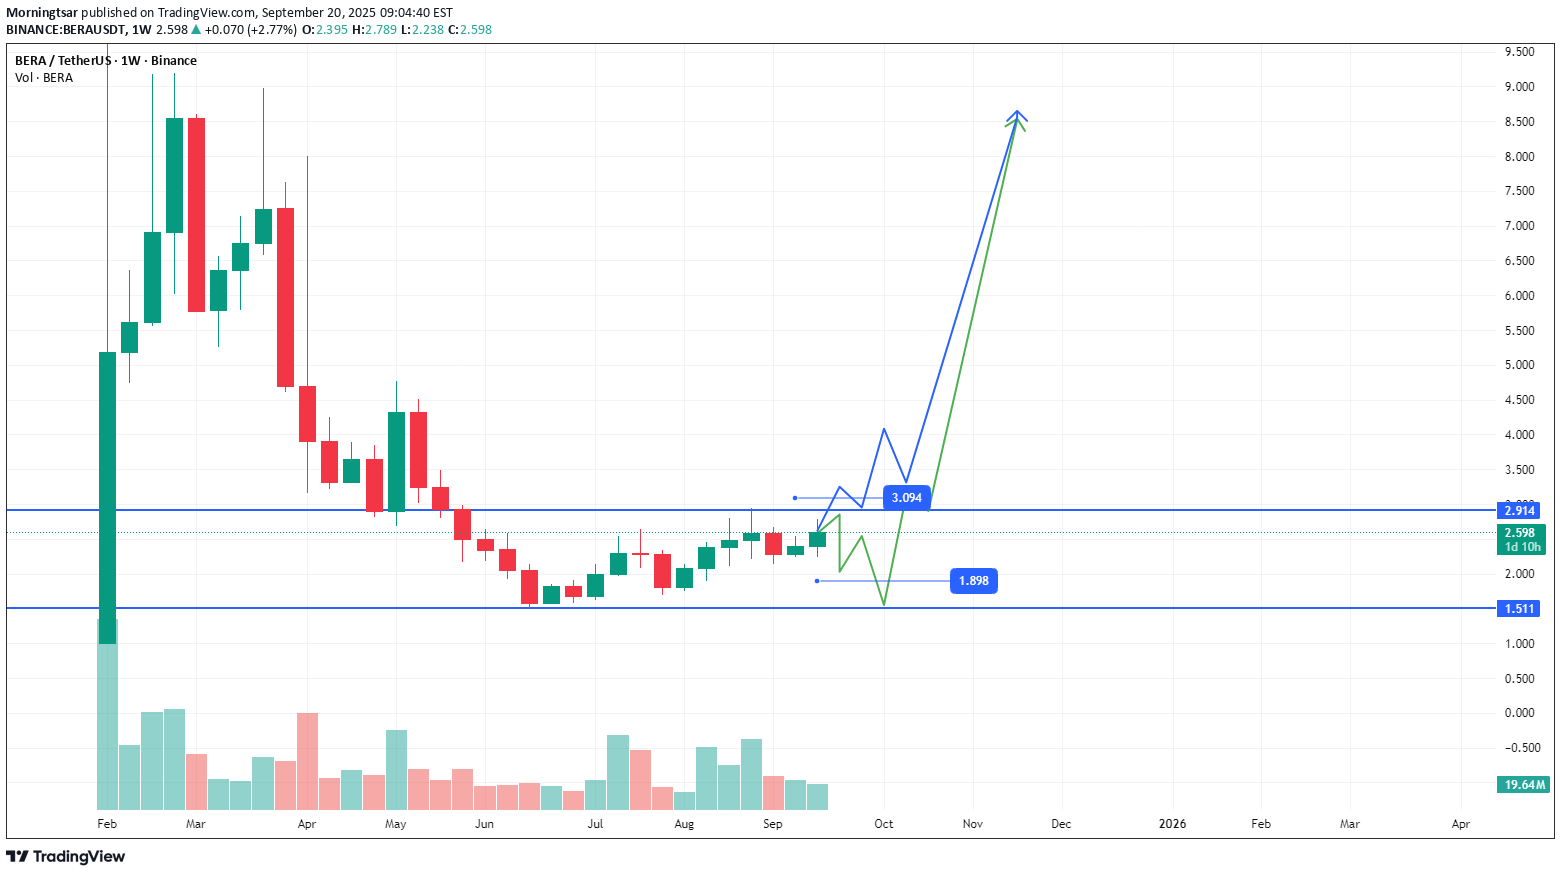
as i consider how pathetic can it be to imagine the outcomes of the situations escalated from the things that we maintained during our lives.
Disclaimer
Any content and materials included in Sahmeto's website and official communication channels are a compilation of personal opinions and analyses and are not binding. They do not constitute any recommendation for buying, selling, entering or exiting the stock market and cryptocurrency market. Also, all news and analyses included in the website and channels are merely republished information from official and unofficial domestic and foreign sources, and it is obvious that users of the said content are responsible for following up and ensuring the authenticity and accuracy of the materials. Therefore, while disclaiming responsibility, it is declared that the responsibility for any decision-making, action, and potential profit and loss in the capital market and cryptocurrency market lies with the trader.