
AliHikmetHarun
@t_AliHikmetHarun

What symbols does the trader recommend buying?
Purchase History
پیام های تریدر
Filter
AliHikmetHarun
تحلیل تکنیکال ALTUSDT: سیگنال خرید قدرتمند با الگوی ABCD (پیشبینی صعودی)

The price signaled a return to the Gann Box support zone after the Gann Fan exit. ABCD formation is active, the target zone is upward on the “d–e” leg. Approvals: Gann Box release ✅ Trend line support ✅ TDG positive transition signal ✅ 🎯 Target: ABCD Formation E point ⚠️ Tracking: EMA50 breakout confirmation is expected. In the crypto market, altcoins are looking for a way out of the decline. ALTUSDT recovery scenario is technically supported. #ALTUSDT #Altcoin #CryptoAnalysis #FixzoneTV #TechnicalAnalysis
AliHikmetHarun
سیگنال فروش اتریوم (ETHUSDT): آماده برای سقوط بزرگ بر اساس فیبوناچی!

📉 ETHUSDT | 1H Short Setup Fibo 114 Orbit Formation is active. After the price trend line break, Microfork moves to the target area. Approvals: VWAP breakdown ✅ EMA50 breakdown ✅ TDG pass ✅ Trendline breakout 🔻 🎯 Target: leg d–e, Gartley completion level. Crypto is in risk-off mode across the board; The ETH short scenario is technically supported. ETHUSDT
AliHikmetHarun
تحلیل تکنیکال لایتکوین (LTC/USDT): آیا موج صعودی جدید آغاز میشود؟ (پیشبینی انفجاری)

ABC correction complete, impulse wave may be starting. VWAP & EMA50 breakdown ✅ TDG pass ✅ Pitchfork channel broke upwards The d wave of the formation is active, the e target is being monitored. #LTC #Crypto #FixzoneTV #TechnicalAnalysis
AliHikmetHarun
ALGO/USDT – 1H Düşen Üçgen
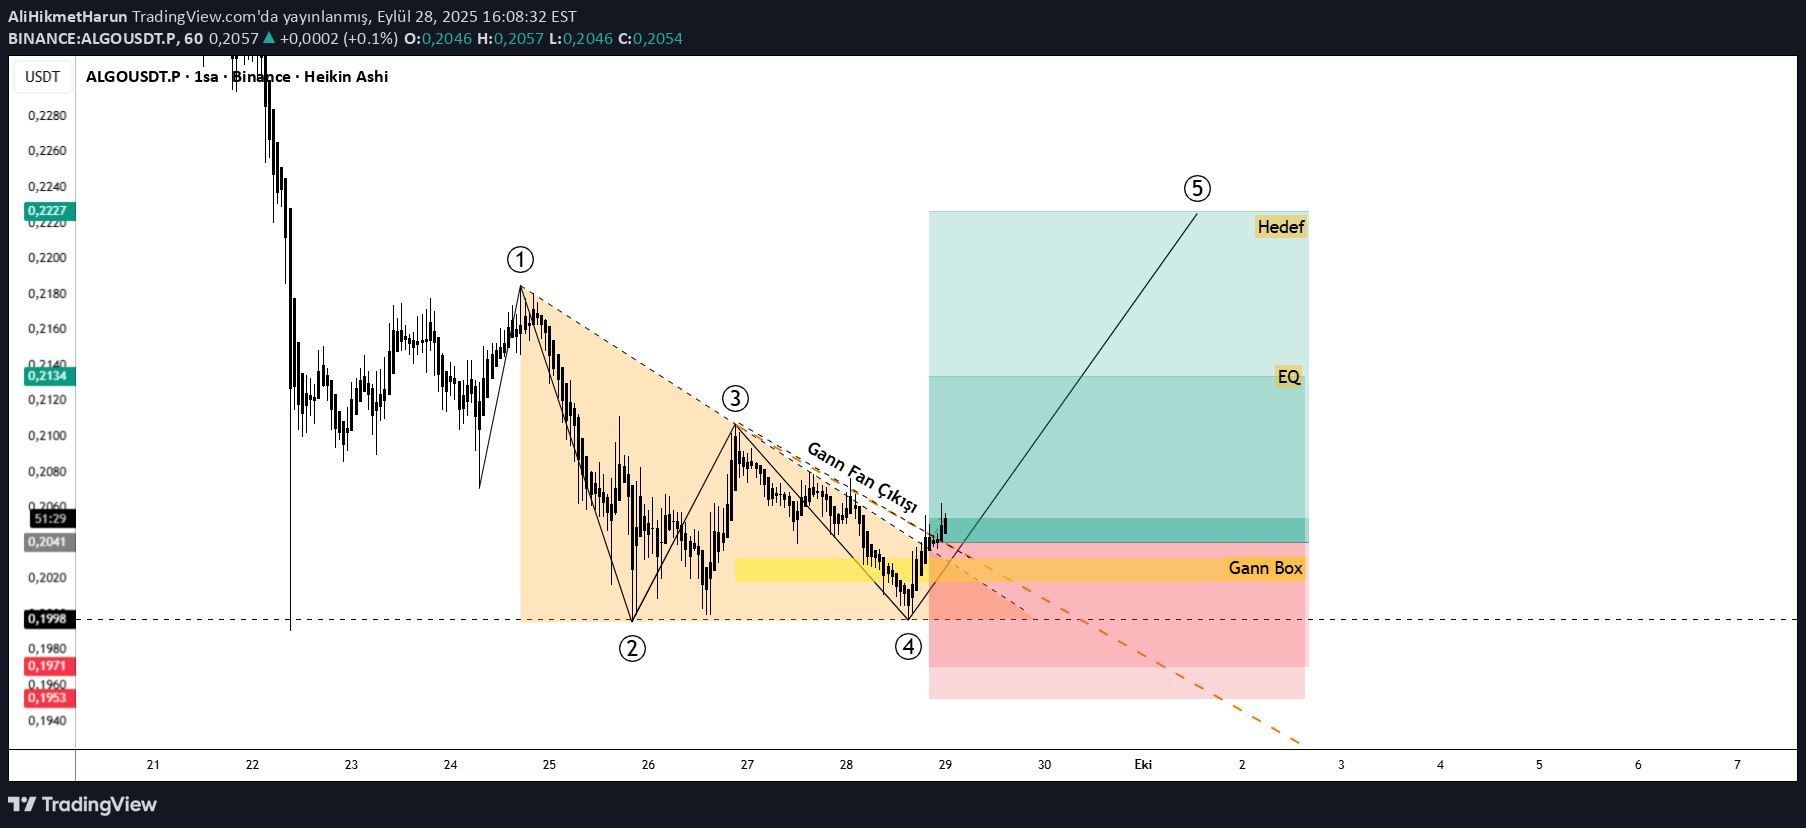
📌 ALGO/USDT - 1H Falling triangular formation 5. wave target after breakage is on the agenda. 📍 Gann fan output confirmation 📍 Gann Box Support Zone 📍 EQ and target levels marked 📍 TDG in the positive area In the short term, it maintains the rise potential.
AliHikmetHarun
BERAUSDT.P | LONG | Leonardo Harmonik Formasyon Onaylandı
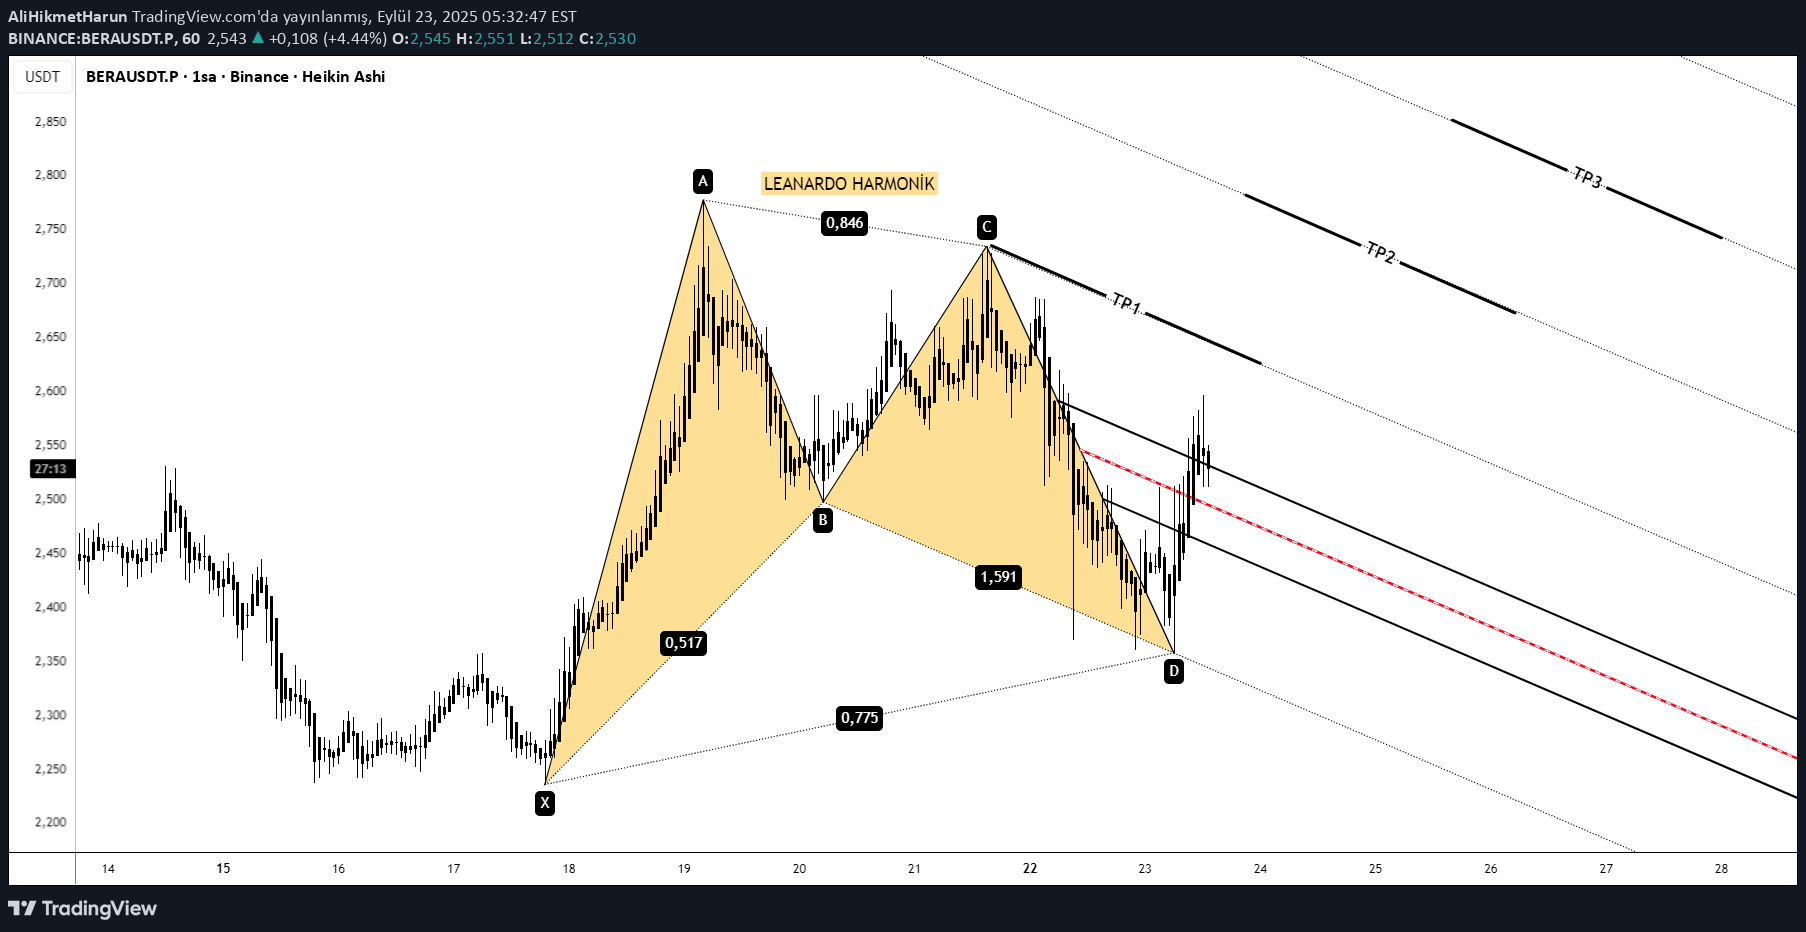
Berausdt.p | Long | Leonardo harmonic formation approved 🚀 Overview: Asset: berausdt.p Time Zone: 15 minutes Processing: Long (ascension) Technical Analysis Approvers: Leonardo Harmonic Formation: The price has completed the D point of Leonardo harmonic formation, which pointed to a strong rise turn on the bottom. This formation indicates that the price will move upward by taking a reaction from the 1.618 level. Pulsefork Formation: Processing Introduction and Targets are planned on sensitive levels determined by the Pulseform formation, which is part of the Dirgen Strategy. This increases the certainty of the analysis. TDG indicator: The TDG oscillator passed to the positive area and confirmed that the momentum was in the direction of rise and supported the Long position signal. The WMA50 & WMA200: The price shows that the medium -term trend is over and the WMA200 remains above the WMA200, while the main trend is still in the bull market. Macro market approvals: Crypto Market: The macro table shows that the money flow is still in BTC and stable coins, which may be a "bear trap" or "panic mode". However, reactions from Altcoins give signals that the risk appetite increases. Global Markets: Nasdaq's horizontal course and the weakening of the dollar creates an environment of "bull preparation". Transaction Plan: Introduction: With the D Point D approval of the Leonardo formation, Pulseform has entered over the sensitive level determined. Targets: TP1 and TP2 levels are the targets set by both the formation and the Pulseform. The TP3 target is the extension of the formation. Stop-Loss: It is placed just below point D, at the bottom level of the formation.
AliHikmetHarun
XRPUSDT (4H) Satış Fırsatı
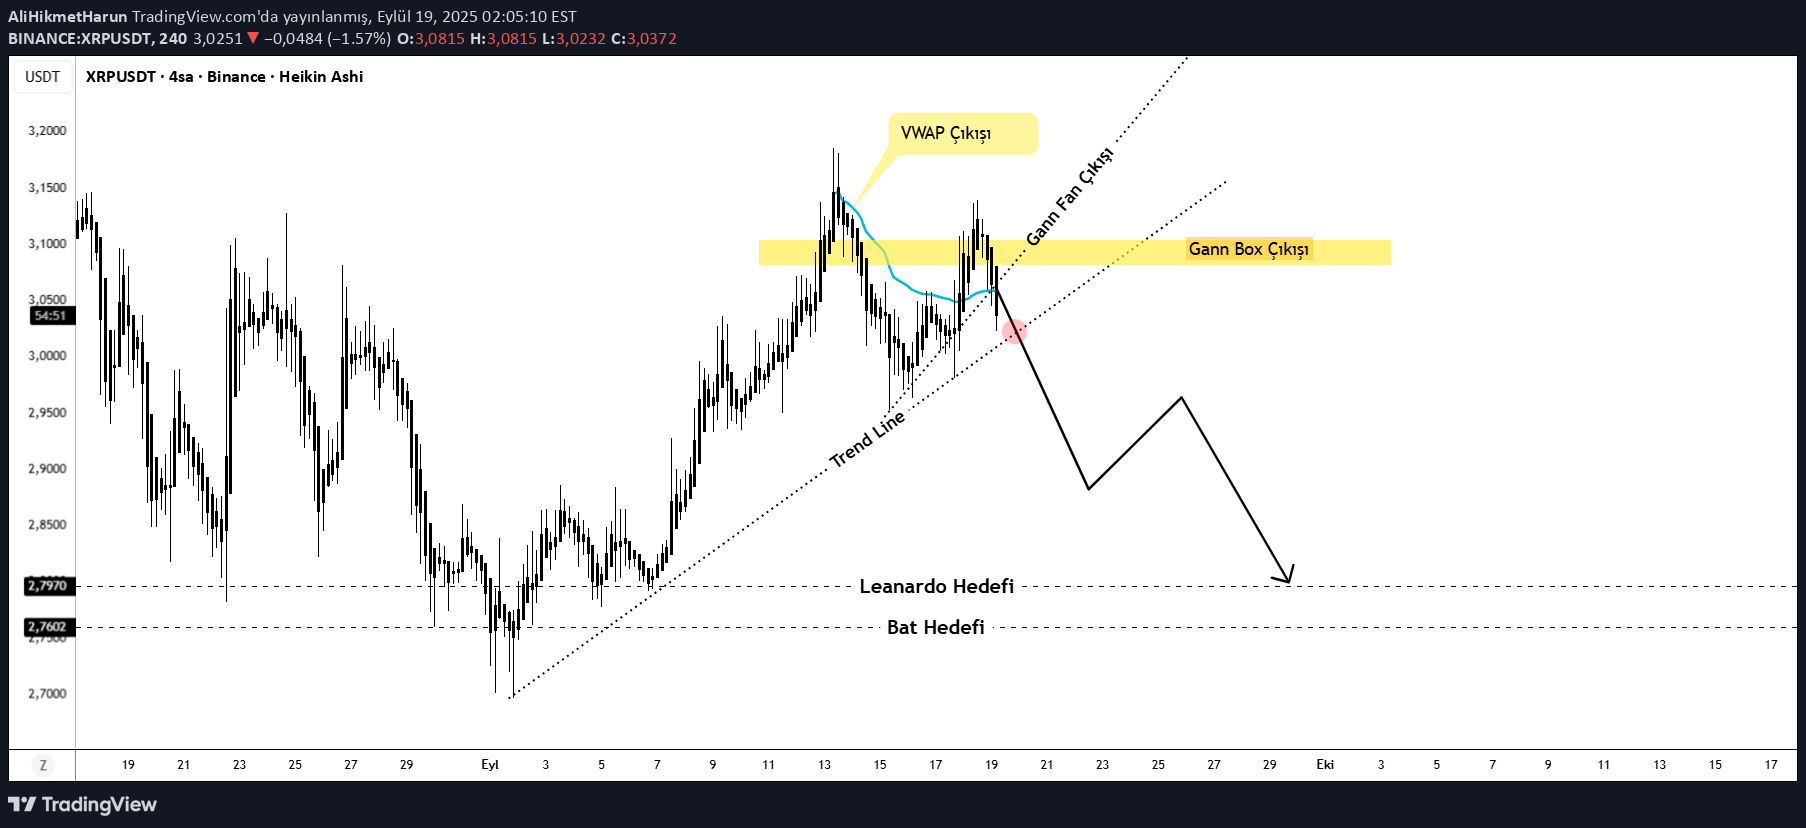
Summary: In the 4H graph, the price received resistance in the intersection area of VWAP and Gann Box / fann line. Trendline hasn't broken yet - so Setup is waiting for confirmation right now. There are mixed signals: the breakdown is observed in DDG (short term printing sign), but TDG is still in the purchase zone. In other words, there is a contradiction in Momentum layers; Don't rush, ask for confirmation. Technical notes Time Zone: 4H Current Status: VWAP - Gann Box - Resistance in the intersection of fann Trendline: The movement can accelerate if the break is confirmed by 4H candle closure. Indicators: DDG Breeding (short -term sales pressure warning). TDG is still in the purchase zone (medium/long -term support). Targets: If the break occurs, the direction will be correct to harmonic levels (TP levels marked in the graph). Risk: 4H closing under the trendline + VWAP Rejection = Short-Interest approval; Otherwise, setup may be invalid. Note: This is an analysis sharing, not investment advice. Risk management is a must.
AliHikmetHarun
AEROUSDT.P Long Pozisyon Analizi

Asset: aerousdt.p Time Zone: 30 minutes Transaction type: Long (purchase) position TECHNICAL ANALYSIS APPROVES This process was created by combining more than one technical signal in the price graph at the same time: Classic ABCD Formation: The price has completed the D point of the classic ABCD formation, which pointed to a rise turn on the graph. This rotating point also adapts to the 1 Fibonacci extension level. TDG indicator: The TDG oscillator, which shows the market momentum, has risen above the zero line and confirmed that the momentum has turned positively. The return of the histogram to green also strengthened the rise signal. Gann Box Approval: The price signal signal with a strong reaction from the "Gann Box" zone at a critical support level. Macro market approvals The macro analysis table in the right alt corner of the graph confirms a positive market environment that supports technical signals: Crypto Market: In the crypto market, capital flows into subcoins and "risk-on" mode is active. Global Markets: Global Risk Appetite tends to increase. For US stock markets, a "bull preparation" signal is given. These conditions provide a positive basis that increases the likelihood of technical analysis. Transaction plan INTRODUCTION: Long position was opened with the return approval of the formation from point D (from 1 Fibo level) and the Gann Box output. Target: The levels and resistance zones determined by the formation will be monitored. Stop-Loss: Almost six of the ABCD formation is determined as the stop-loss level to protect against a possible turn.
AliHikmetHarun
COSUSDT.P | 1H Short Therm

Opening a short setup on COSUSDT.P (1H) based on the completion of a Shark harmonic pattern at point D. 🔎 Confluences: – Shark pattern completion aligning with resistance – TDG indicator flashing bearish momentum (Sell mode) – Market structure respecting the pitchfork channel 📉 Setup: – Entry: Point D rejection – Targets: TP1 → TP2 → TP3 (scaling out) – Stop: Above X to limit risk ⚠️ This is not financial advice, just sharing my analysis for discussion. Question: Do you guys find Shark patterns reliable compared to Bat/Crab, or do you mostly ignore them?
AliHikmetHarun
CHZUSDT.P | 1H Short Therm
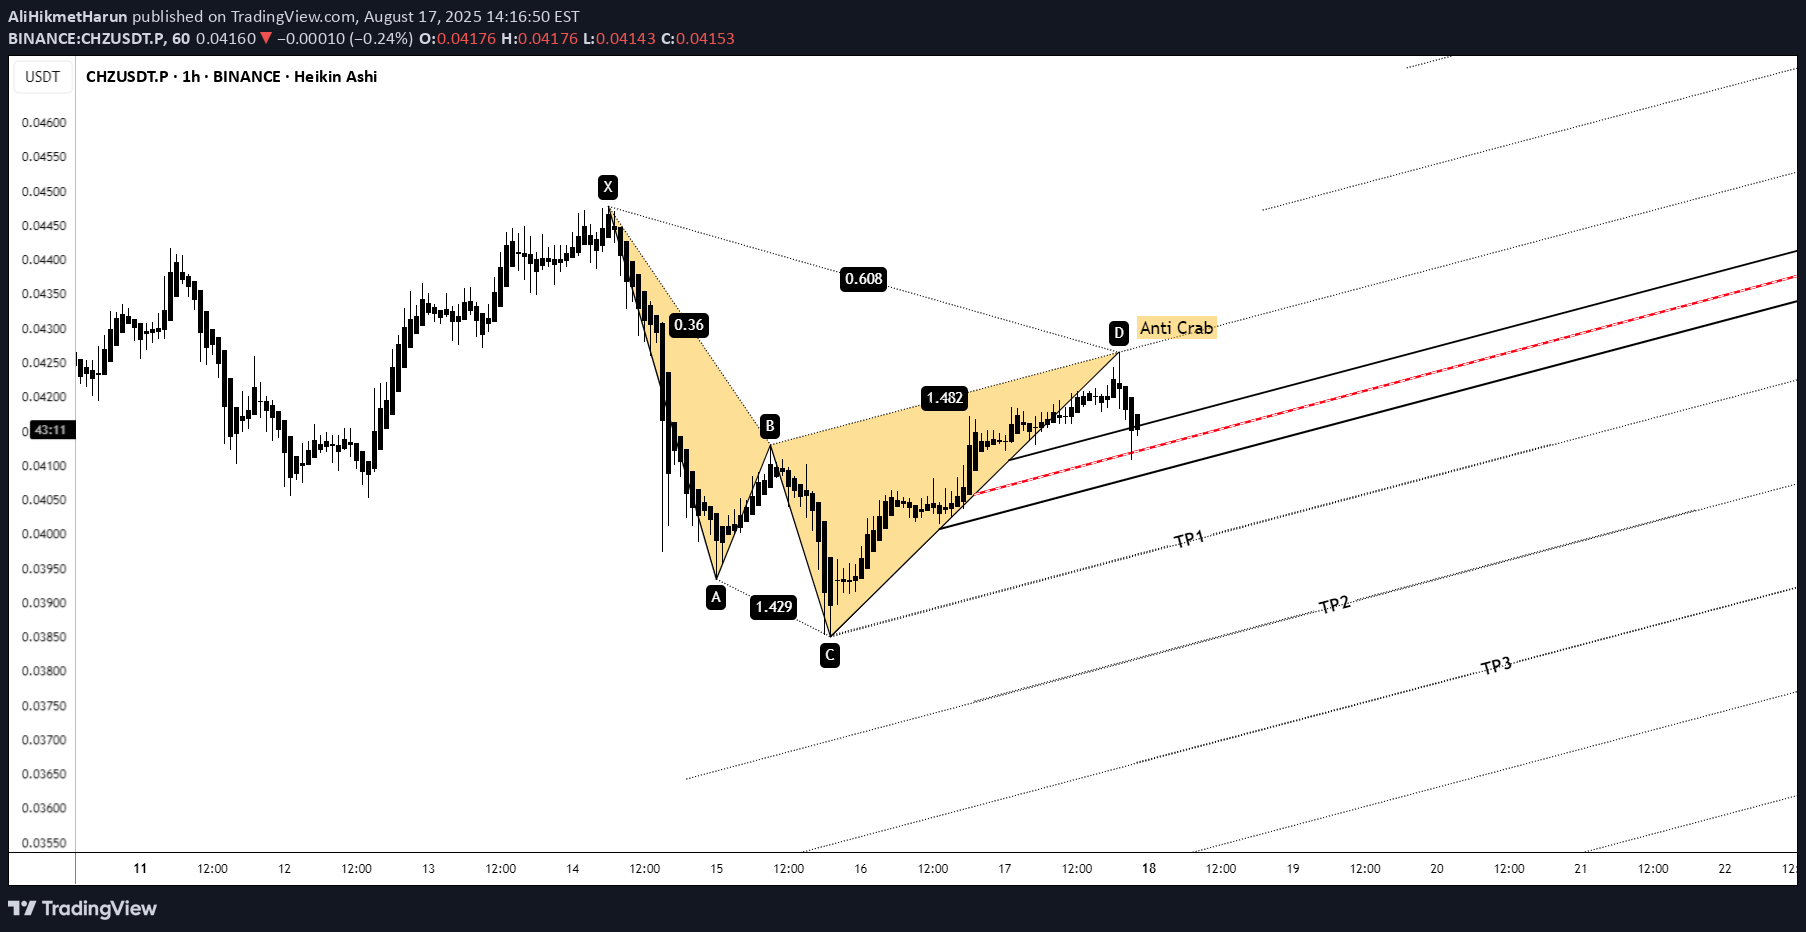
I’m taking a short position on CHZUSDT.P (1H) based on an Anti Crab harmonic pattern that completed at point D. 🔎 Confluences: – Anti Crab harmonic completion at resistance – TDG momentum indicator flipped bearish (Sell mode) – Structure aligned with median line channel (Pulsefork) 📉 Plan: – Entry: Point D rejection – Targets: TP1 → TP2 → TP3 (scaling out) – Stop: Above X to protect capital I’m sharing this setup for discussion — not financial advice. Curious: do you also combine harmonic patterns with custom momentum tools like TDG, or do you rely purely on price action?
AliHikmetHarun
Fibonacci Aracı İle Harmonik Çizimi

اگر کانال یوتیوب من، "Fibooracle TV" را سابسکرایب کنید و لایکهایتان را دریغ نکنید، استراتژیهای معاملاتی منحصربهفرد، پخشهای زنده و ویدیوهای آموزشی را به اشتراک گذاشت. در این ویدیو، به شما آموزش دادهام که چگونه با استفاده از یک ابزار فیبوناچی، سطوح الگوهای هارمونیک را شناسایی کنید. از تماشا لذت ببرید. سطوح ابزار ترسیم: BCDBAT0,3820,1140,886BAT0,50,1140,886LEANARDO0,50,1140,786ANTİ SHARK0,50,1141,114ANTİ SHARK0,6180,1141,114CRAB0,50,1141,5CRAB0,50,1141,618CRAB0,6180,1141,5CRAB0,6180,1141,618GARTLEY0,6180,1140,786BUTTERFLY0,7860,1141,382BUTTERFLY0,7860,1141,5BUTTERFLY0,7860,1141,618ANTİ CRAB0,382-0,1140,618CYPHER0,382-0,1140,786ANTİ BAT0,382-0,1141,114ANTİ BAT0,5-0,1141,114ANTİ BUTTERFLY0,5-0,1140,618CYPHER0,5-0,1140,786SHARK0,5-0,1140,886THREE DRIVER0,618-0,1140,382THREE DRIVER0,618-0,1140,51210,786-0,1140,618ANTİ GARTLEY0,786-0,1141,236
Disclaimer
Any content and materials included in Sahmeto's website and official communication channels are a compilation of personal opinions and analyses and are not binding. They do not constitute any recommendation for buying, selling, entering or exiting the stock market and cryptocurrency market. Also, all news and analyses included in the website and channels are merely republished information from official and unofficial domestic and foreign sources, and it is obvious that users of the said content are responsible for following up and ensuring the authenticity and accuracy of the materials. Therefore, while disclaiming responsibility, it is declared that the responsibility for any decision-making, action, and potential profit and loss in the capital market and cryptocurrency market lies with the trader.