
BAND
Band Protocol
| تریدر | نوع سیگنال | حد سود/ضرر | زمان انتشار | مشاهده پیام |
|---|---|---|---|---|
No results found. | ||||
Price Chart of Band Protocol
سود 3 Months :
سیگنالهای Band Protocol
Filter
Sort messages by
Trader Type
Time Frame

behdark
BAND Analysis (1W)
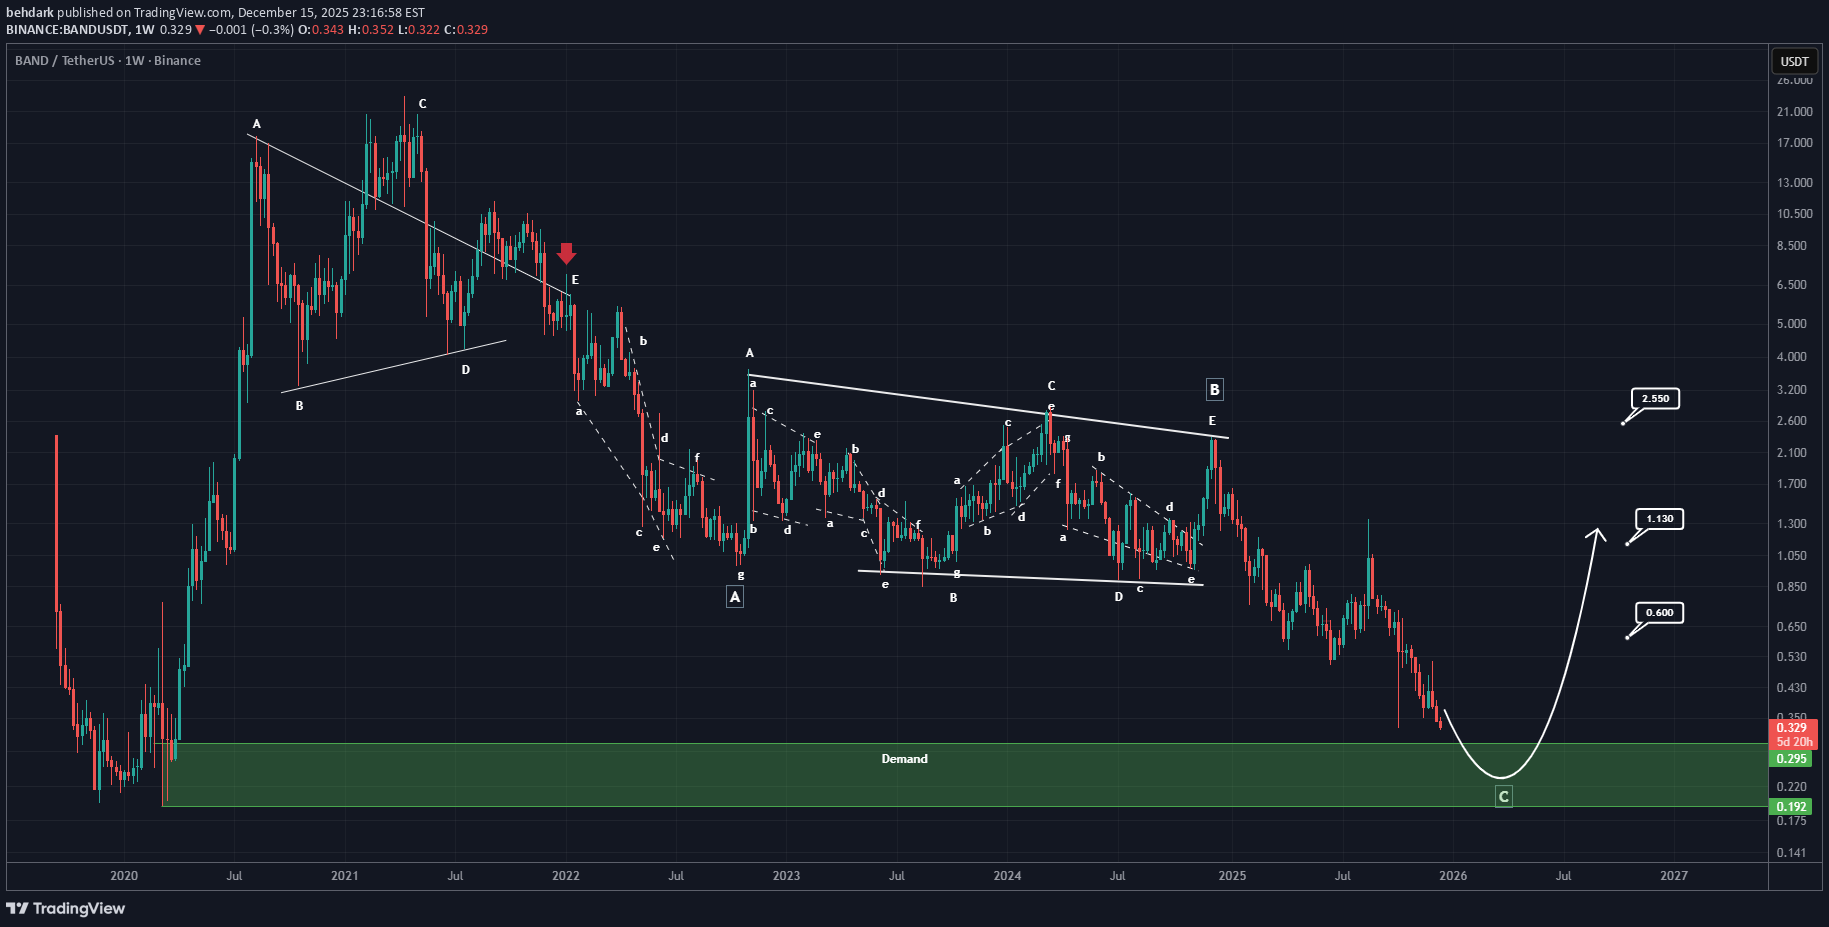
On the weekly timeframe, the bearish phase of BAND started from the point where we marked the red arrow on the chart. BAND appears to be completing an ABC corrective pattern, and the C wave is expected to finish within the green zone. In the green zone, you can look for spot buy opportunities. The targets are marked on the chart. For risk management, please don't forget stop loss and capital management When we reach the first target, save some profit and then change the stop to entry Comment if you have any questions Thank You

CryptoAnalystSignal
تحلیل BAND/USDT: گاوها میتازند یا خرسها پیروز میشوند؟ پیشبینی قیمت و نقاط ورود/خروج کلیدی
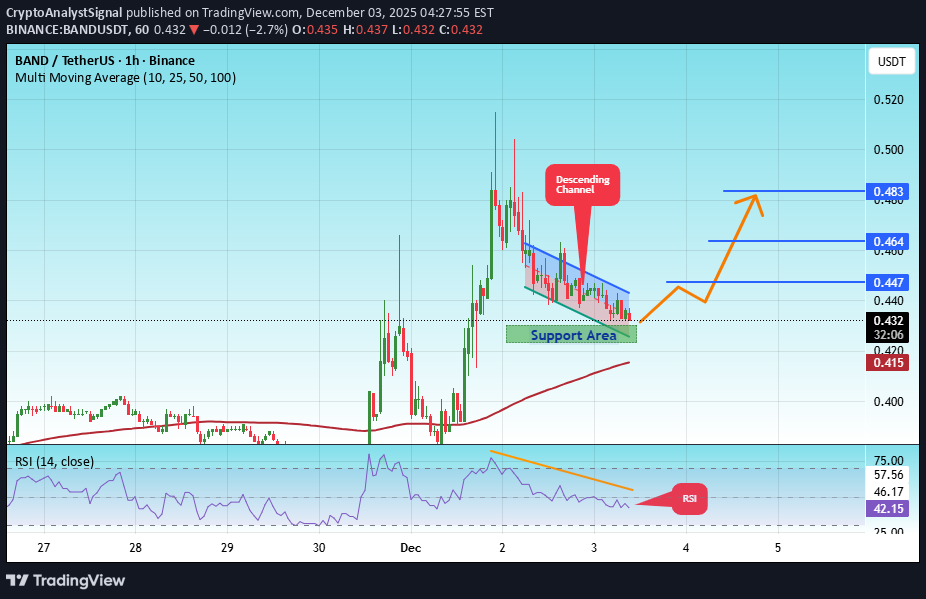
#BAND The price is moving in a descending channel on the 1-hour timeframe. It has reached the lower boundary and is heading towards breaking above it, with a retest of the upper boundary expected. We have a downtrend on the RSI indicator, which has reached near the lower boundary, and an upward rebound is expected. There is a key support zone in green at 0.426. The price has bounced from this zone multiple times and is expected to bounce again. We have a trend towards stability above the 100-period moving average, as we are moving close to it, which supports the upward movement. Entry price: 0.432 First target: 0.447 Second target: 0.464 Third target: 0.483 Don't forget a simple principle: money management. Place your stop-loss order below the green support zone. For any questions, please leave a comment. Thank you.
CryptoAnalystSignal
آینده BAND/USDT: آیا گاوها ادامه میدهند یا خرسها پیروز میشوند؟ (تحلیل تکنیکال)
#BAND The price is moving in a descending channel on the 1-hour timeframe. It has reached the lower boundary and is heading towards breaking above it, with a retest of the upper boundary expected. We have a downtrend on the RSI indicator, which has reached near the lower boundary, and an upward rebound is expected. There is a key support zone in green at 0.426. The price has bounced from this zone multiple times and is expected to bounce again. We have a trend towards stability above the 100-period moving average, as we are moving close to it, which supports the upward movement. Entry price: 0.432 First target: 0.447 Second target: 0.464 Third target: 0.483 Don't forget a simple principle: money management. Place your stop-loss order below the green support zone. For any questions, please leave a comment. Thank you.

Alpha-GoldFX
پیشبینی انفجاری باند (BANDUSDT): الگوی گوه نزولی نویدبخش جهش ۹۰ درصدی!
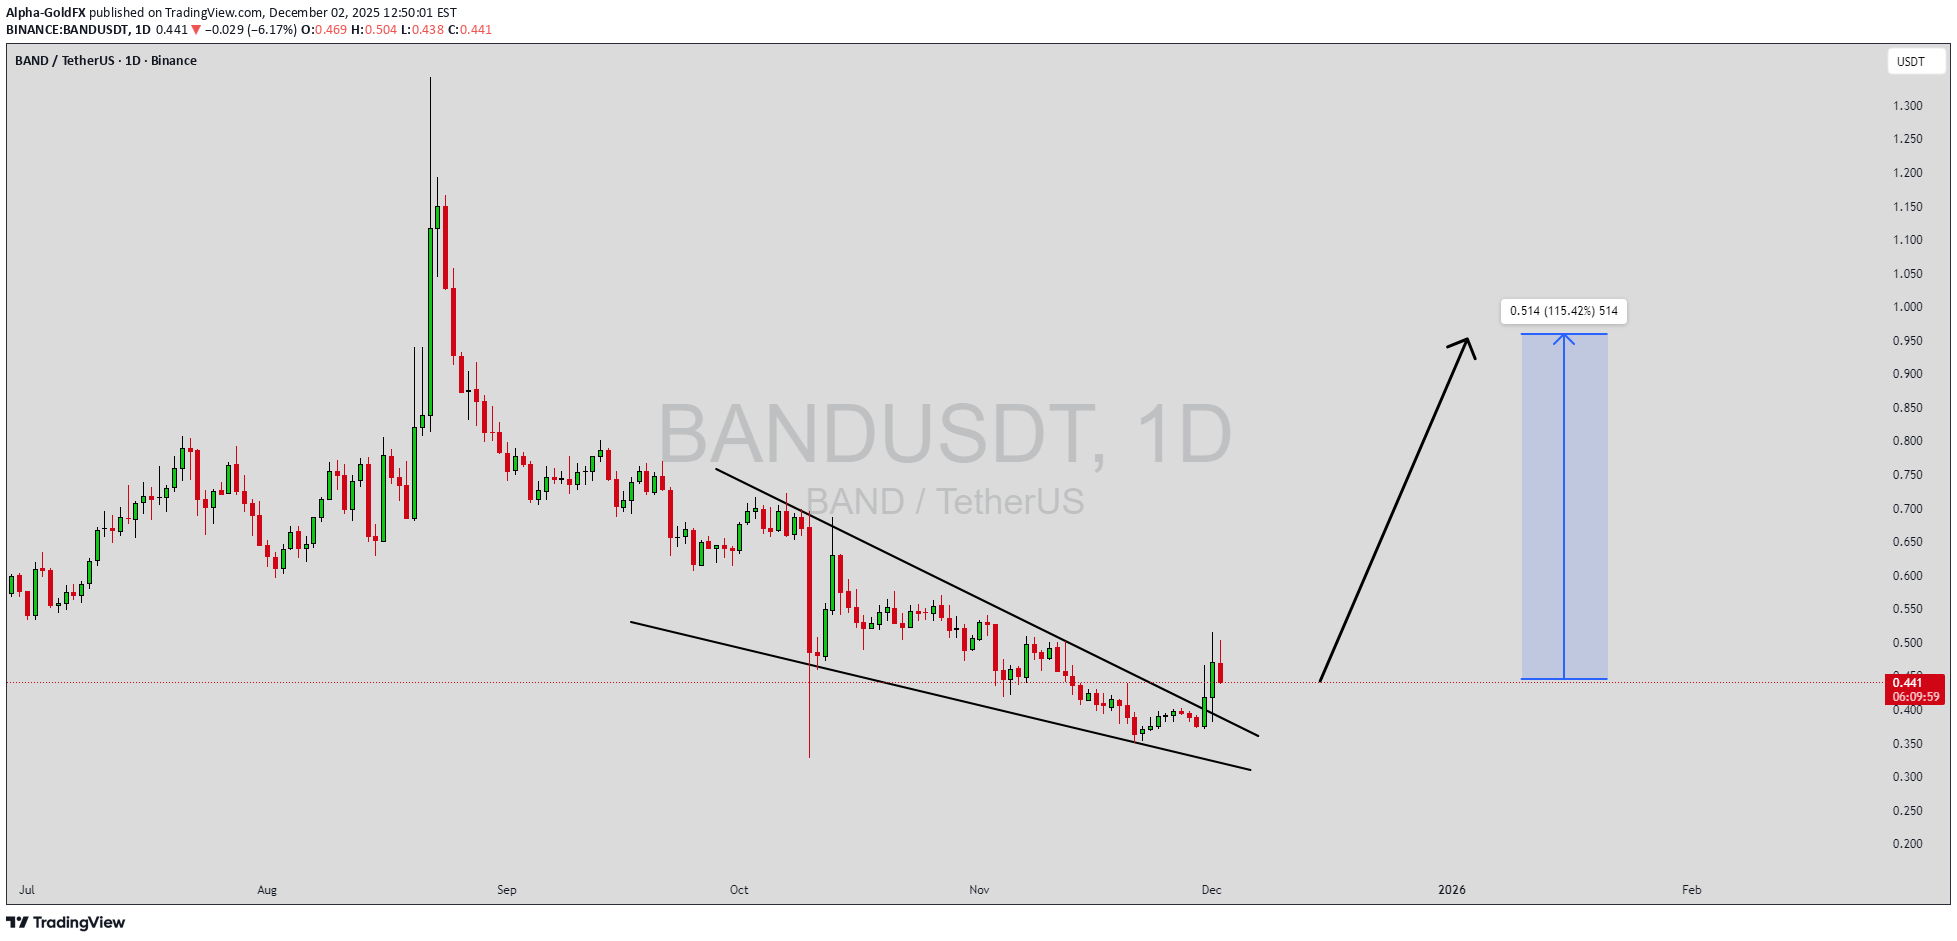
BANDUSDT is forming a clear falling wedge pattern, a classic bullish reversal signal that often indicates an upcoming breakout. The price has been consolidating within a narrowing range, suggesting that selling pressure is weakening while buyers are beginning to regain control. With consistent volume confirming accumulation at lower levels, the setup hints at a potential bullish breakout soon. The projected move could lead to an impressive gain of around 90% to 100% once the price breaks above the wedge resistance. This falling wedge pattern is typically seen at the end of downtrends or corrective phases, and it represents a potential shift in market sentiment from bearish to bullish. Traders closely watching BANDUSDT are noting the strengthening momentum as it nears a breakout zone. The good trading volume adds confidence to this pattern, showing that market participants are positioning early in anticipation of a reversal. Investors’ growing interest in BANDUSDT reflects rising confidence in the project’s long-term fundamentals and current technical strength. If the breakout confirms with sustained volume, this could mark the start of a fresh bullish leg. Traders might find this a valuable setup for medium-term gains, especially as the wedge pattern completes and buying momentum accelerates. ✅ Show your support by hitting the like button and ✅ Leaving a comment below! (What is your opinion about this Coin?) Your feedback and engagement keep me inspired to share more insightful market analysis with you!

CryptoWithJames
تحلیل تکنیکال BAND: سیگنال انفجاری خروج از گوه نزولی با پتانسیل سود 150 درصد!
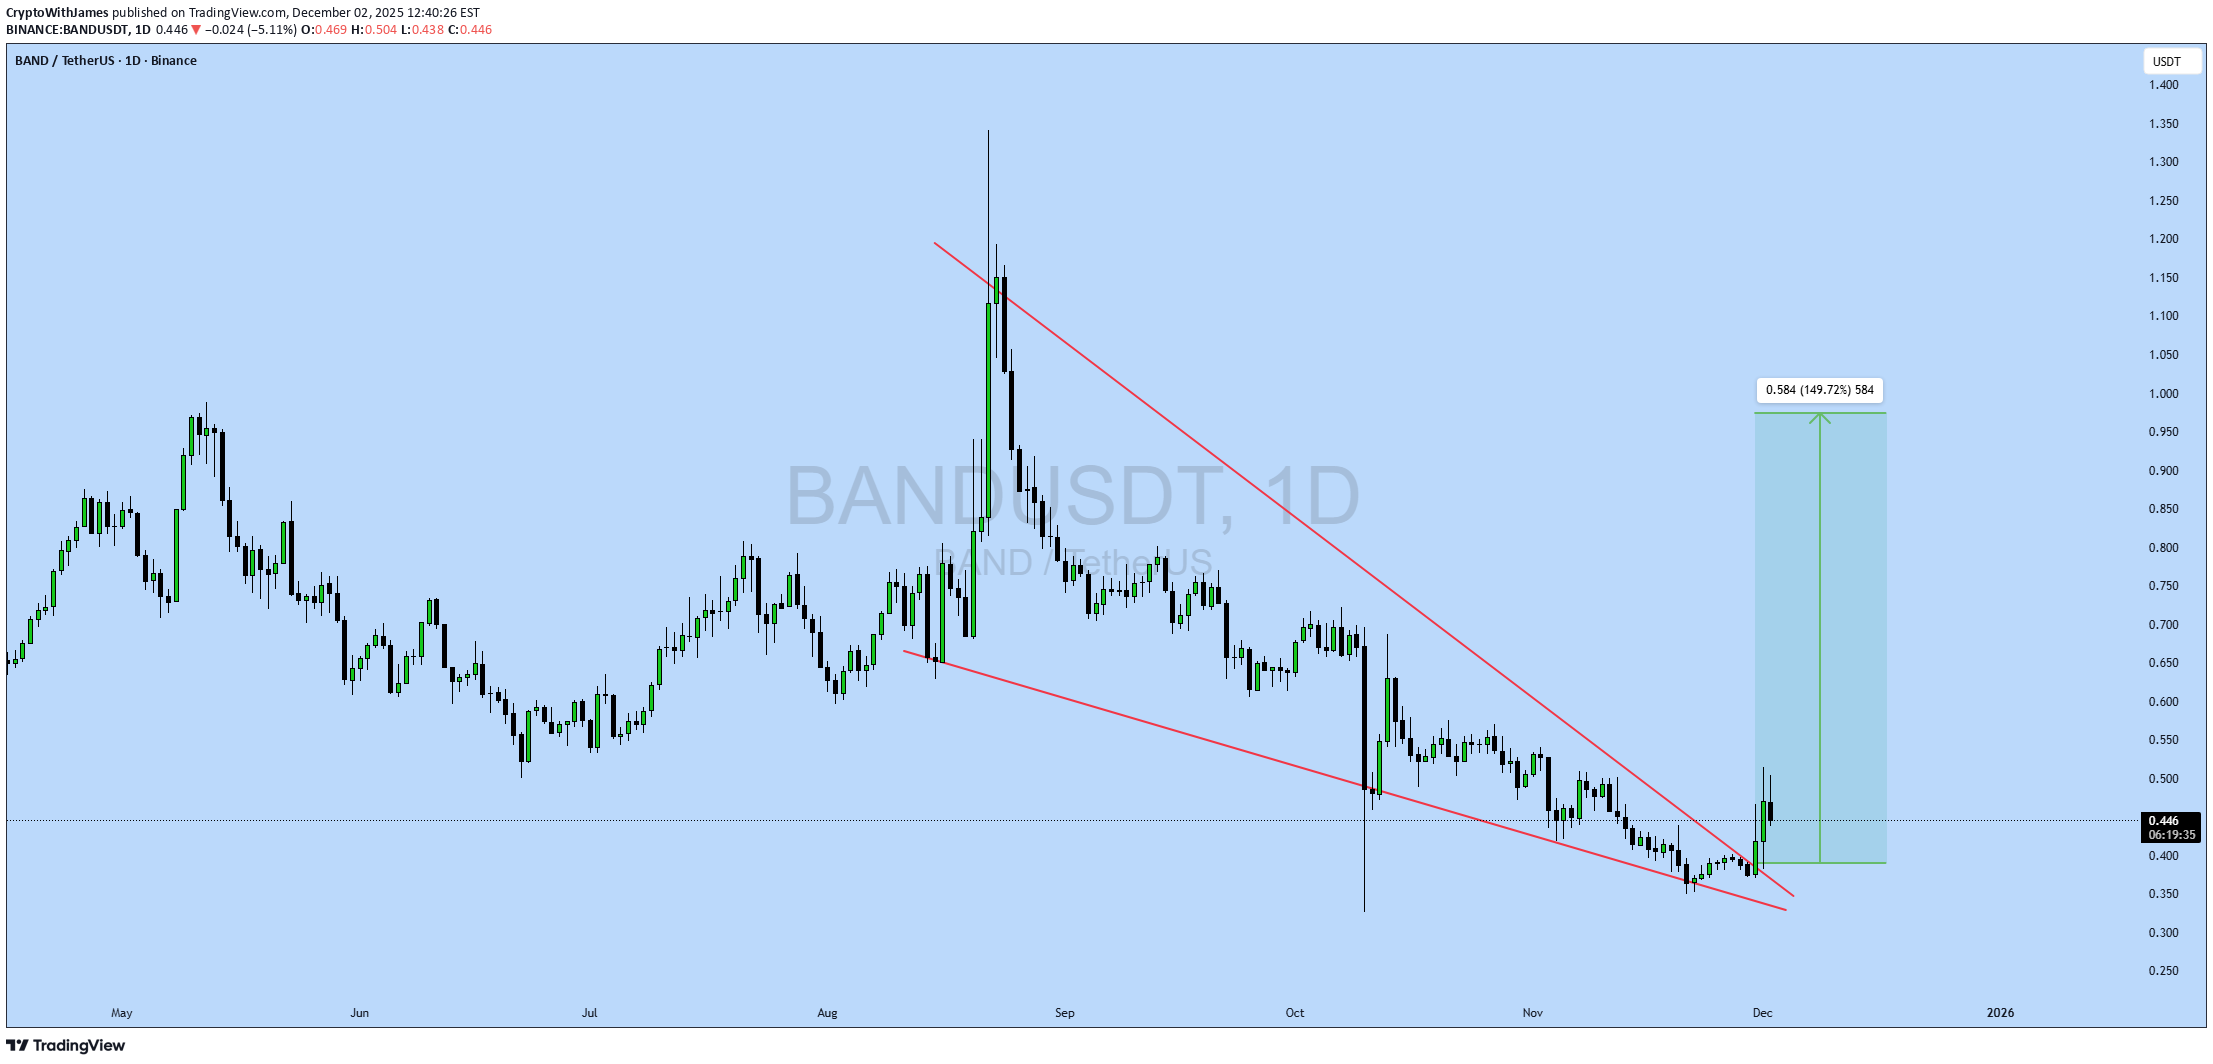
#BAND UPDATE BAND Technical Setup Pattern: Falling Wedge Pattern Current Price: $0.448 Target Price: $0.584 Target % Gain: 149.72% Technical Analysis: BAND is breaking out of a falling wedge pattern on the 1D chart, signaling a bullish reversal after a prolonged downtrend. Price has compressed between descending trendlines and has now pushed above the wedge resistance with strong momentum. The breakout structure suggests continuation to the upside, with the projected target derived from the height of the wedge pointing toward the highlighted resistance zone. Sustained price action above the breakout area strengthens the bullish setup. Time Frame: 1D Risk Management Tip: Always use proper risk management.

Bithereum_io
صعود هیجانانگیزBAND/USDT: آیا این مقاومت شکسته شده زمینه ساز جهش بزرگ است؟
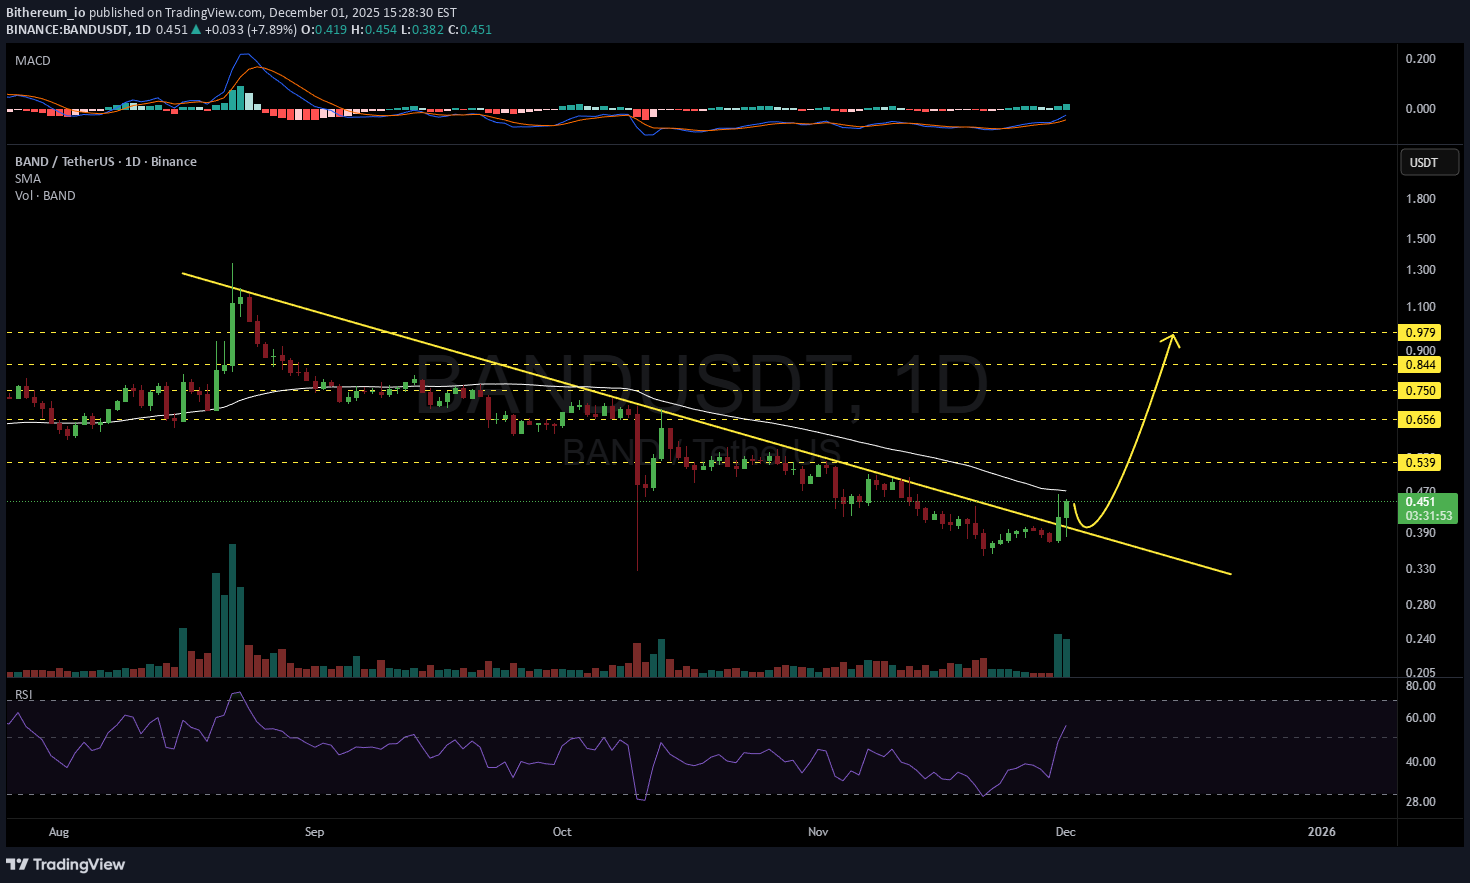
#BAND has broken above the descending resistance with strong volume on the daily chart. It may face a small pullback as it approaches the daily SMA50, potentially retesting the broken trendline. In case of a successful bounce, the targets are: 🎯 $0.539 🎯 $0.656 🎯 $0.750 🎯 $0.844 🎯 $0.979 ⚠️ Always remember to use a tight stop-loss and maintain proper risk management.
CryptoAnalystSignal
آیا گاوها پیروز میشوند یا خرسها؟ تحلیل سرنوشت ساز قیمت BAND/USDT

#BAND The price is moving within a descending channel on the 1-hour frame, adhering well to it, and is heading for a strong breakout and retest. We have a bearish trend on the RSI indicator that is about to be broken and retested, which supports the upward breakout. There is a major support area in green at 0.522, representing a strong support point. We are heading for consolidation above the 100 moving average. Entry price: 0.550 First target: 0.600 Second target: 0.677 Third target: 0.767 Don't forget a simple matter: capital management. When you reach the first target, save some money and then change your stop-loss order to an entry order. For inquiries, please leave a comment. Thank you.

ABU-RAYAN
دايفرجنس إيجابي (Positive Divergence)
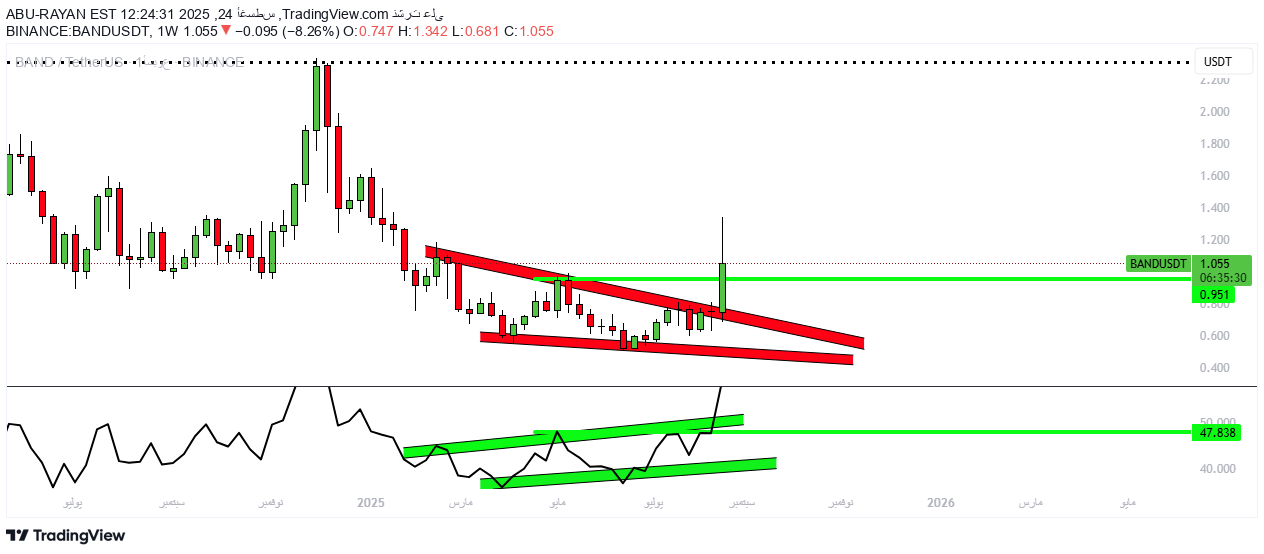
Positive daigens occurs when the price moves in a descending direction (lower new peaks and bottoms), while the technical indicator (such as RSI or MacD) shows higher bottoms. 🔑 This means that the negative momentum loses its strength, and it is often an early indication of the possibility of the reflection of the direction to the rise. ✅ In short: Price: falling and making a lower bottom. Index: climb and make a higher bottom. The result: an inherent purchasing power may pay the price to rise.
Alpha-GoldFX
BANDUSDT Forming Potential Breakout
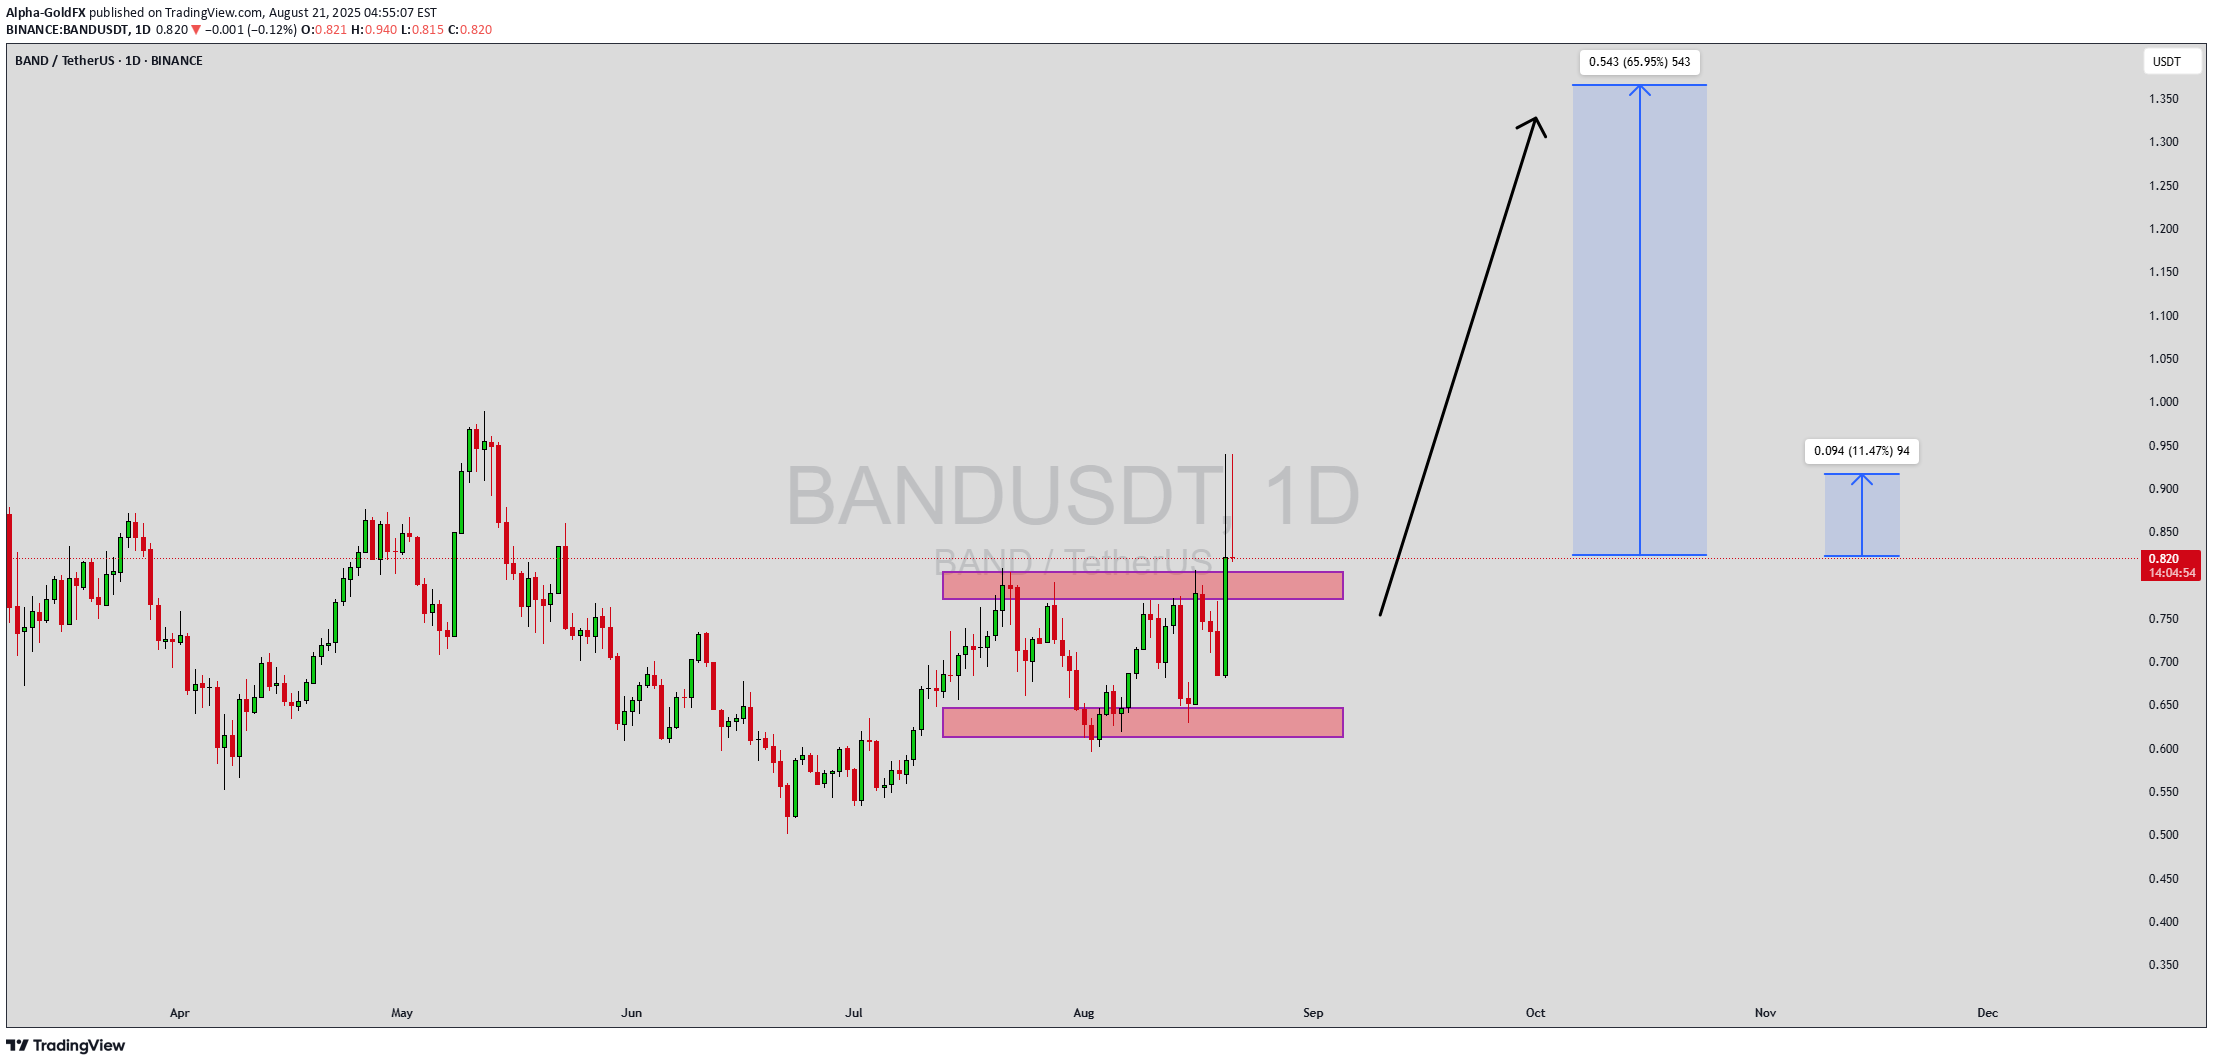
BANDUSDT is currently trading within a well-defined accumulation range and is showing signs of a potential breakout from key resistance. The chart reflects a consolidation pattern with a strong support base forming near the $0.65 zone, and resistance building near the $0.80 level. With increased volume and renewed buying pressure, this setup hints at an incoming bullish move targeting gains of 50% to 60%+ in the near term. The structure on the daily timeframe indicates that BAND is primed for a trend reversal. Multiple rejections from the support zone followed by higher lows suggest that buyers are steadily gaining control. A clean breakout above the upper range could trigger a significant rally, and the upside potential shown in the projection is supported by the volume buildup. This makes BAND an attractive pick for swing traders and mid-term investors watching for breakout confirmations. Investor sentiment appears to be shifting positively towards BAND as it's regaining traction in the broader altcoin market. The recent price behavior indicates growing interest, and if momentum continues to build, this pair could outperform many peers during the upcoming wave. A confirmed breakout could place BAND on the radar of major players looking for undervalued assets with strong upside potential. ✅ Show your support by hitting the like button and ✅ Leaving a comment below! (What is You opinion about this Coin) Your feedback and engagement keep me inspired to share more insightful market analysis with you!

volkanakman82
BAND ANALİZ
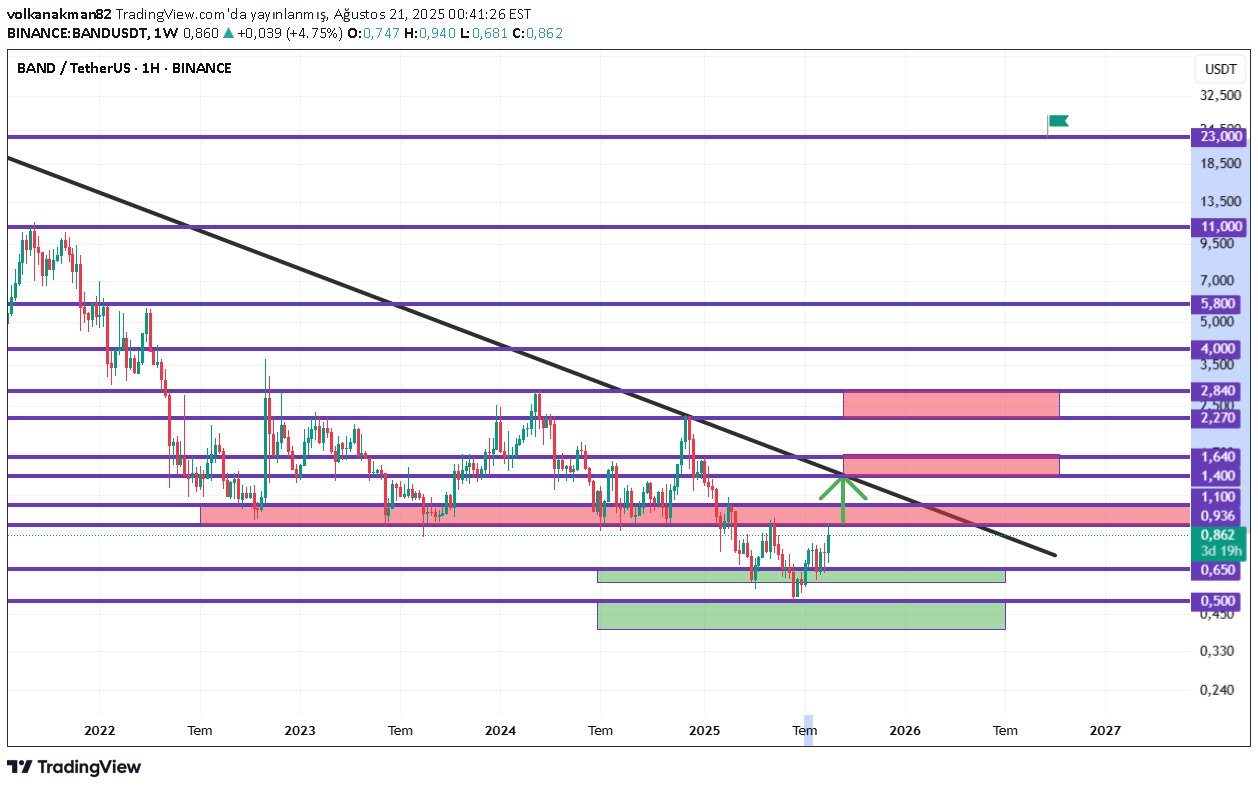
Critical Zone for BAND 1.10! If you can get weekly closures on it, it will be entered into the falling triangular structure and the trend 1.40 theme will come. And if you can exceed the important resistance lines and the final target table as you can see If there is a little patience, there is a potential of about 25 x. If we say minor for retreats 0.65 and major support 0.50
Disclaimer
Any content and materials included in Sahmeto's website and official communication channels are a compilation of personal opinions and analyses and are not binding. They do not constitute any recommendation for buying, selling, entering or exiting the stock market and cryptocurrency market. Also, all news and analyses included in the website and channels are merely republished information from official and unofficial domestic and foreign sources, and it is obvious that users of the said content are responsible for following up and ensuring the authenticity and accuracy of the materials. Therefore, while disclaiming responsibility, it is declared that the responsibility for any decision-making, action, and potential profit and loss in the capital market and cryptocurrency market lies with the trader.